| Param | Original file | Final file |
|---|---|---|
| Filename | modeM0/AS1A14_083T05_9000006560_56734cztM0_level2.fits | modeM0/AS1A14_083T05_9000006560_56734cztM0_level2_quad_clean.evt |
| Size (bytes) | 1,244,234,880 | 218,862,720 |
| Size | 1.2 GB | 208.7 MB |
| Events in quadrant A | 11,772,530 | 1,394,775 |
| Events in quadrant B | 8,908,872 | 1,589,327 |
| Events in quadrant C | 15,795,681 | 1,155,874 |
| Events in quadrant D | 8,317,049 | 1,361,267 |
| Mode SS | |||
|---|---|---|---|
| Quadrant | BADHDUFLAG | Total packets | Discarded packets |
| A | 0 | 334 | 0 |
| B | 0 | 334 | 0 |
| C | 0 | 334 | 0 |
| D | 0 | 334 | 0 |
| Mode M0 | |||
|---|---|---|---|
| Quadrant | BADHDUFLAG | Total packets | Discarded packets |
| A | 0 | 46463 | 3 |
| B | 0 | 38037 | 3 |
| C | 0 | 58483 | 3 |
| D | 0 | 36073 | 3 |
| Mode M9 | |||
|---|---|---|---|
| Quadrant | BADHDUFLAG | Total packets | Discarded packets |
| A | 0 | 15 | 0 |
| B | 0 | 15 | 0 |
| C | 0 | 15 | 0 |
| D | 0 | 15 | 0 |
| Quadrant | Total seconds | Saturated seconds | Saturation percentage |
|---|---|---|---|
| A | 16306 | 1544 | 9.468907% |
| B | 16306 | 586 | 3.593769% |
| C | 16307 | 3507 | 21.506102% |
| D | 16307 | 270 | 1.655731% |
Noise dominated data is calculated using 1-second bins in cleaned event files. If a bin has >2000 counts, and if more than 50% of those come from <1% of pixels, then it is considered to be noise-dominated and hence unusable.
| Quadrant | # 1 sec bins | Bins with >0 counts | Bins with >2000 counts | High rate bins dominated by noise | Noise dominated (total time) | Noise dominated (detector-on time) | Marked lightcurve |
|---|---|---|---|---|---|---|---|
| A | 17896 | 16306 | 1314 | 1314 | 7.34% | 8.06% | 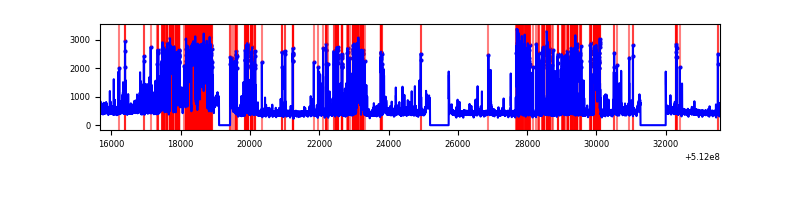 |
| B | 17896 | 16306 | 265 | 265 | 1.48% | 1.63% | 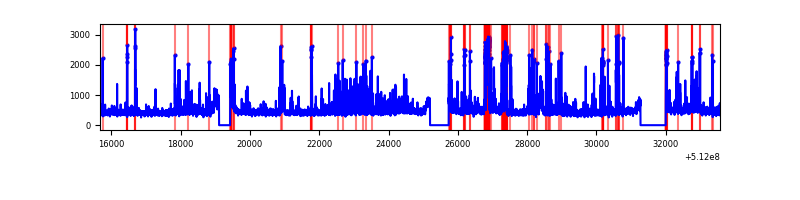 |
| C | 17897 | 16307 | 3015 | 3015 | 16.85% | 18.49% | 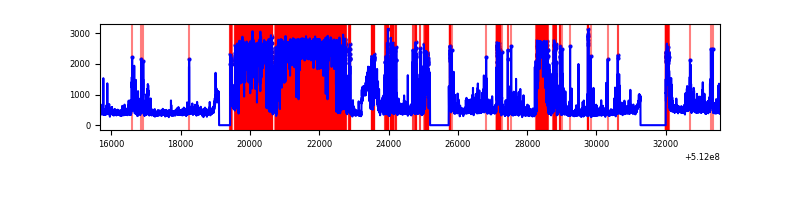 |
| D | 17897 | 16307 | 105 | 105 | 0.59% | 0.64% | 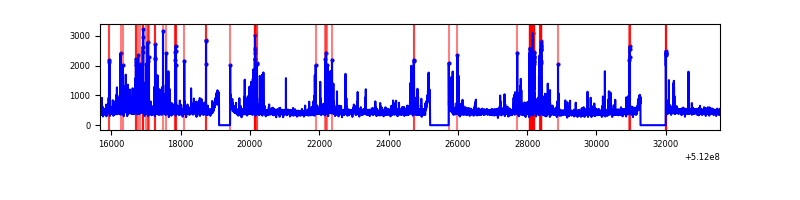 |
Top three noisy pixels from each quadrant. If the there are fewer than three noisy pixels in the level2.evt file, extra rows are filled as -1
| Pixel properties | Quadrant properties | ||||||
|---|---|---|---|---|---|---|---|
| Quadrant | DetID | PixID | Counts | Sigma | Mean | Median | Sigma |
| A | 3 | 62 | 3319093 | 7860.63 | 1709 | 1666 | 422.0 |
| A | 10 | 251 | 878991 | 2078.82 | 1709 | 1666 | 422.0 |
| A | 4 | 249 | 477420 | 1127.3 | 1709 | 1666 | 422.0 |
| B | 5 | 185 | 910840 | 2431.35 | 1737 | 1673 | 373.9 |
| B | 8 | 128 | 720330 | 1921.88 | 1737 | 1673 | 373.9 |
| B | 10 | 16 | 153057 | 404.84 | 1737 | 1673 | 373.9 |
| C | 15 | 230 | 8669584 | 20852.72 | 1533 | 1522 | 415.7 |
| C | 6 | 223 | 151510 | 360.83 | 1533 | 1522 | 415.7 |
| C | 15 | 199 | 134948 | 320.98 | 1533 | 1522 | 415.7 |
| D | 2 | 249 | 786420 | 1619.32 | 1723 | 1647 | 484.6 |
| D | 2 | 31 | 159687 | 326.1 | 1723 | 1647 | 484.6 |
| D | 5 | 173 | 144980 | 295.76 | 1723 | 1647 | 484.6 |
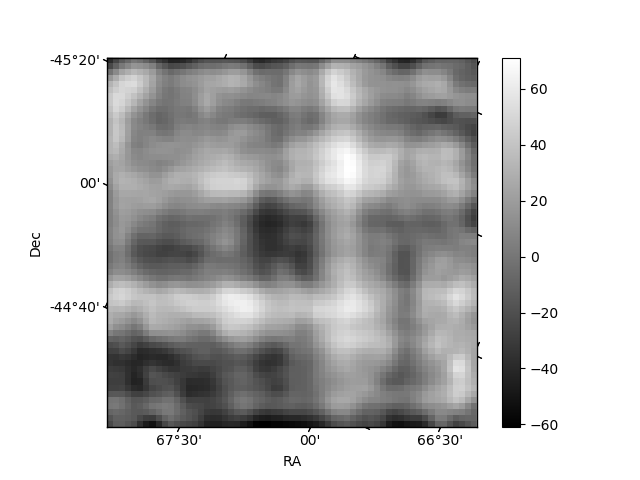
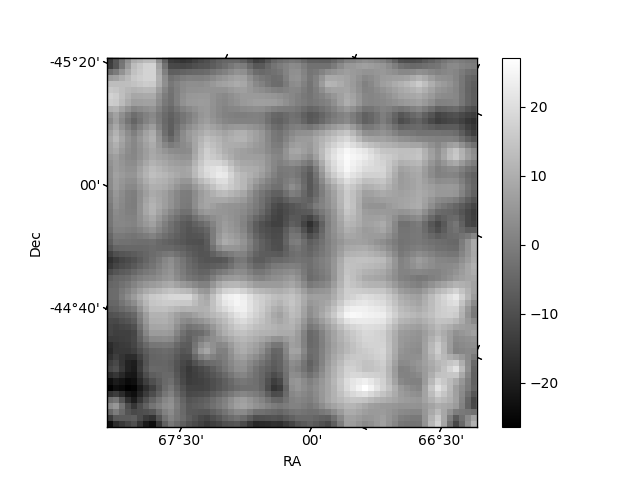
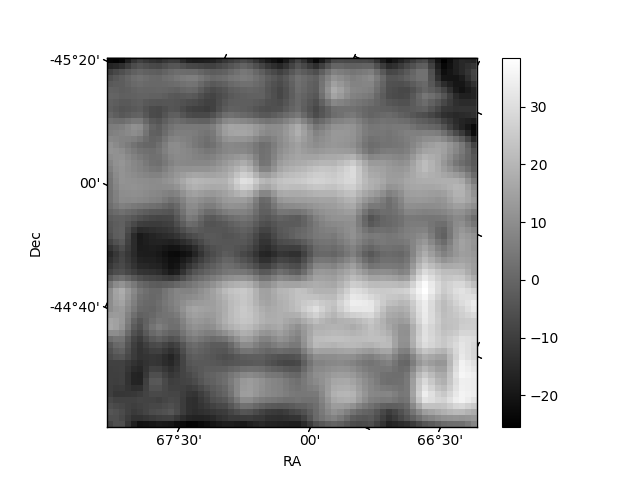
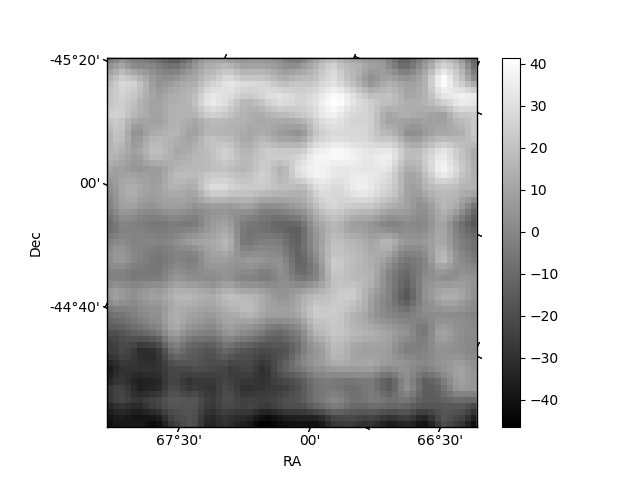
Histogram calculated using DETX and DETY for each event in the final _common_clean file
| Quadrant A | 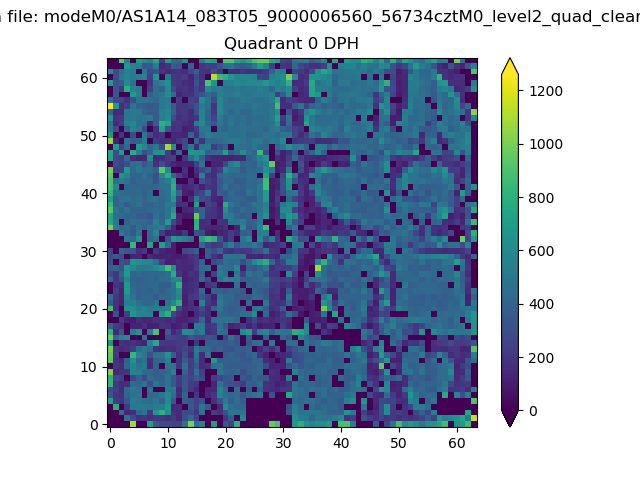 |
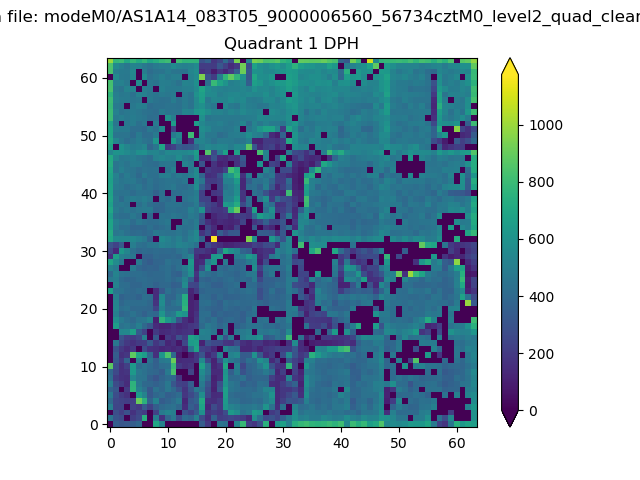 |
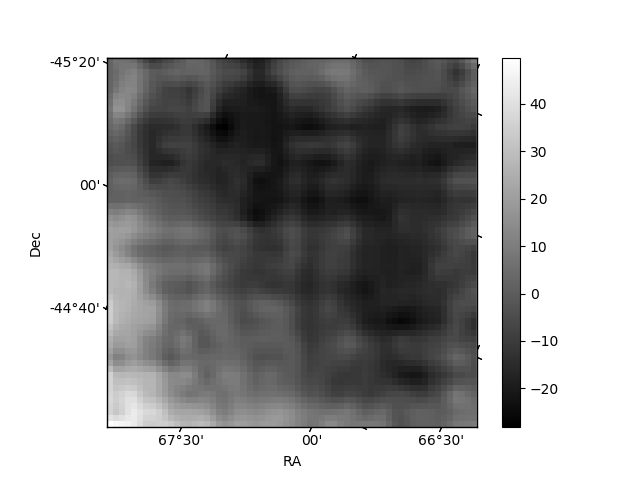
Quadrant B |
|---|---|---|---|
| Quadrant D | 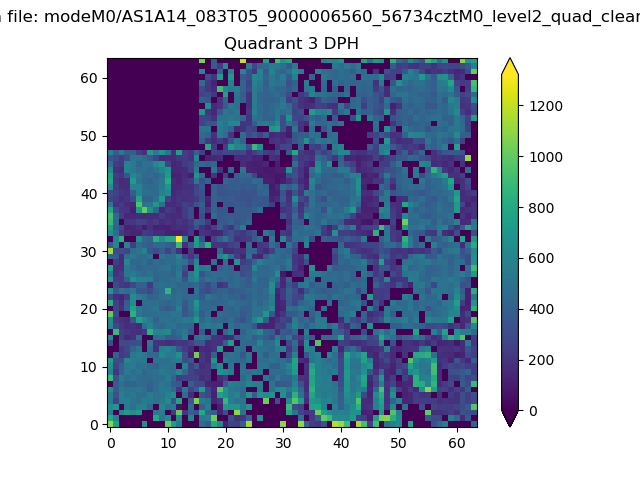 |
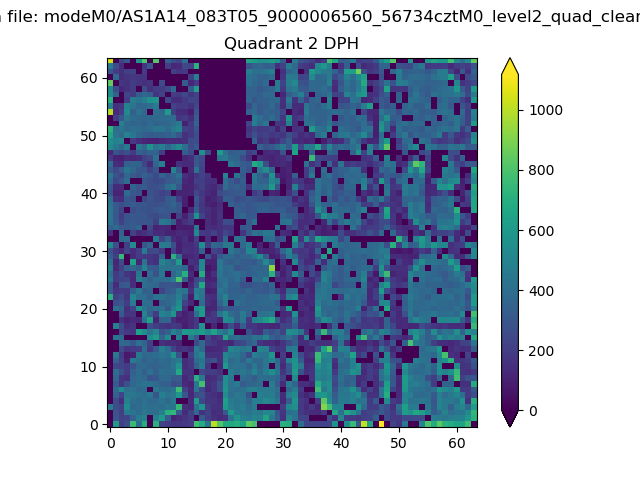 |
Quadrant C |
| Plot type | Count rate plots | Images |
|---|---|---|
| Comparison with Poisson distribution Blue bars denote a histogram of data divided into 1 sec bins. Red curve is a Poisson curve with rate = median count rate of data. |
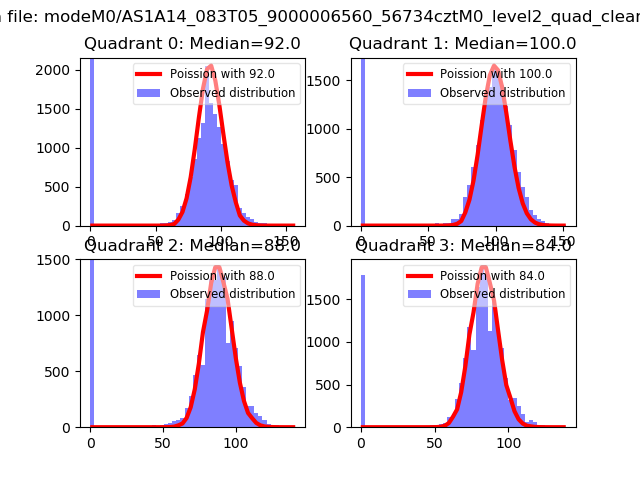 |
 |
| Quadrant-wise count rates Data is divided into 100 sec bins |
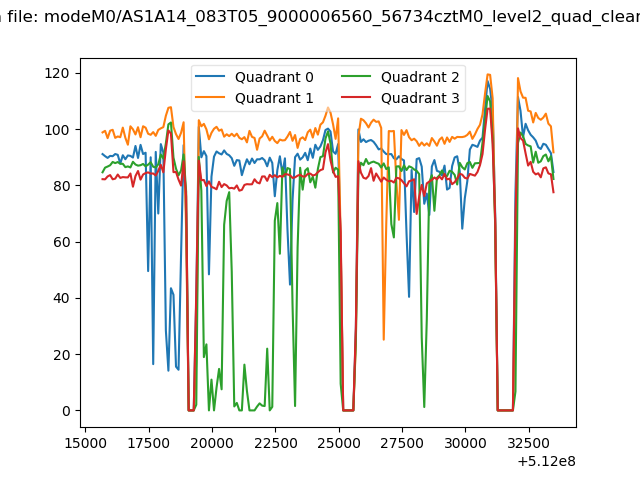 |
|
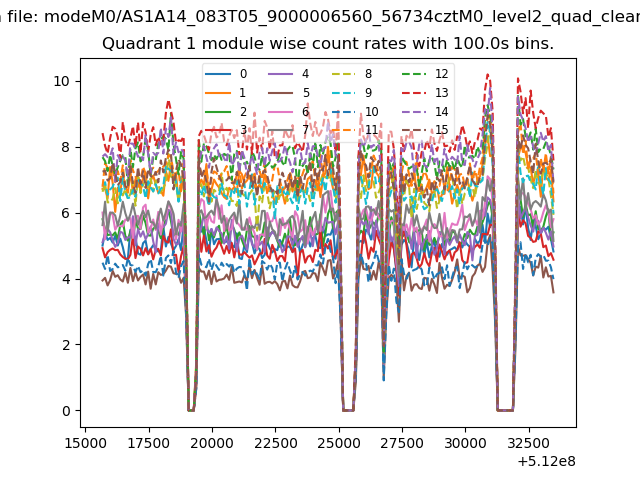
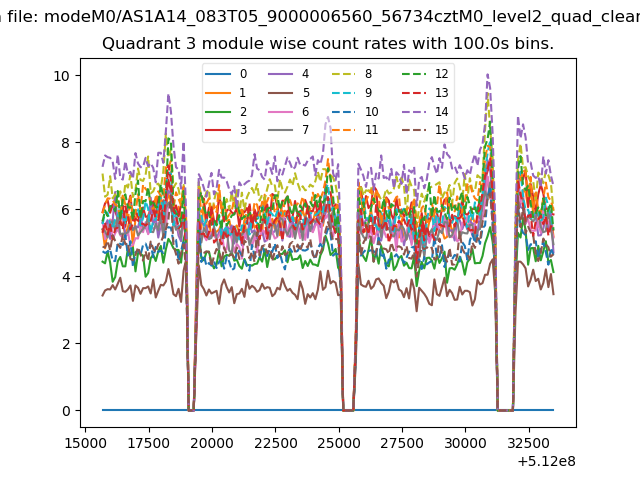
| Module-wise count rates for Quadrant A Data is divided into 100 sec bins |
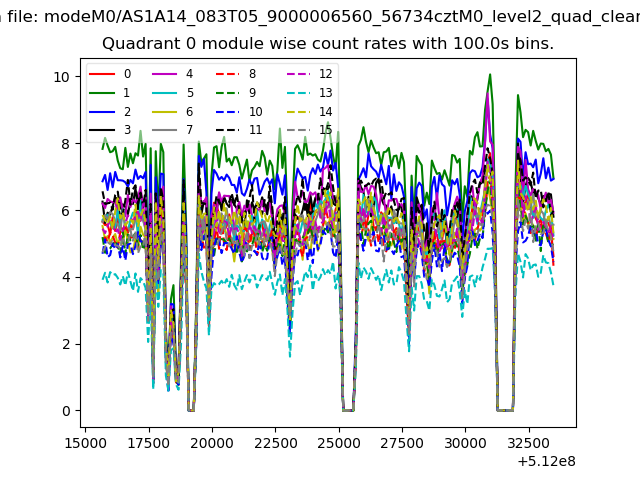 |
 |
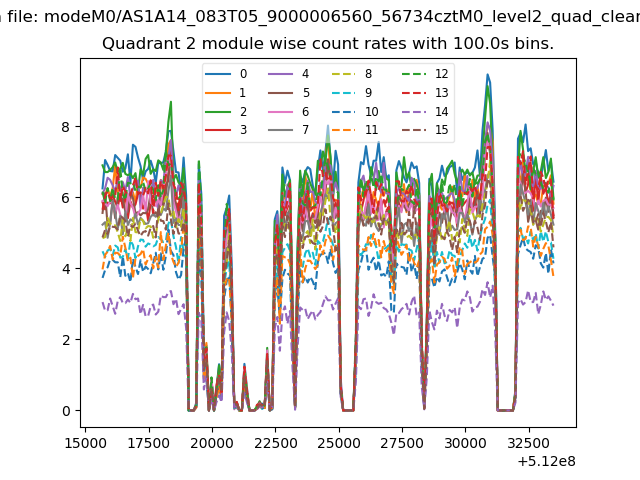
| Module-wise count rates for Quadrant B Data is divided into 100 sec bins |
 |
 |
| Module-wise count rates for Quadrant C Data is divided into 100 sec bins |
 |
 |
| Module-wise count rates for Quadrant D Data is divided into 100 sec bins |
 |
 |
| Parameter | Plot |
|---|---|
| CZT HV Monitor | 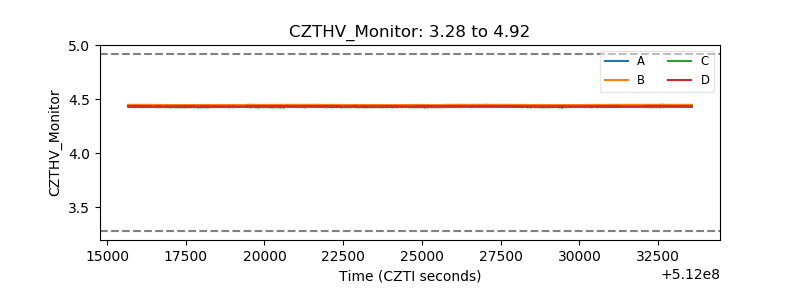 |
| D_VDD | 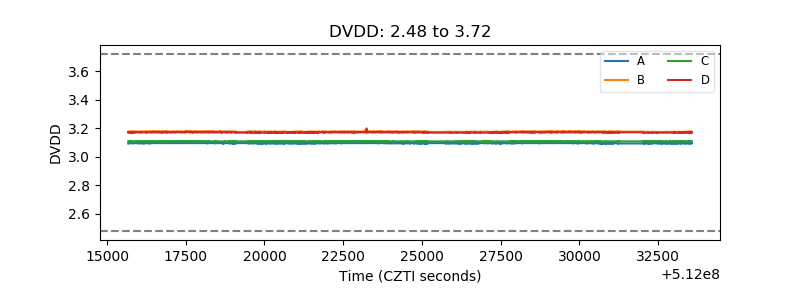 |
| Temperature 1 | 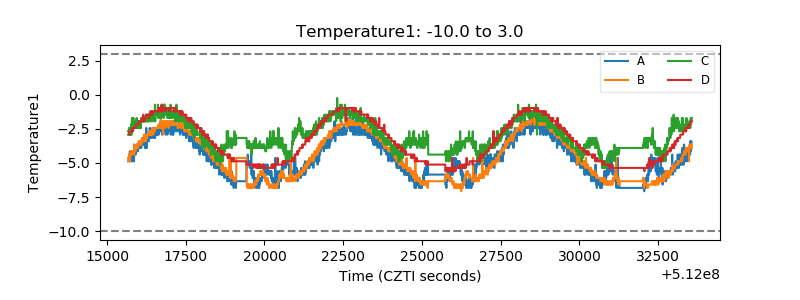 |
| Veto HV Monitor | 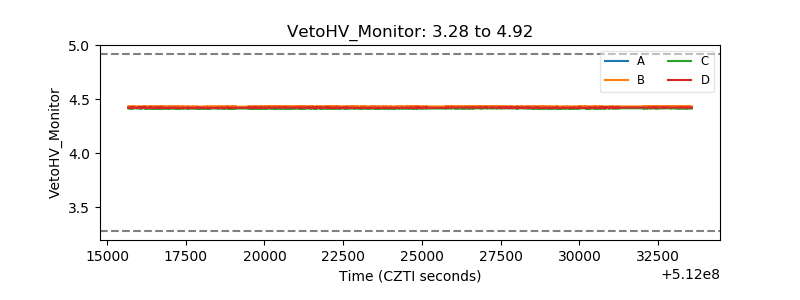 |
| Veto LLD | 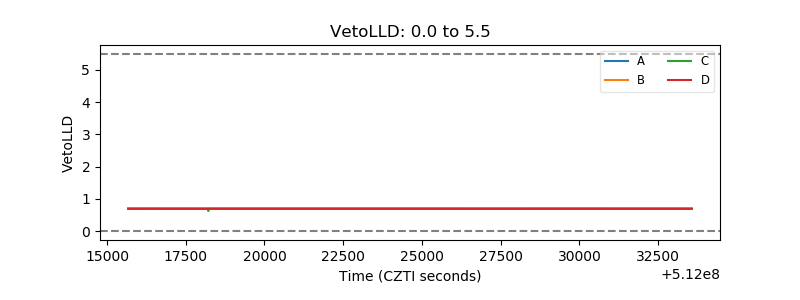 |
| Alpha Counter | 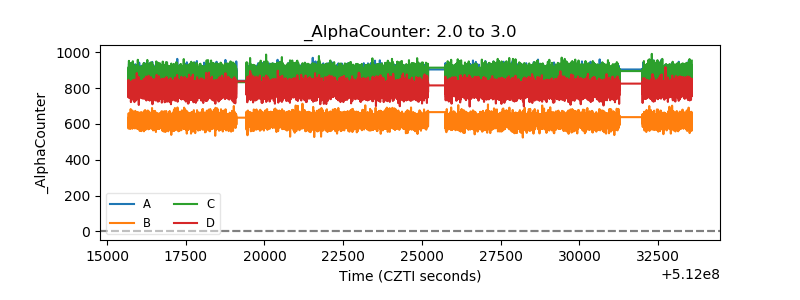 |
| _CPM_Rate | 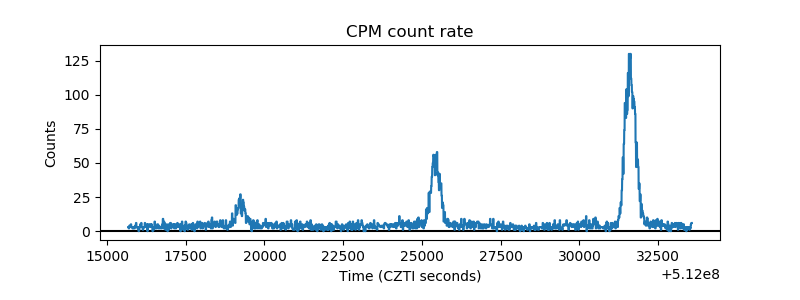 |
| CZT Counter | 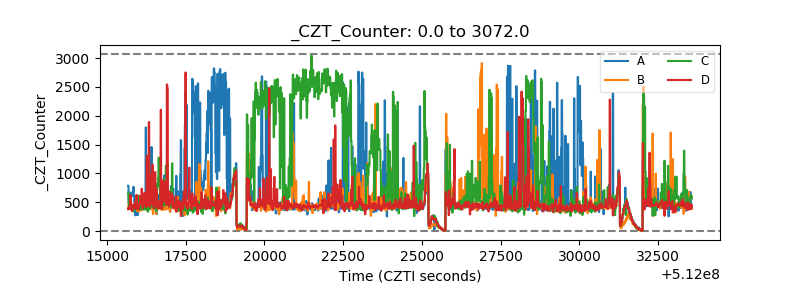 |
| +2.5 Volts monitor |  |
| +5 Volts monitor |  |
| _ROLL_ROT | 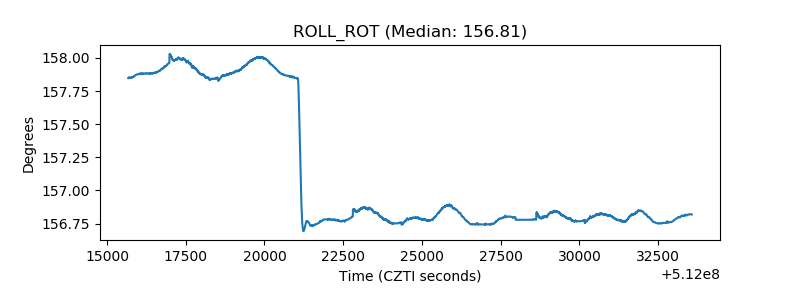 |
| _Roll_DEC | 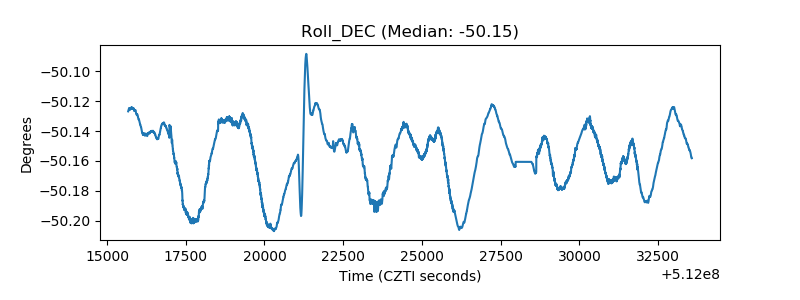 |
| _Roll_RA | 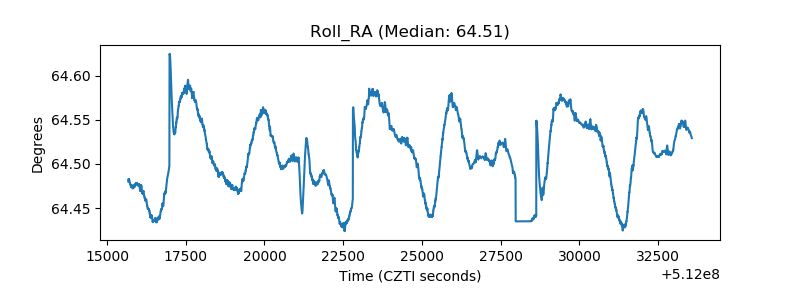 |
| Veto Counter | 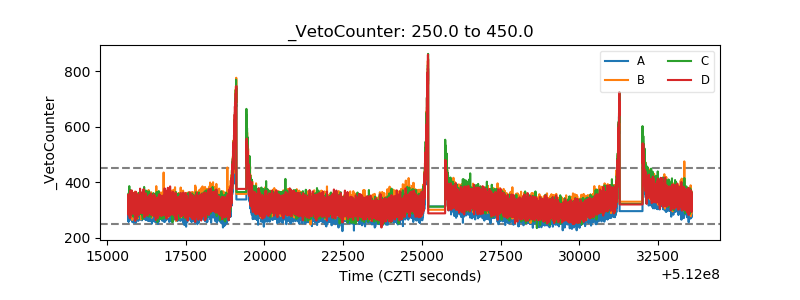 |