| Param | Original file | Final file |
|---|---|---|
| Filename | modeM0/AS1A14_083T05_9000006560_56735cztM0_level2.fits | modeM0/AS1A14_083T05_9000006560_56735cztM0_level2_quad_clean.evt |
| Size (bytes) | 454,403,520 | 100,013,760 |
| Size | 433.4 MB | 95.4 MB |
| Events in quadrant A | 3,615,548 | 657,390 |
| Events in quadrant B | 3,996,894 | 705,105 |
| Events in quadrant C | 5,236,729 | 586,324 |
| Events in quadrant D | 3,438,004 | 601,448 |
| Mode SS | |||
|---|---|---|---|
| Quadrant | BADHDUFLAG | Total packets | Discarded packets |
| A | 0 | 140 | 0 |
| B | 0 | 140 | 0 |
| C | 0 | 140 | 0 |
| D | 0 | 140 | 0 |
| Mode M0 | |||
|---|---|---|---|
| Quadrant | BADHDUFLAG | Total packets | Discarded packets |
| A | 0 | 15622 | 2 |
| B | 0 | 16598 | 2 |
| C | 0 | 20290 | 2 |
| D | 0 | 14764 | 2 |
| Mode M9 | |||
|---|---|---|---|
| Quadrant | BADHDUFLAG | Total packets | Discarded packets |
| A | 0 | 9 | 0 |
| B | 0 | 9 | 0 |
| C | 0 | 9 | 0 |
| D | 0 | 9 | 0 |
| Quadrant | Total seconds | Saturated seconds | Saturation percentage |
|---|---|---|---|
| A | 6859 | 200 | 2.915877% |
| B | 6859 | 228 | 3.324100% |
| C | 6859 | 634 | 9.243330% |
| D | 6859 | 71 | 1.035136% |
Noise dominated data is calculated using 1-second bins in cleaned event files. If a bin has >2000 counts, and if more than 50% of those come from <1% of pixels, then it is considered to be noise-dominated and hence unusable.
| Quadrant | # 1 sec bins | Bins with >0 counts | Bins with >2000 counts | High rate bins dominated by noise | Noise dominated (total time) | Noise dominated (detector-on time) | Marked lightcurve |
|---|---|---|---|---|---|---|---|
| A | 7714 | 6859 | 130 | 130 | 1.69% | 1.90% | 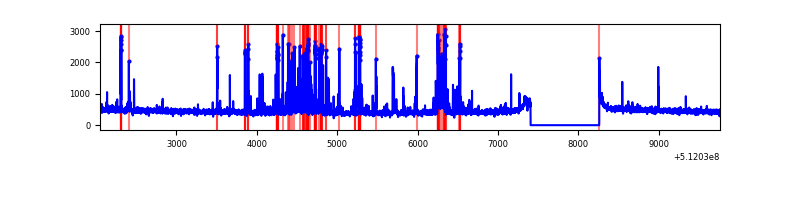 |
| B | 7714 | 6859 | 102 | 102 | 1.32% | 1.49% | 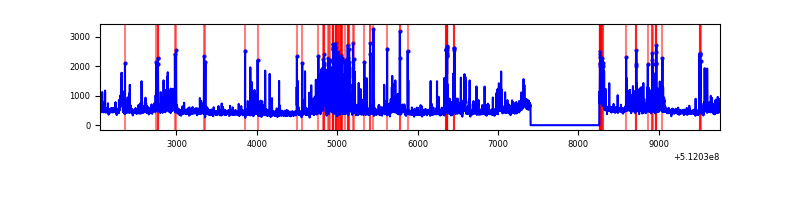 |
| C | 7714 | 6859 | 515 | 515 | 6.68% | 7.51% | 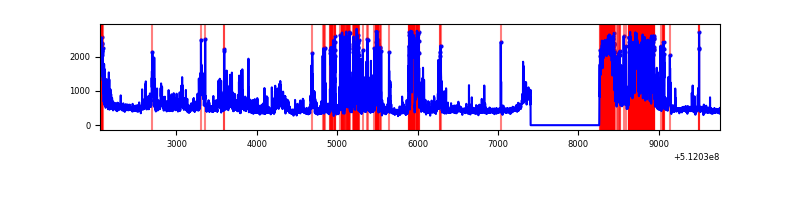 |
| D | 7714 | 6859 | 11 | 11 | 0.14% | 0.16% | 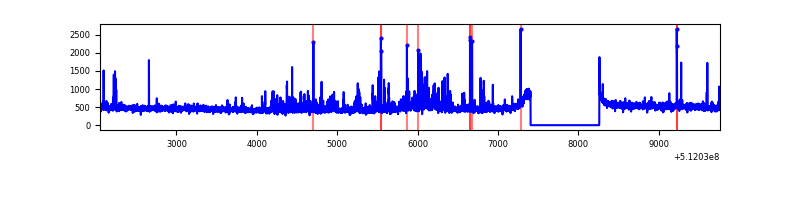 |
Top three noisy pixels from each quadrant. If the there are fewer than three noisy pixels in the level2.evt file, extra rows are filled as -1
| Pixel properties | Quadrant properties | ||||||
|---|---|---|---|---|---|---|---|
| Quadrant | DetID | PixID | Counts | Sigma | Mean | Median | Sigma |
| A | 3 | 62 | 393953 | 2116.86 | 754 | 735 | 185.8 |
| A | 10 | 251 | 188926 | 1013.11 | 754 | 735 | 185.8 |
| A | 4 | 249 | 64567 | 343.63 | 754 | 735 | 185.8 |
| B | 5 | 185 | 348399 | 2170.45 | 740 | 710 | 160.2 |
| B | 4 | 206 | 292368 | 1820.68 | 740 | 710 | 160.2 |
| B | 8 | 128 | 269746 | 1679.46 | 740 | 710 | 160.2 |
| C | 15 | 230 | 1998593 | 10244.63 | 704 | 697 | 195.0 |
| C | 6 | 223 | 131955 | 673.05 | 704 | 697 | 195.0 |
| C | 12 | 112 | 105285 | 536.3 | 704 | 697 | 195.0 |
| D | 5 | 113 | 159572 | 764.3 | 739 | 706 | 207.9 |
| D | 2 | 249 | 155678 | 745.57 | 739 | 706 | 207.9 |
| D | 5 | 173 | 54983 | 261.12 | 739 | 706 | 207.9 |
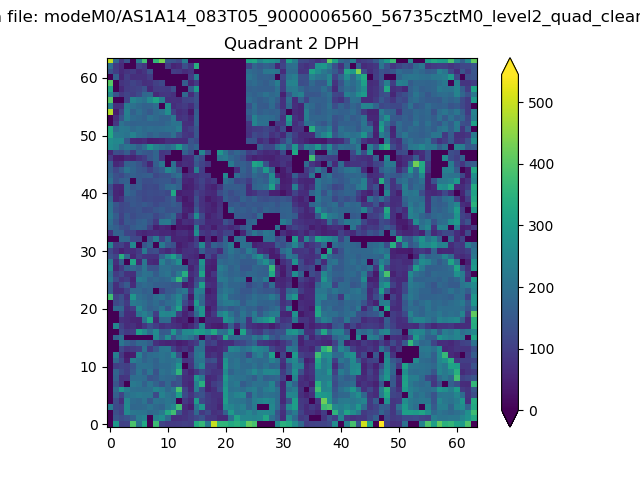
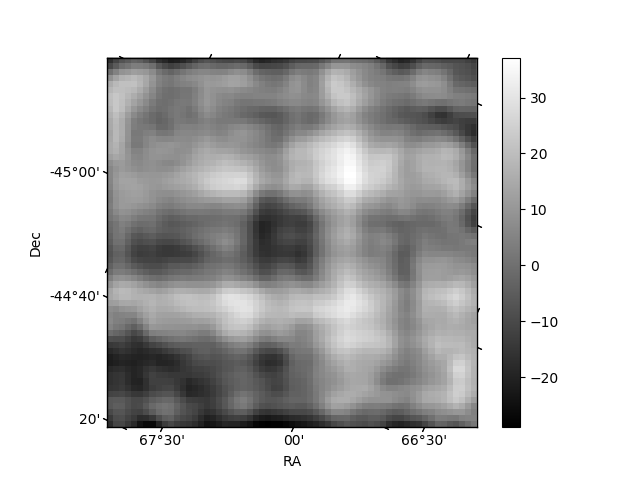
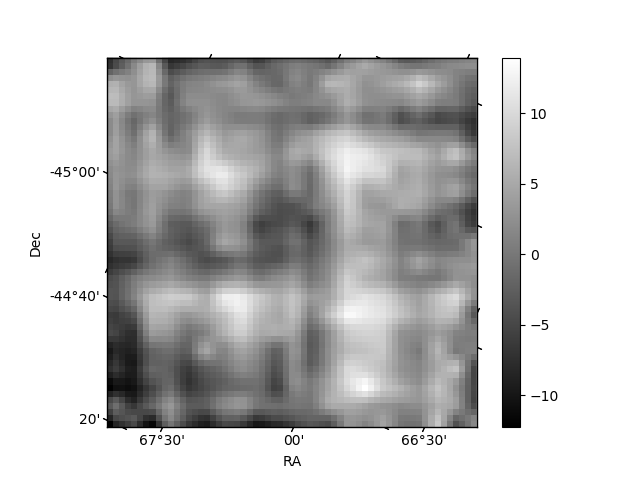
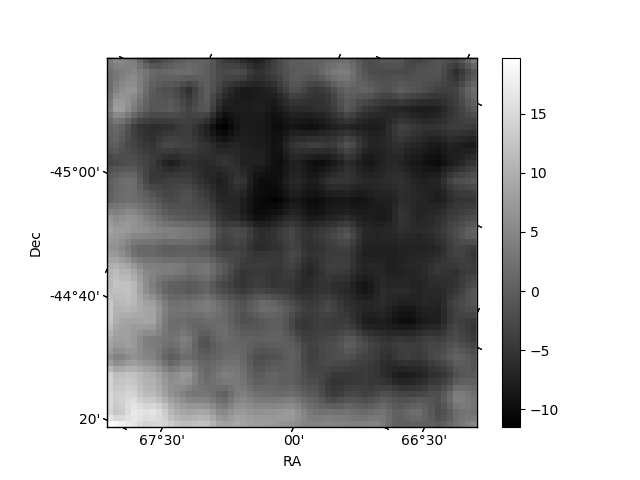
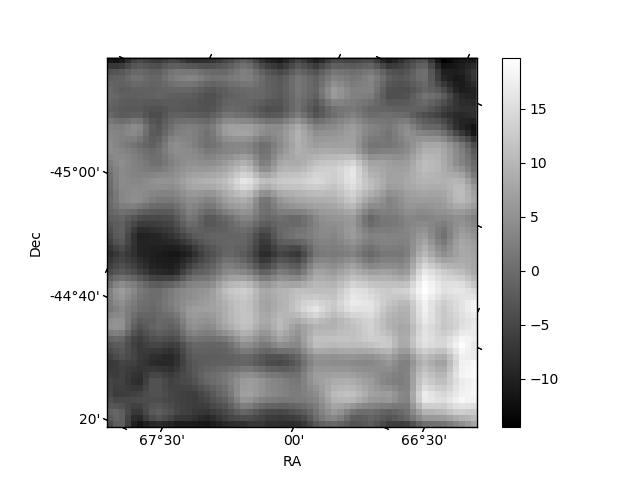
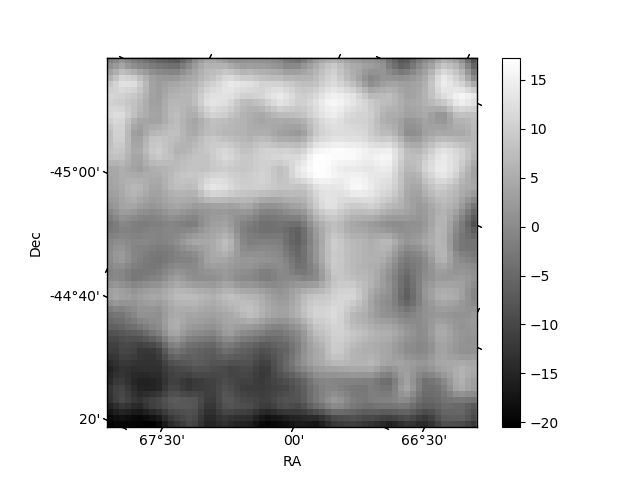
Histogram calculated using DETX and DETY for each event in the final _common_clean file
| Quadrant A | 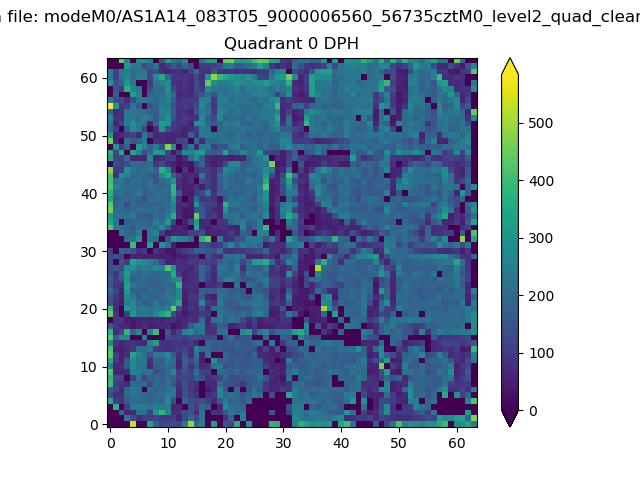 |
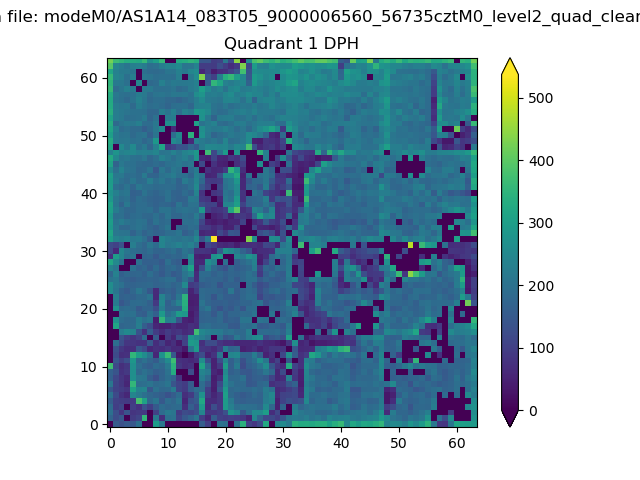 |
Quadrant B |
|---|---|---|---|
| Quadrant D | 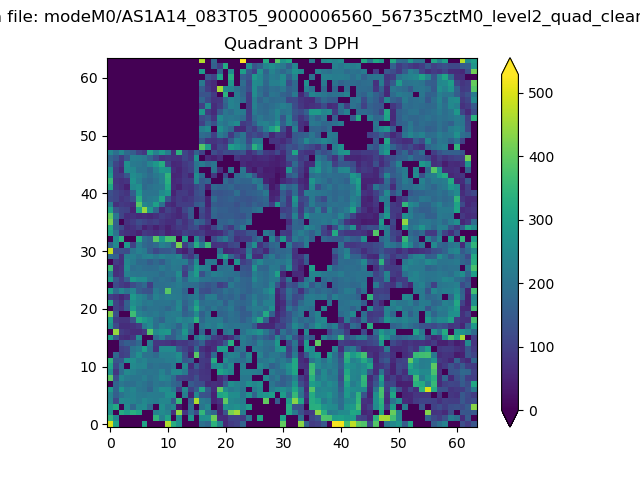 |
 |
Quadrant C |
| Plot type | Count rate plots | Images |
|---|---|---|
| Comparison with Poisson distribution Blue bars denote a histogram of data divided into 1 sec bins. Red curve is a Poisson curve with rate = median count rate of data. |
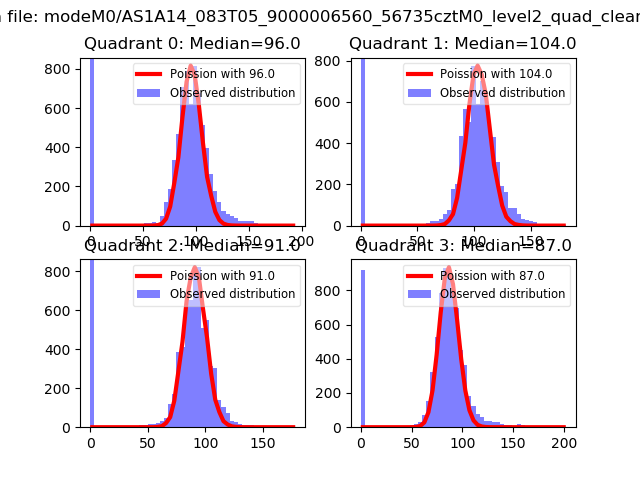 |
 |
| Quadrant-wise count rates Data is divided into 100 sec bins |
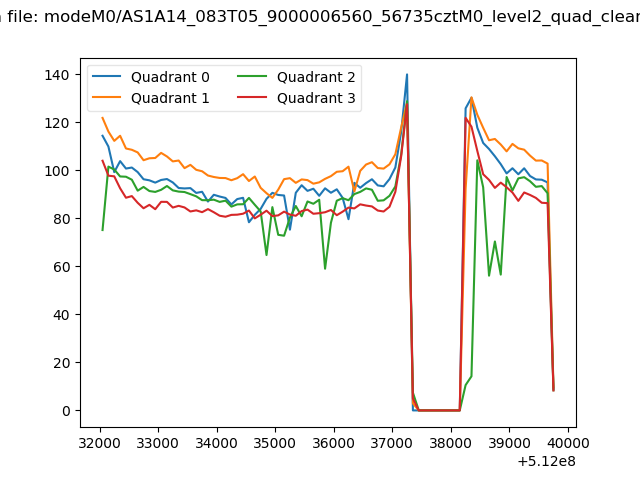 |
|
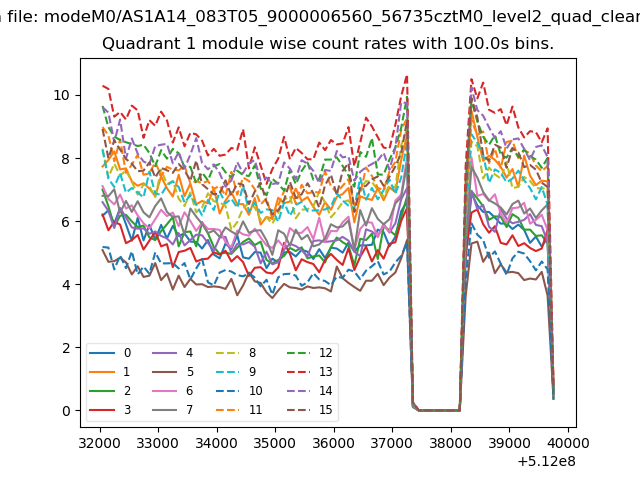
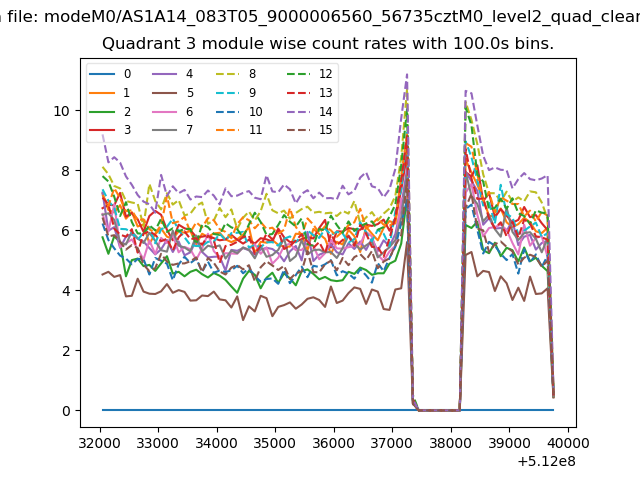
| Module-wise count rates for Quadrant A Data is divided into 100 sec bins |
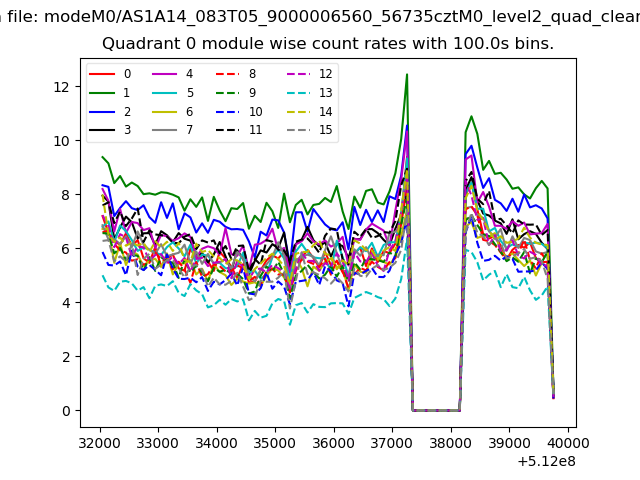 |
 |
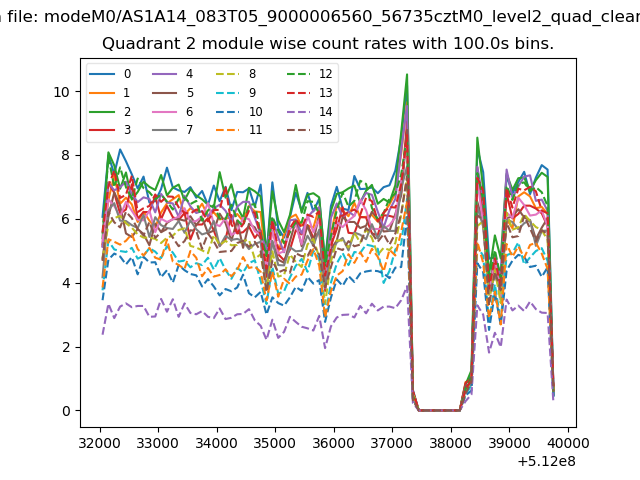
| Module-wise count rates for Quadrant B Data is divided into 100 sec bins |
 |
 |
| Module-wise count rates for Quadrant C Data is divided into 100 sec bins |
 |
 |
| Module-wise count rates for Quadrant D Data is divided into 100 sec bins |
 |
 |
| Parameter | Plot |
|---|---|
| CZT HV Monitor | 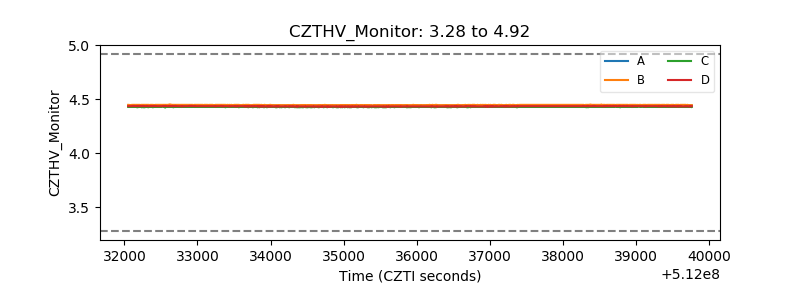 |
| D_VDD | 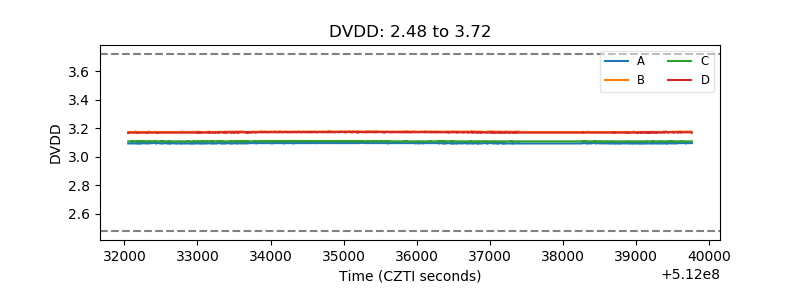 |
| Temperature 1 | 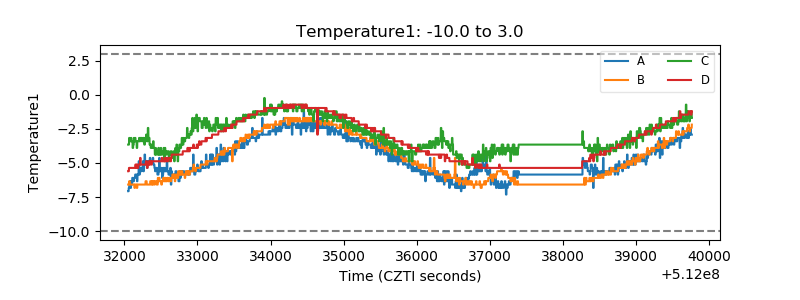 |
| Veto HV Monitor | 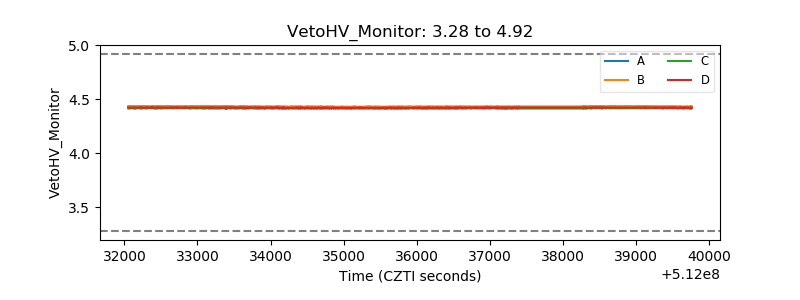 |
| Veto LLD | 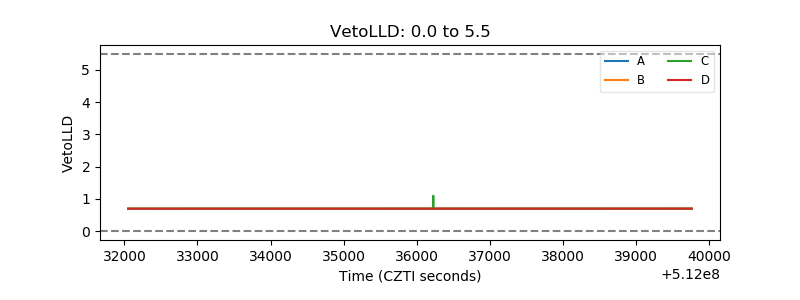 |
| Alpha Counter | 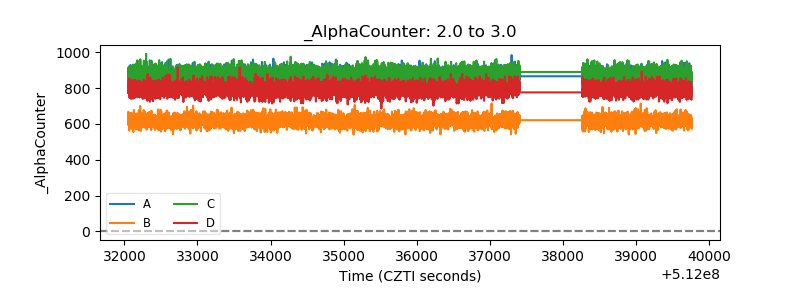 |
| _CPM_Rate | 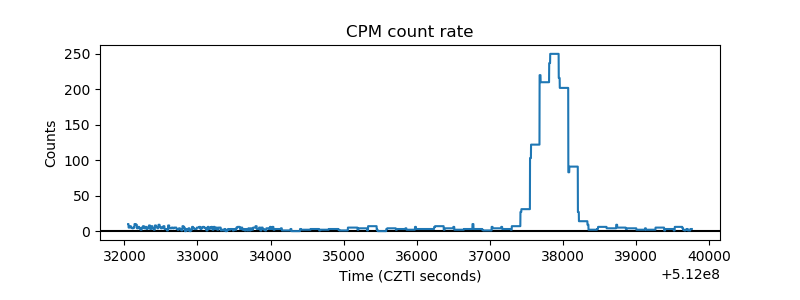 |
| CZT Counter | 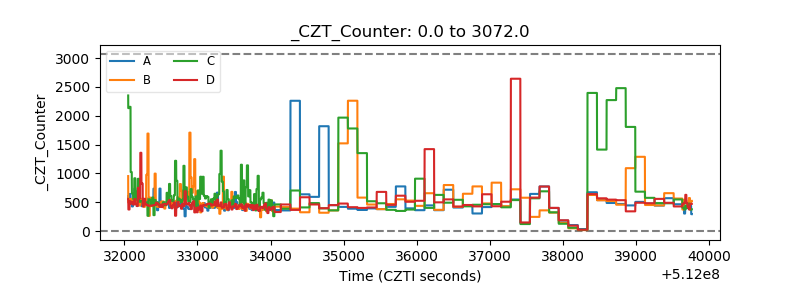 |
| +2.5 Volts monitor |  |
| +5 Volts monitor |  |
| _ROLL_ROT | 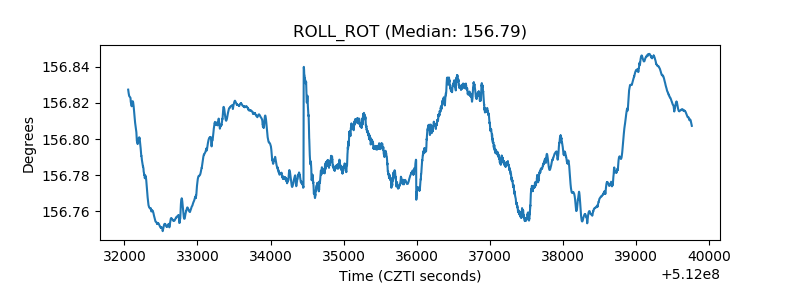 |
| _Roll_DEC | 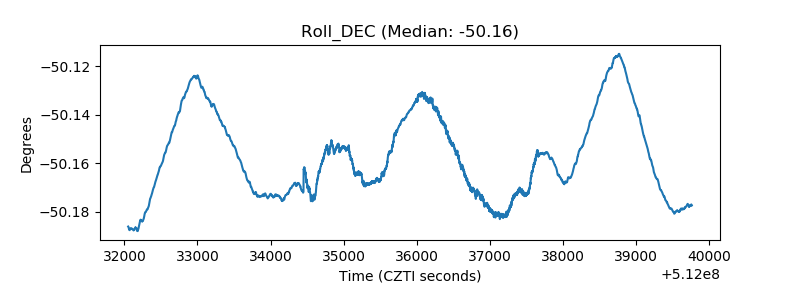 |
| _Roll_RA | 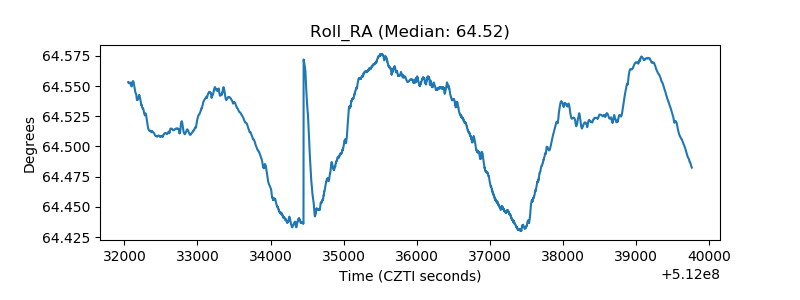 |
| Veto Counter | 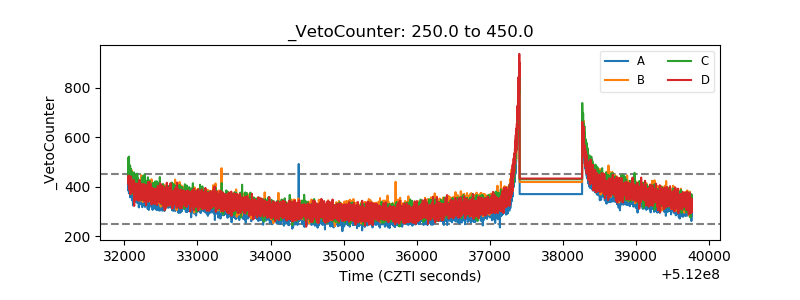 |