| Param | Original file | Final file |
|---|---|---|
| Filename | modeM0/AS1A14_083T05_9000006560_56738cztM0_level2.fits | modeM0/AS1A14_083T05_9000006560_56738cztM0_level2_quad_clean.evt |
| Size (bytes) | 532,987,200 | 94,533,120 |
| Size | 508.3 MB | 90.2 MB |
| Events in quadrant A | 4,107,261 | 621,425 |
| Events in quadrant B | 4,485,743 | 682,633 |
| Events in quadrant C | 7,389,048 | 514,917 |
| Events in quadrant D | 3,236,599 | 584,621 |
| Mode SS | |||
|---|---|---|---|
| Quadrant | BADHDUFLAG | Total packets | Discarded packets |
| A | 0 | 134 | 0 |
| B | 0 | 134 | 0 |
| C | 0 | 134 | 0 |
| D | 0 | 134 | 0 |
| Mode M0 | |||
|---|---|---|---|
| Quadrant | BADHDUFLAG | Total packets | Discarded packets |
| A | 0 | 16852 | 1 |
| B | 0 | 17807 | 1 |
| C | 0 | 26590 | 1 |
| D | 0 | 14016 | 1 |
| Mode M9 | |||
|---|---|---|---|
| Quadrant | BADHDUFLAG | Total packets | Discarded packets |
| A | 0 | 10 | 0 |
| B | 0 | 10 | 0 |
| C | 0 | 10 | 0 |
| D | 0 | 10 | 0 |
| Quadrant | Total seconds | Saturated seconds | Saturation percentage |
|---|---|---|---|
| A | 6576 | 452 | 6.873479% |
| B | 6576 | 331 | 5.033455% |
| C | 6576 | 1288 | 19.586375% |
| D | 6576 | 54 | 0.821168% |
Noise dominated data is calculated using 1-second bins in cleaned event files. If a bin has >2000 counts, and if more than 50% of those come from <1% of pixels, then it is considered to be noise-dominated and hence unusable.
| Quadrant | # 1 sec bins | Bins with >0 counts | Bins with >2000 counts | High rate bins dominated by noise | Noise dominated (total time) | Noise dominated (detector-on time) | Marked lightcurve |
|---|---|---|---|---|---|---|---|
| A | 7635 | 6575 | 389 | 389 | 5.09% | 5.92% | 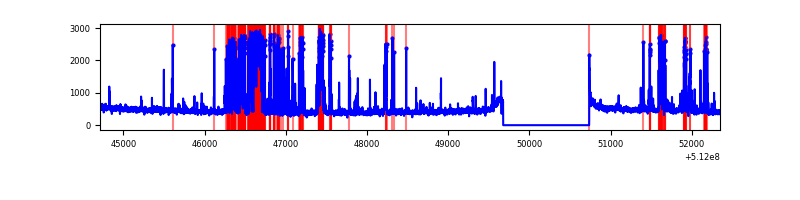 |
| B | 7636 | 6576 | 204 | 204 | 2.67% | 3.10% | 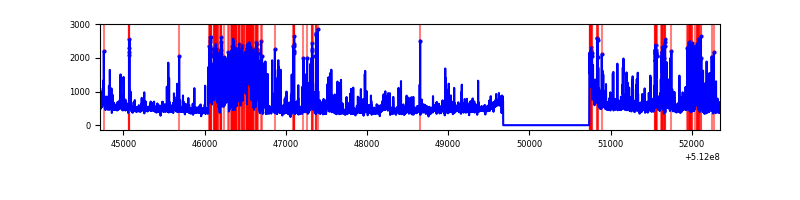 |
| C | 7635 | 6575 | 1252 | 1252 | 16.40% | 19.04% | 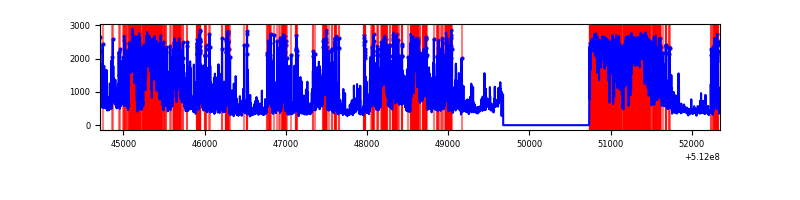 |
| D | 7635 | 6575 | 12 | 12 | 0.16% | 0.18% | 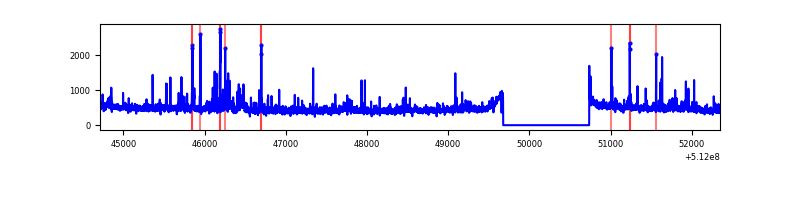 |
Top three noisy pixels from each quadrant. If the there are fewer than three noisy pixels in the level2.evt file, extra rows are filled as -1
| Pixel properties | Quadrant properties | ||||||
|---|---|---|---|---|---|---|---|
| Quadrant | DetID | PixID | Counts | Sigma | Mean | Median | Sigma |
| A | 3 | 62 | 861632 | 4890.62 | 710 | 692 | 176.0 |
| A | 10 | 251 | 460962 | 2614.59 | 710 | 692 | 176.0 |
| A | 8 | 249 | 13534 | 72.95 | 710 | 692 | 176.0 |
| B | 5 | 185 | 904990 | 5937.6 | 708 | 681 | 152.3 |
| B | 4 | 206 | 536372 | 3517.29 | 708 | 681 | 152.3 |
| B | 10 | 247 | 59227 | 384.41 | 708 | 681 | 152.3 |
| C | 15 | 230 | 3327733 | 18935.08 | 639 | 634 | 175.7 |
| C | 13 | 3 | 756779 | 4303.35 | 639 | 634 | 175.7 |
| C | 14 | 96 | 588740 | 3347.01 | 639 | 634 | 175.7 |
| D | 11 | 129 | 127507 | 640.08 | 707 | 676 | 198.1 |
| D | 3 | 12 | 70425 | 352.0 | 707 | 676 | 198.1 |
| D | 8 | 31 | 52590 | 261.99 | 707 | 676 | 198.1 |
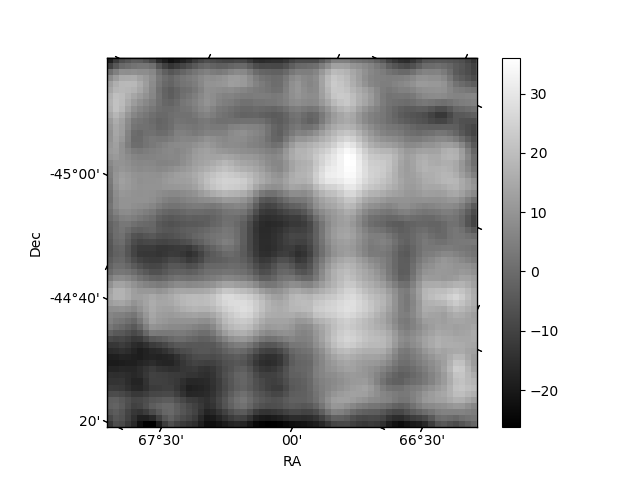
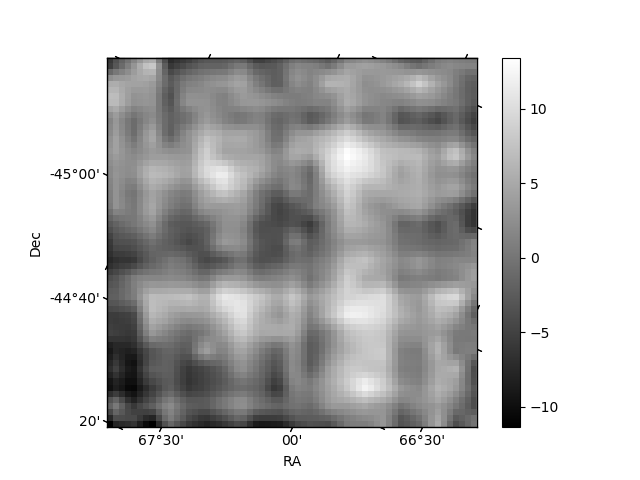
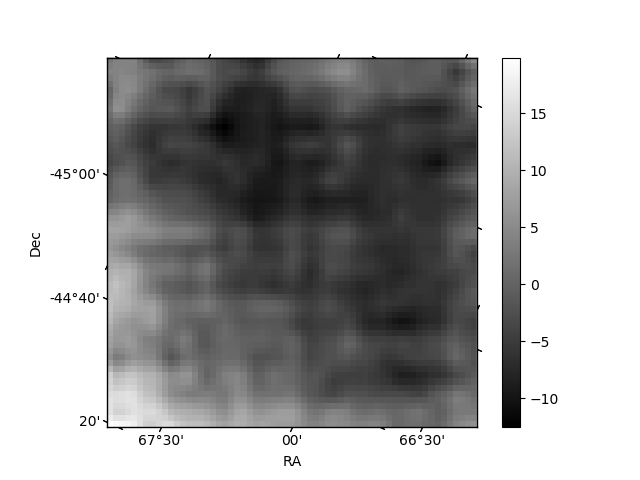
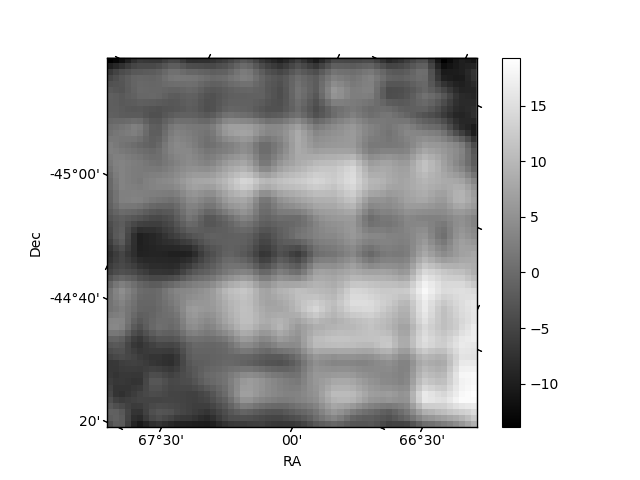
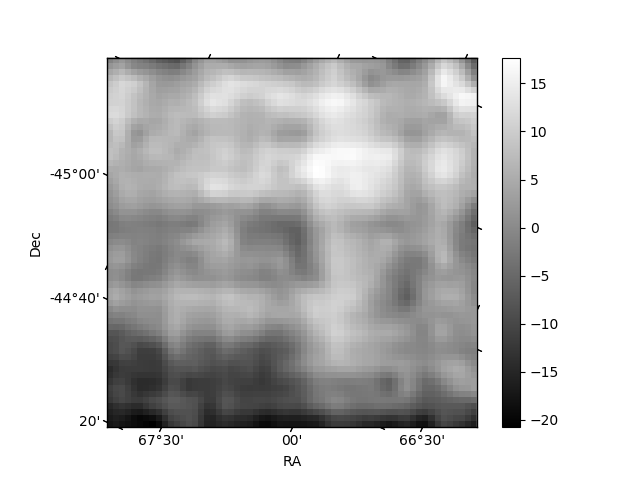
Histogram calculated using DETX and DETY for each event in the final _common_clean file
| Quadrant A | 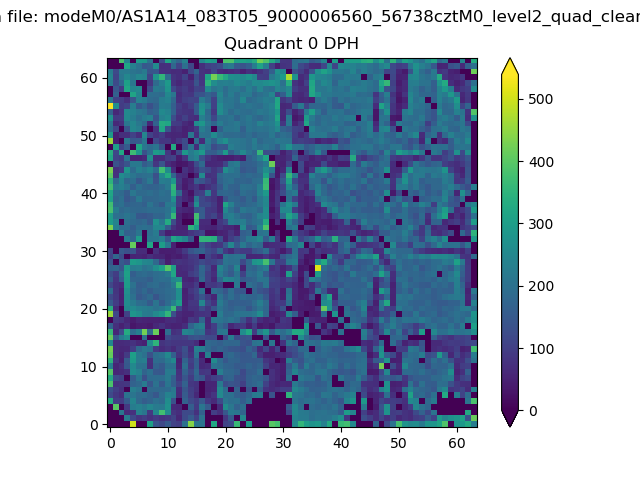 |
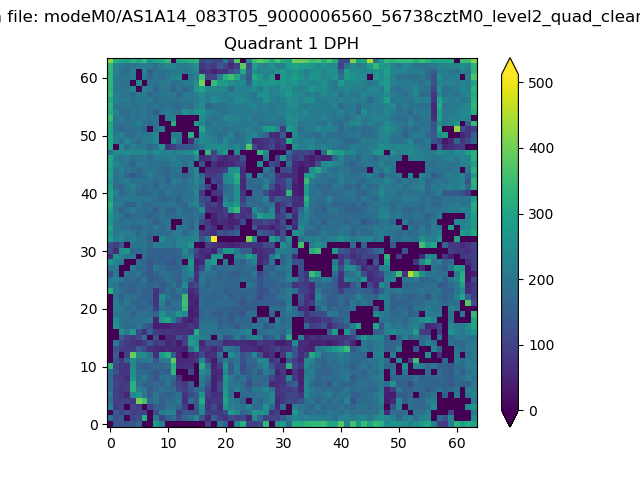 |
Quadrant B |
|---|---|---|---|
| Quadrant D | 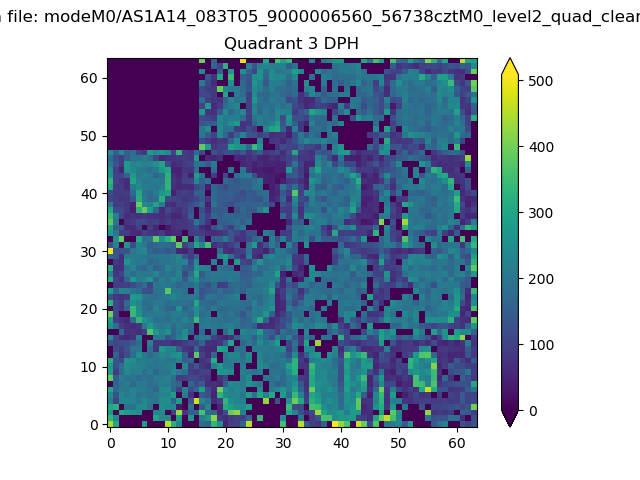 |
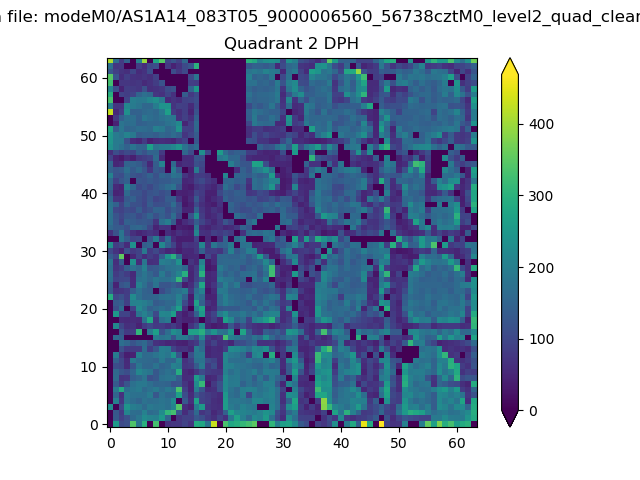 |
Quadrant C |
| Plot type | Count rate plots | Images |
|---|---|---|
| Comparison with Poisson distribution Blue bars denote a histogram of data divided into 1 sec bins. Red curve is a Poisson curve with rate = median count rate of data. |
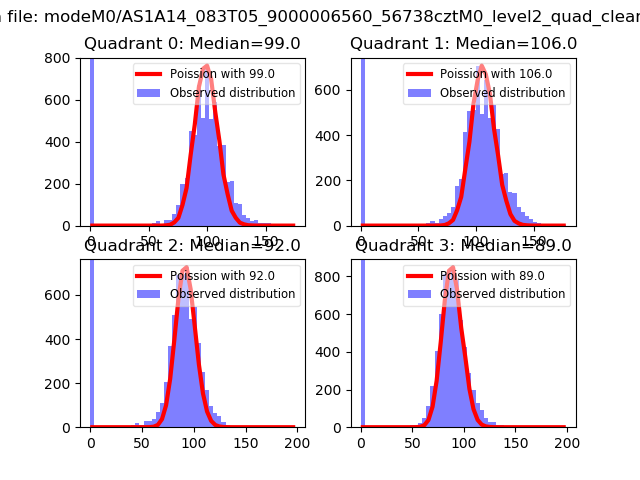 |
 |
| Quadrant-wise count rates Data is divided into 100 sec bins |
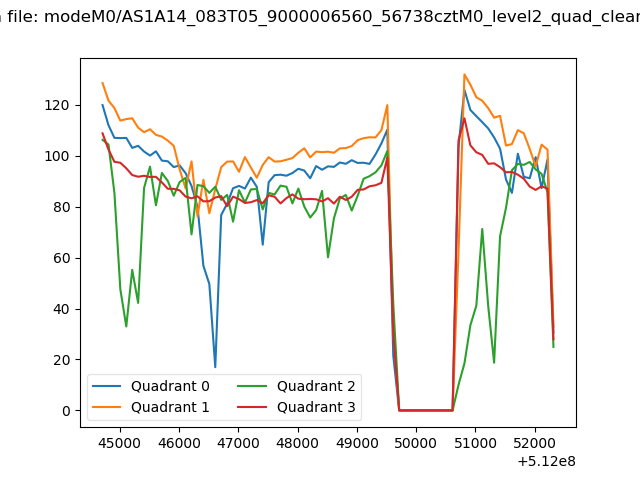 |
|
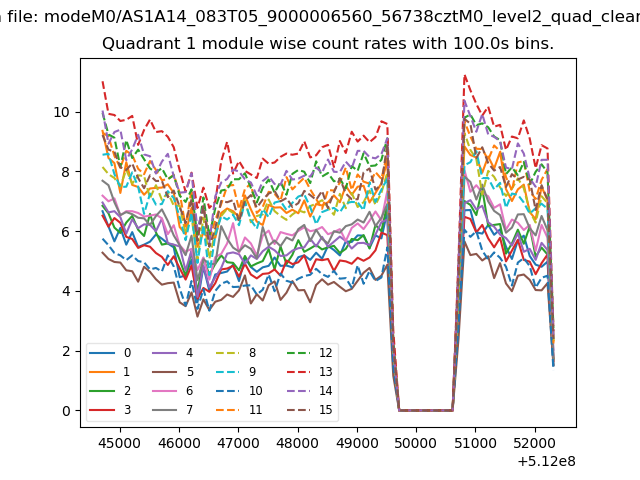
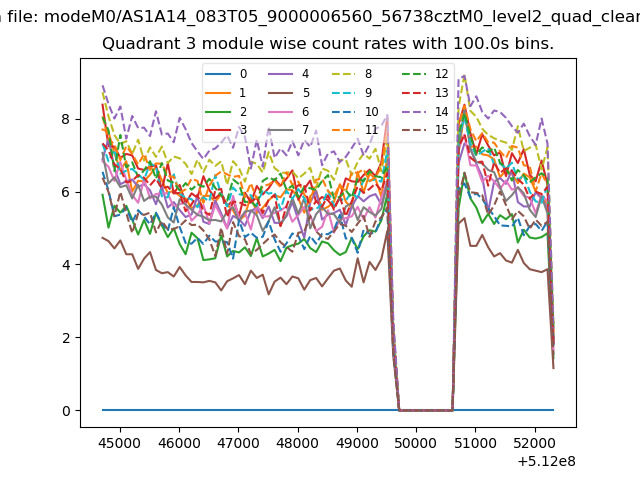
| Module-wise count rates for Quadrant A Data is divided into 100 sec bins |
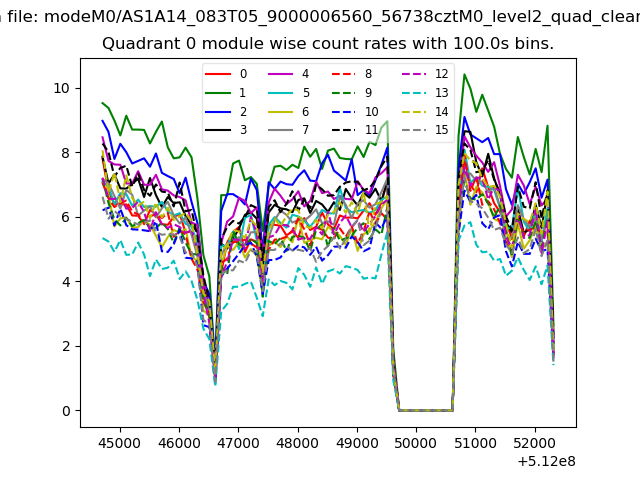 |
 |
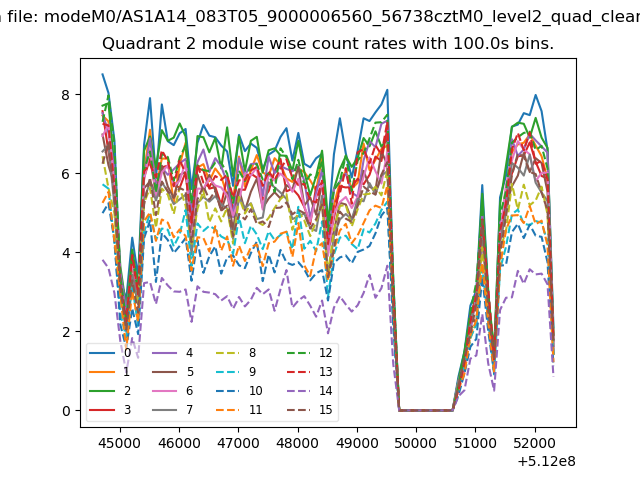
| Module-wise count rates for Quadrant B Data is divided into 100 sec bins |
 |
 |
| Module-wise count rates for Quadrant C Data is divided into 100 sec bins |
 |
 |
| Module-wise count rates for Quadrant D Data is divided into 100 sec bins |
 |
 |
| Parameter | Plot |
|---|---|
| CZT HV Monitor | 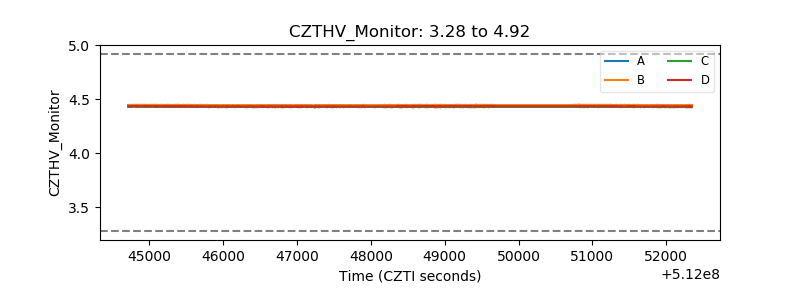 |
| D_VDD | 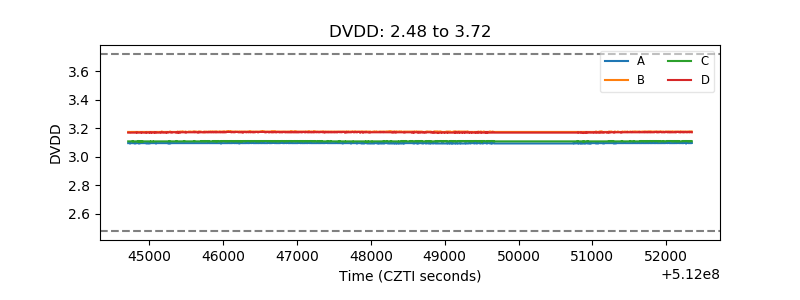 |
| Temperature 1 | 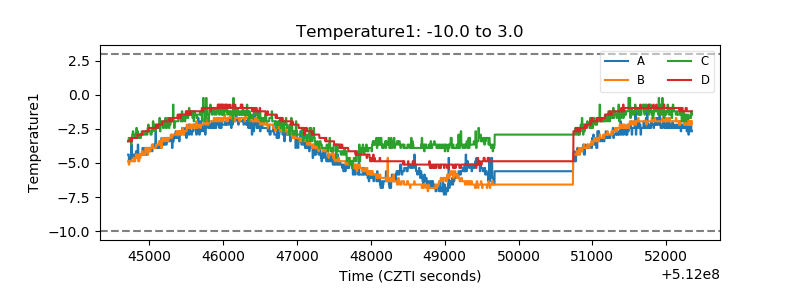 |
| Veto HV Monitor | 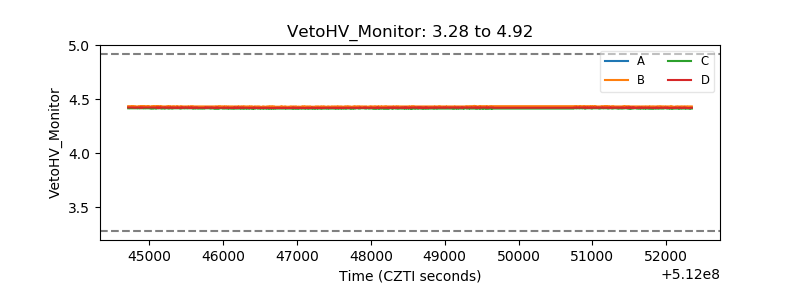 |
| Veto LLD | 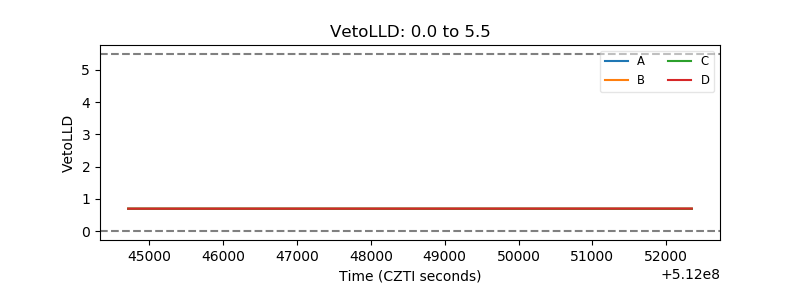 |
| Alpha Counter | 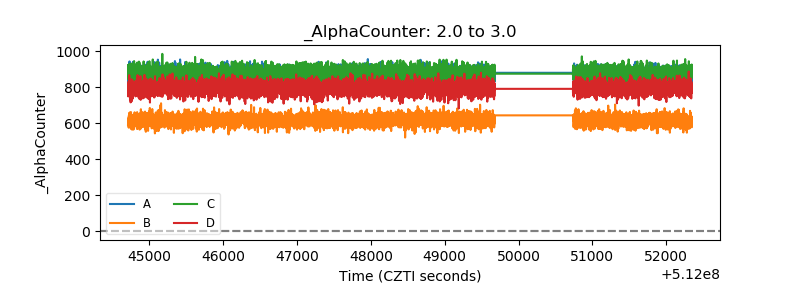 |
| _CPM_Rate | 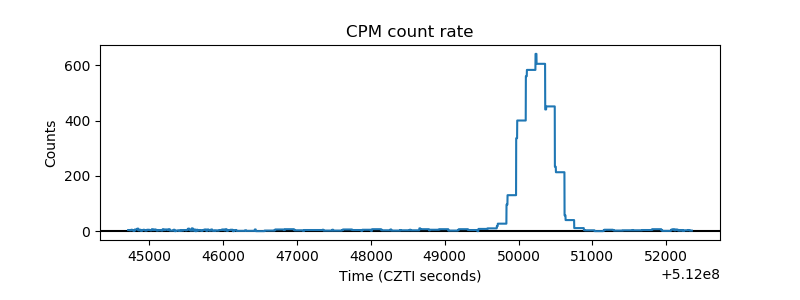 |
| CZT Counter | 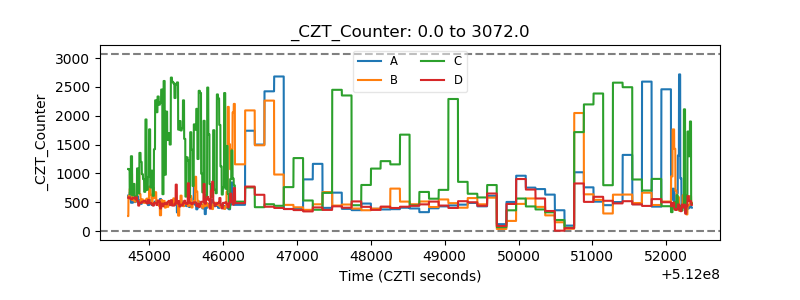 |
| +2.5 Volts monitor |  |
| +5 Volts monitor |  |
| _ROLL_ROT | 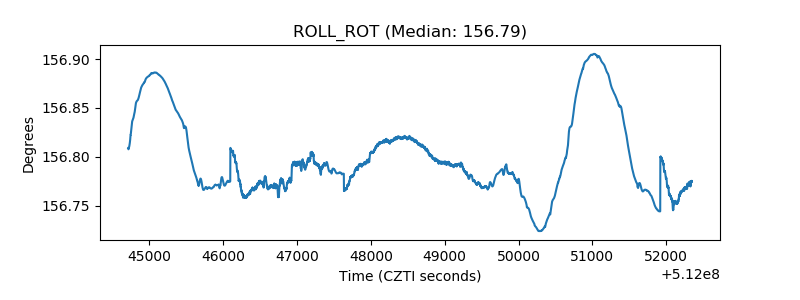 |
| _Roll_DEC | 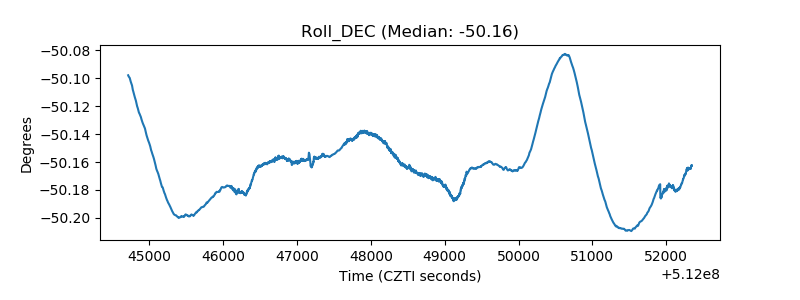 |
| _Roll_RA | 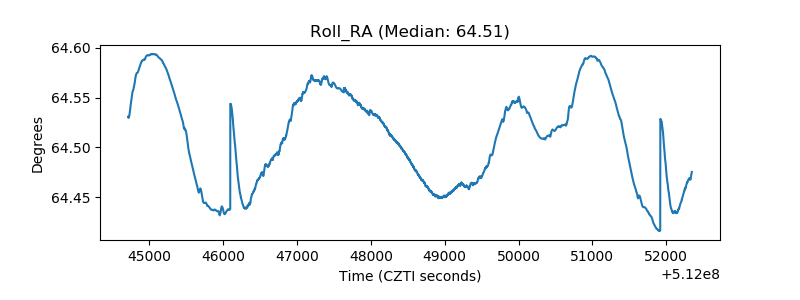 |
| Veto Counter | 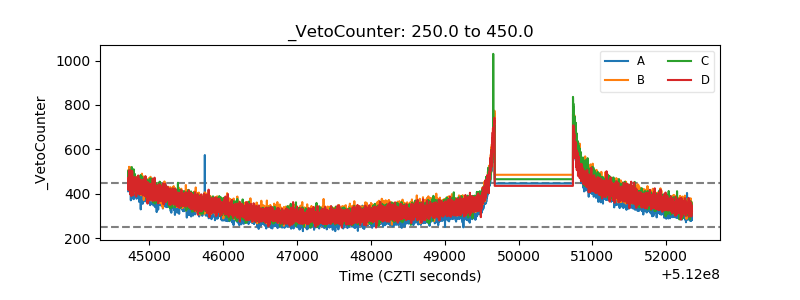 |