| Param | Original file | Final file |
|---|---|---|
| Filename | modeM0/AS1A14_083T05_9000006560_56739cztM0_level2.fits | modeM0/AS1A14_083T05_9000006560_56739cztM0_level2_quad_clean.evt |
| Size (bytes) | 497,652,480 | 93,911,040 |
| Size | 474.6 MB | 89.6 MB |
| Events in quadrant A | 3,695,703 | 615,189 |
| Events in quadrant B | 4,546,513 | 671,694 |
| Events in quadrant C | 6,718,102 | 531,855 |
| Events in quadrant D | 2,959,613 | 574,701 |
| Mode SS | |||
|---|---|---|---|
| Quadrant | BADHDUFLAG | Total packets | Discarded packets |
| A | 0 | 130 | 0 |
| B | 0 | 130 | 0 |
| C | 0 | 130 | 0 |
| D | 0 | 130 | 0 |
| Mode M0 | |||
|---|---|---|---|
| Quadrant | BADHDUFLAG | Total packets | Discarded packets |
| A | 0 | 15640 | 1 |
| B | 0 | 17875 | 1 |
| C | 0 | 24587 | 1 |
| D | 0 | 13440 | 1 |
| Mode M9 | |||
|---|---|---|---|
| Quadrant | BADHDUFLAG | Total packets | Discarded packets |
| A | 0 | 12 | 0 |
| B | 0 | 12 | 0 |
| C | 0 | 12 | 0 |
| D | 0 | 12 | 0 |
| Quadrant | Total seconds | Saturated seconds | Saturation percentage |
|---|---|---|---|
| A | 6453 | 314 | 4.865954% |
| B | 6453 | 322 | 4.989927% |
| C | 6453 | 1008 | 15.620642% |
| D | 6454 | 24 | 0.371862% |
Noise dominated data is calculated using 1-second bins in cleaned event files. If a bin has >2000 counts, and if more than 50% of those come from <1% of pixels, then it is considered to be noise-dominated and hence unusable.
| Quadrant | # 1 sec bins | Bins with >0 counts | Bins with >2000 counts | High rate bins dominated by noise | Noise dominated (total time) | Noise dominated (detector-on time) | Marked lightcurve |
|---|---|---|---|---|---|---|---|
| A | 7607 | 6452 | 266 | 266 | 3.50% | 4.12% | 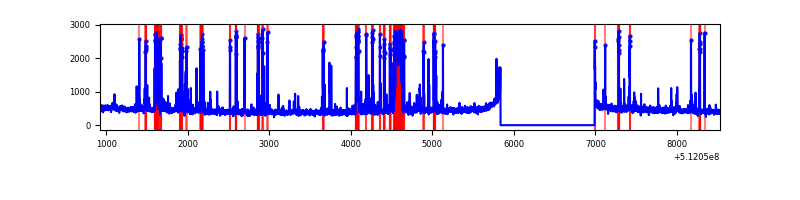 |
| B | 7607 | 6452 | 217 | 217 | 2.85% | 3.36% | 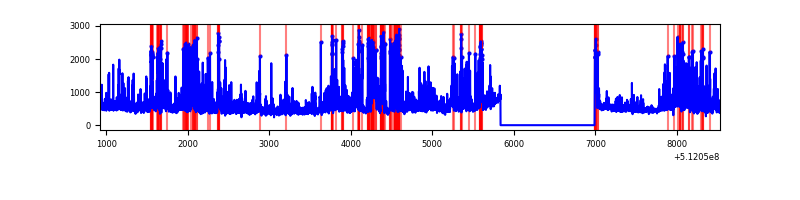 |
| C | 7607 | 6452 | 1026 | 1026 | 13.49% | 15.90% | 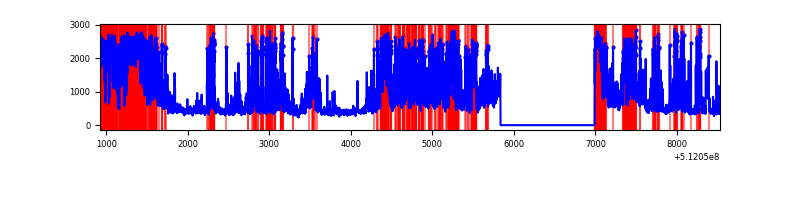 |
| D | 7608 | 6453 | 8 | 8 | 0.11% | 0.12% | 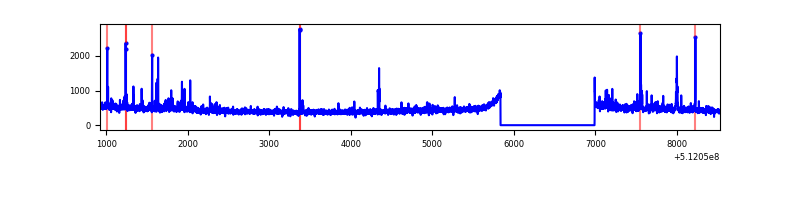 |
Top three noisy pixels from each quadrant. If the there are fewer than three noisy pixels in the level2.evt file, extra rows are filled as -1
| Pixel properties | Quadrant properties | ||||||
|---|---|---|---|---|---|---|---|
| Quadrant | DetID | PixID | Counts | Sigma | Mean | Median | Sigma |
| A | 3 | 62 | 846498 | 4862.04 | 697 | 677 | 174.0 |
| A | 10 | 251 | 114882 | 656.49 | 697 | 677 | 174.0 |
| A | 4 | 3 | 11766 | 63.74 | 697 | 677 | 174.0 |
| B | 5 | 185 | 1355252 | 9224.48 | 691 | 667 | 146.8 |
| B | 4 | 206 | 171073 | 1160.43 | 691 | 667 | 146.8 |
| B | 8 | 128 | 79707 | 538.25 | 691 | 667 | 146.8 |
| C | 15 | 230 | 2990561 | 17012.68 | 637 | 629 | 175.7 |
| C | 6 | 223 | 526236 | 2990.7 | 637 | 629 | 175.7 |
| C | 13 | 3 | 228545 | 1296.84 | 637 | 629 | 175.7 |
| D | 2 | 236 | 52383 | 269.5 | 684 | 654 | 191.9 |
| D | 8 | 31 | 52163 | 268.35 | 684 | 654 | 191.9 |
| D | 5 | 173 | 50987 | 262.23 | 684 | 654 | 191.9 |
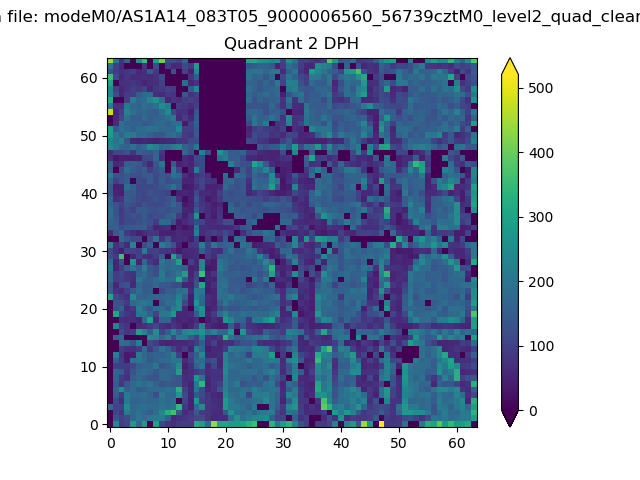
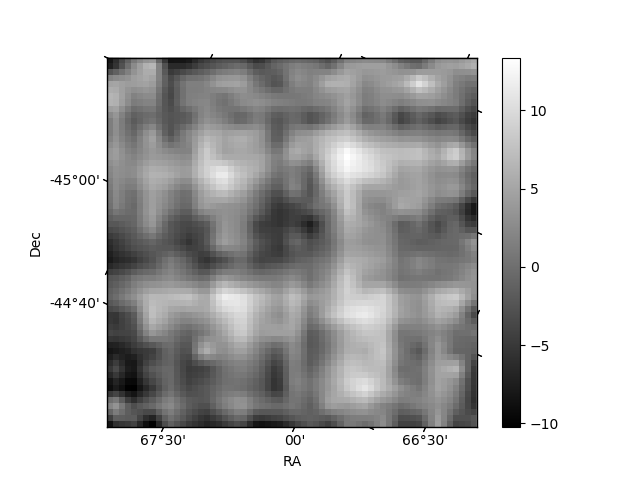
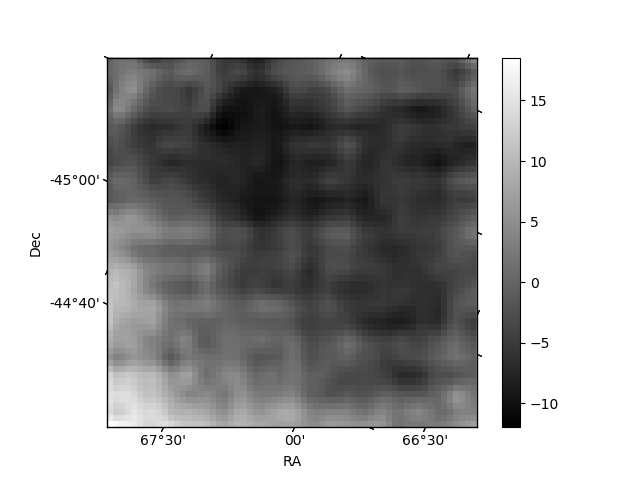
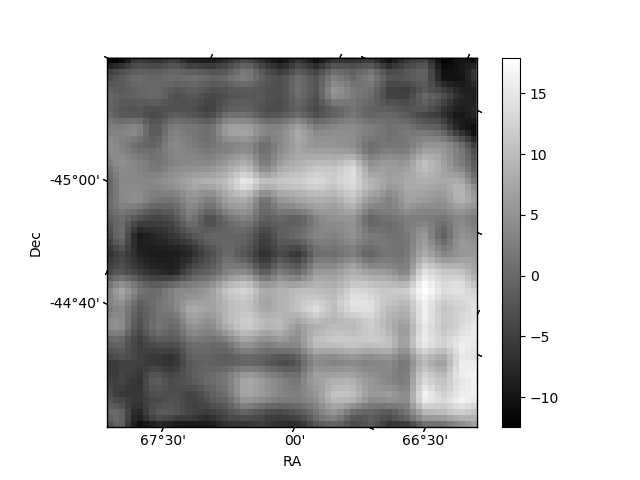
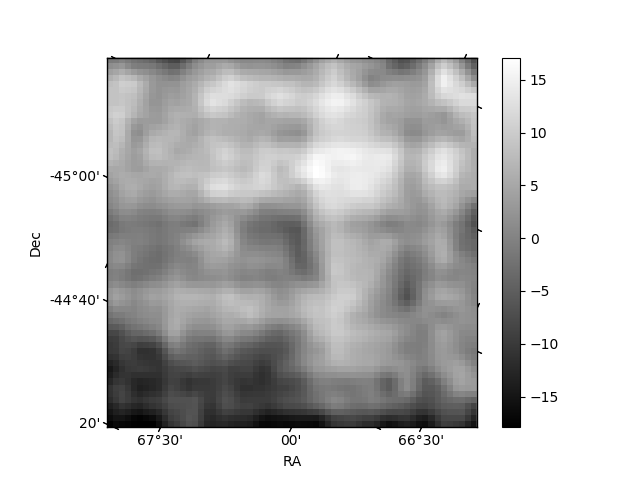
Histogram calculated using DETX and DETY for each event in the final _common_clean file
| Quadrant A | 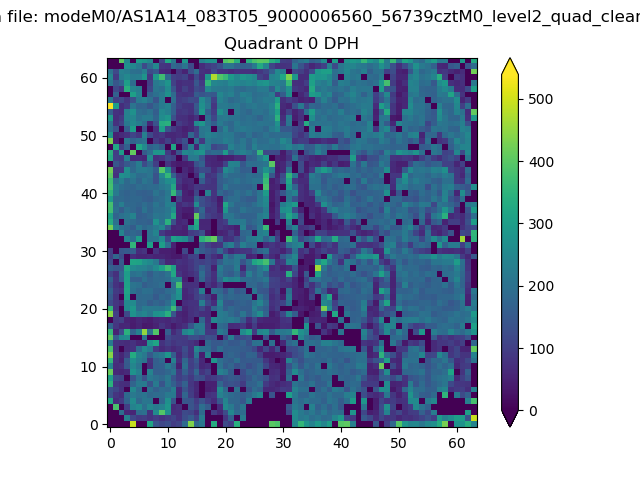 |
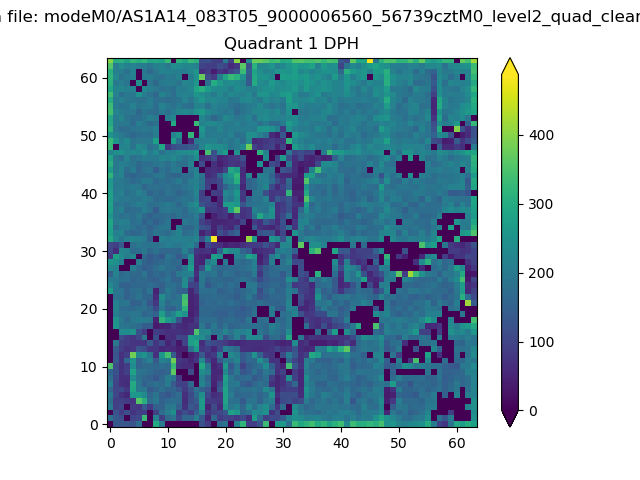 |
Quadrant B |
|---|---|---|---|
| Quadrant D | 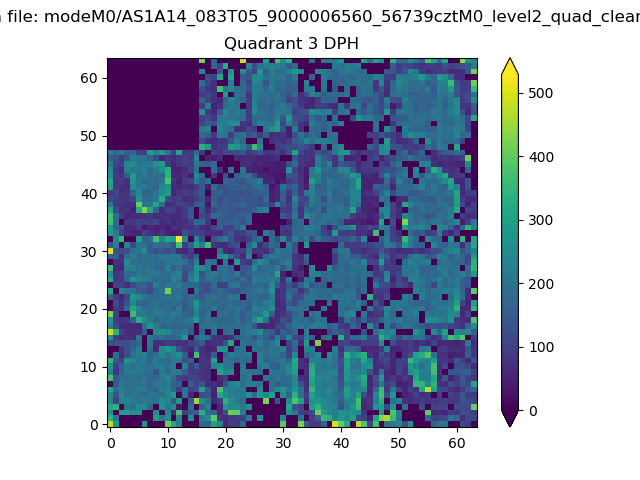 |
 |
Quadrant C |
| Plot type | Count rate plots | Images |
|---|---|---|
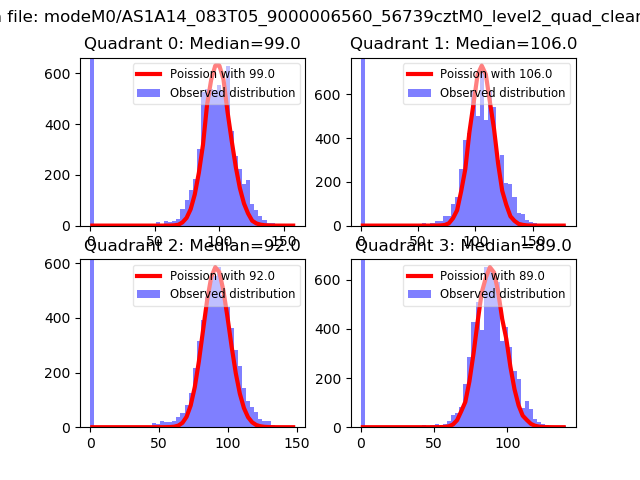
| Comparison with Poisson distribution Blue bars denote a histogram of data divided into 1 sec bins. Red curve is a Poisson curve with rate = median count rate of data. |
 |
 |
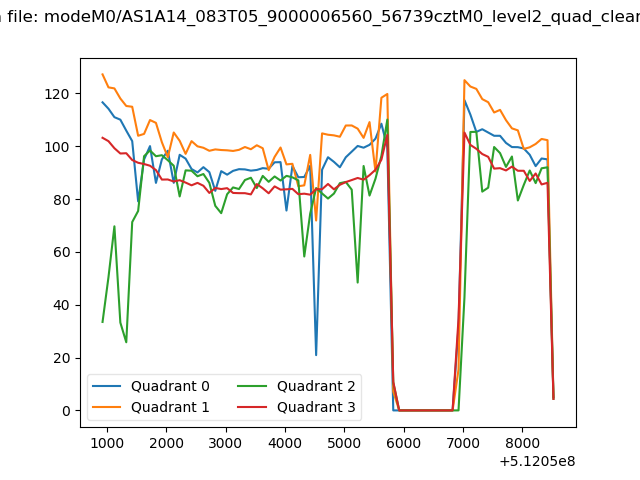
| Quadrant-wise count rates Data is divided into 100 sec bins |
 |
|
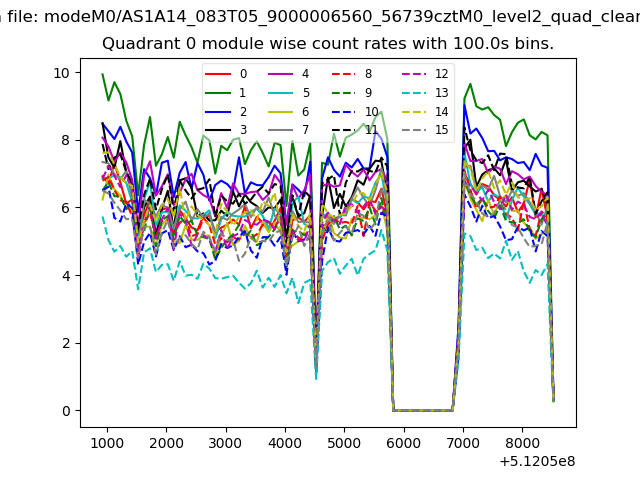
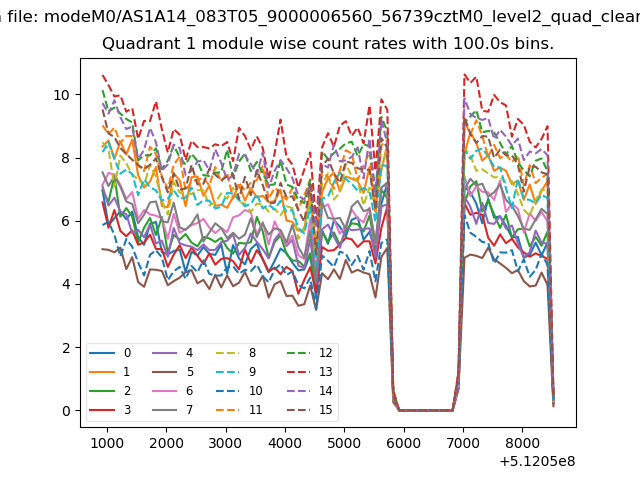
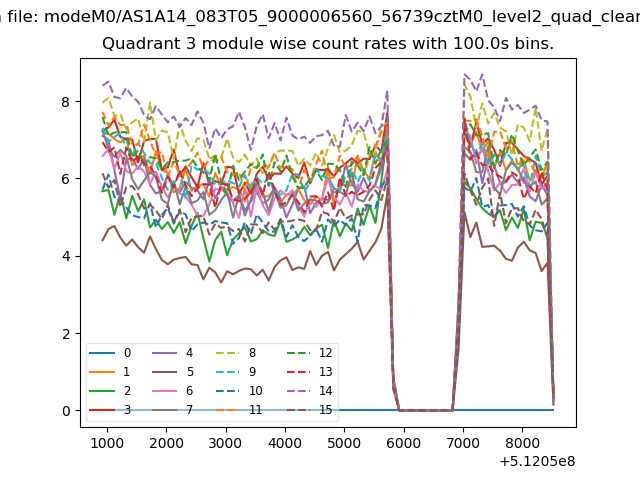
| Module-wise count rates for Quadrant A Data is divided into 100 sec bins |
 |
 |
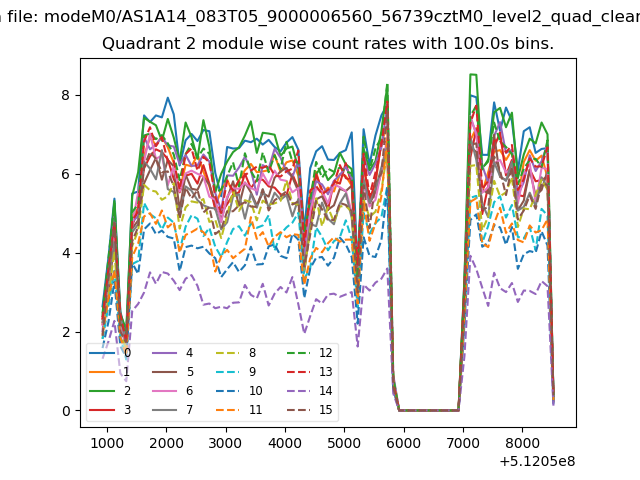
| Module-wise count rates for Quadrant B Data is divided into 100 sec bins |
 |
 |
| Module-wise count rates for Quadrant C Data is divided into 100 sec bins |
 |
 |
| Module-wise count rates for Quadrant D Data is divided into 100 sec bins |
 |
 |
| Parameter | Plot |
|---|---|
| CZT HV Monitor | 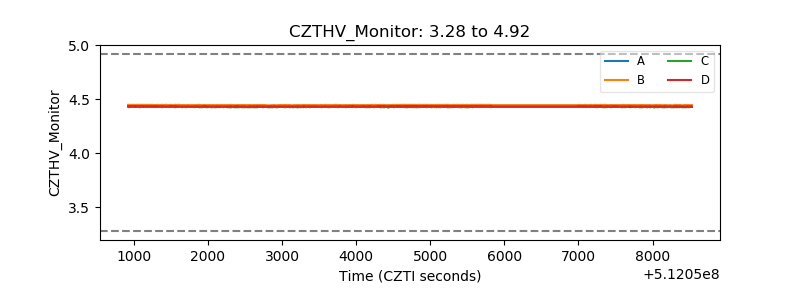 |
| D_VDD | 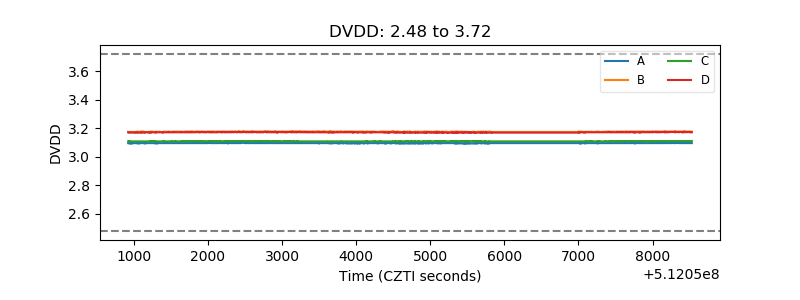 |
| Temperature 1 | 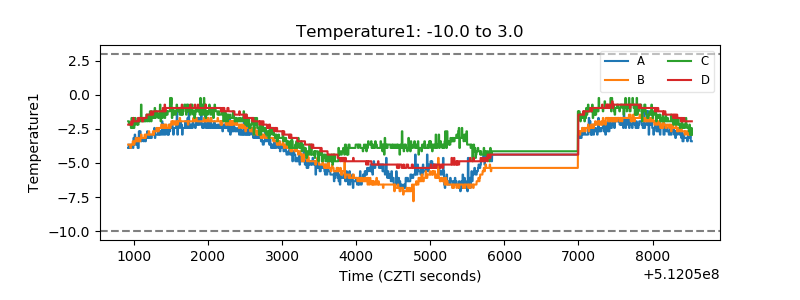 |
| Veto HV Monitor | 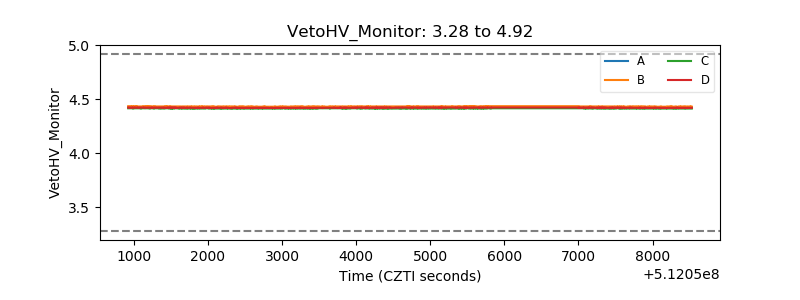 |
| Veto LLD | 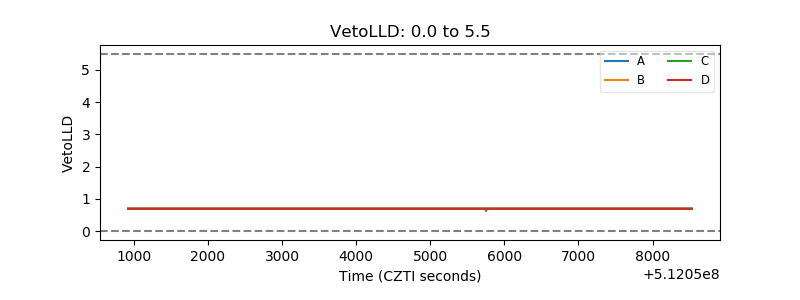 |
| Alpha Counter | 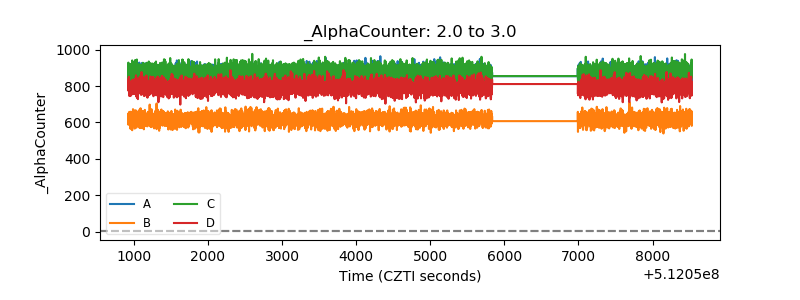 |
| _CPM_Rate | 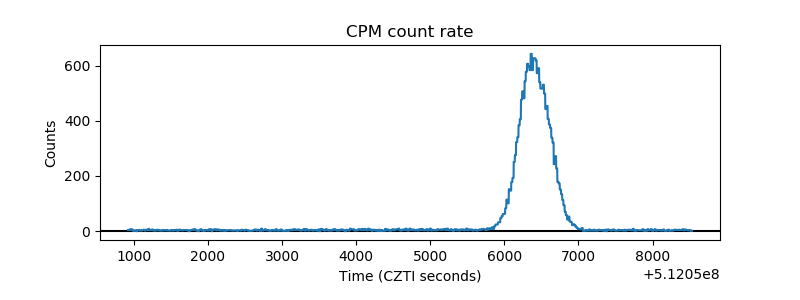 |
| CZT Counter | 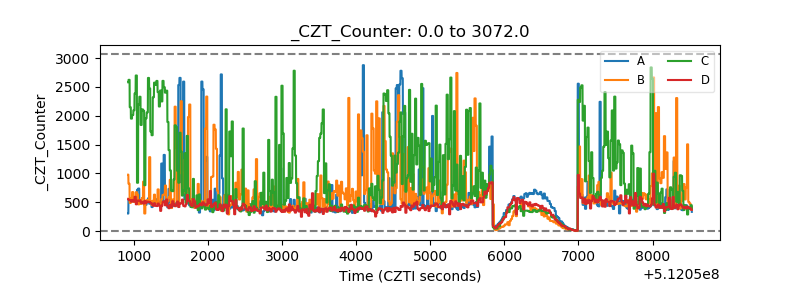 |
| +2.5 Volts monitor |  |
| +5 Volts monitor |  |
| _ROLL_ROT | 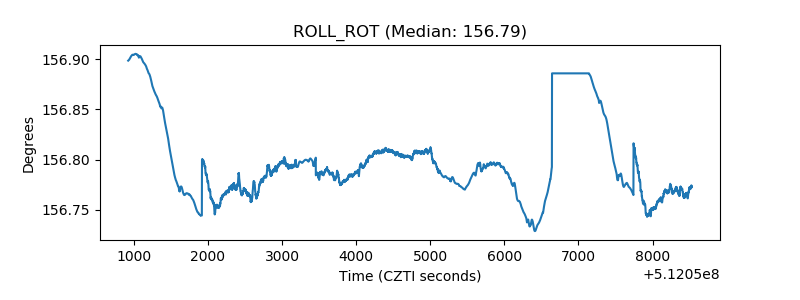 |
| _Roll_DEC | 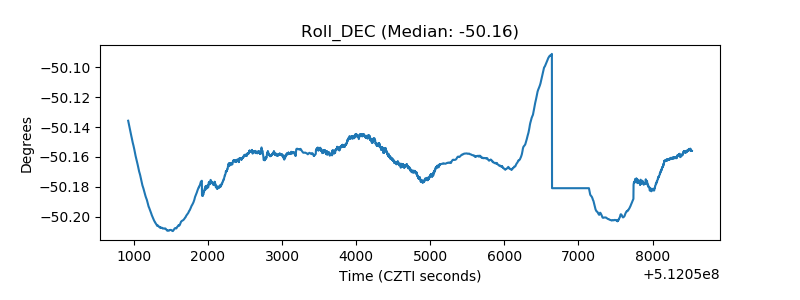 |
| _Roll_RA | 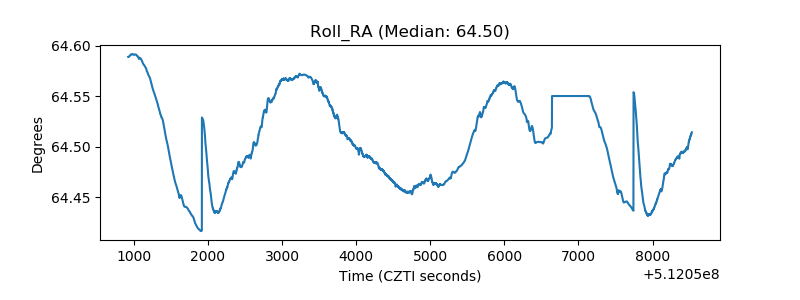 |
| Veto Counter | 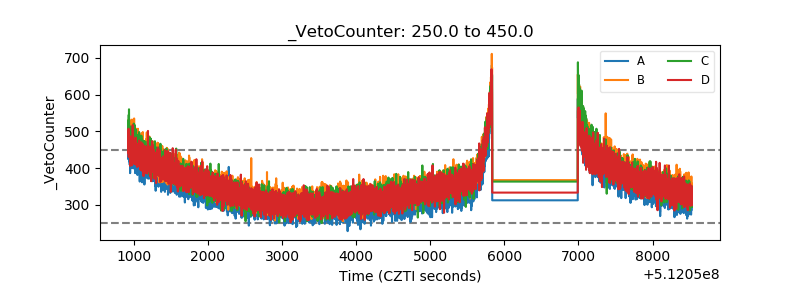 |