| Param | Original file | Final file |
|---|---|---|
| Filename | modeM0/AS1A14_083T05_9000006560_56740cztM0_level2.fits | modeM0/AS1A14_083T05_9000006560_56740cztM0_level2_quad_clean.evt |
| Size (bytes) | 439,859,520 | 92,646,720 |
| Size | 419.5 MB | 88.4 MB |
| Events in quadrant A | 3,051,153 | 619,401 |
| Events in quadrant B | 4,012,171 | 657,574 |
| Events in quadrant C | 5,791,012 | 523,271 |
| Events in quadrant D | 2,931,706 | 560,068 |
| Mode SS | |||
|---|---|---|---|
| Quadrant | BADHDUFLAG | Total packets | Discarded packets |
| A | 0 | 130 | 0 |
| B | 0 | 130 | 0 |
| C | 0 | 130 | 0 |
| D | 0 | 130 | 0 |
| Mode M0 | |||
|---|---|---|---|
| Quadrant | BADHDUFLAG | Total packets | Discarded packets |
| A | 0 | 13827 | 1 |
| B | 0 | 16319 | 1 |
| C | 0 | 21895 | 7 |
| D | 0 | 13331 | 1 |
| Mode M9 | |||
|---|---|---|---|
| Quadrant | BADHDUFLAG | Total packets | Discarded packets |
| A | 0 | 11 | 0 |
| B | 0 | 11 | 0 |
| C | 0 | 11 | 0 |
| D | 0 | 11 | 0 |
| Quadrant | Total seconds | Saturated seconds | Saturation percentage |
|---|---|---|---|
| A | 6376 | 124 | 1.944793% |
| B | 6376 | 289 | 4.532622% |
| C | 6376 | 900 | 14.115433% |
| D | 6376 | 31 | 0.486198% |
Noise dominated data is calculated using 1-second bins in cleaned event files. If a bin has >2000 counts, and if more than 50% of those come from <1% of pixels, then it is considered to be noise-dominated and hence unusable.
| Quadrant | # 1 sec bins | Bins with >0 counts | Bins with >2000 counts | High rate bins dominated by noise | Noise dominated (total time) | Noise dominated (detector-on time) | Marked lightcurve |
|---|---|---|---|---|---|---|---|
| A | 7475 | 6376 | 53 | 53 | 0.71% | 0.83% | 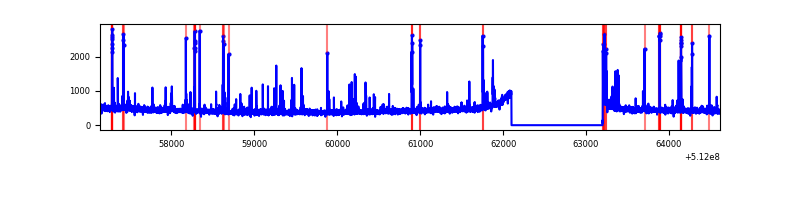 |
| B | 7476 | 6377 | 156 | 156 | 2.09% | 2.45% | 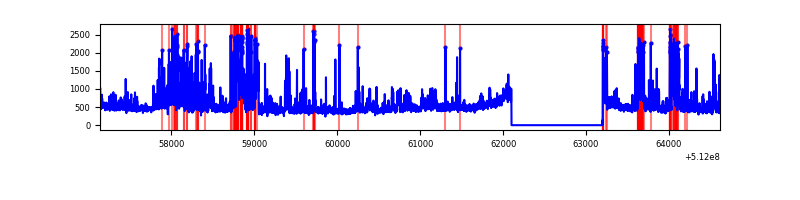 |
| C | 7476 | 6377 | 853 | 853 | 11.41% | 13.38% | 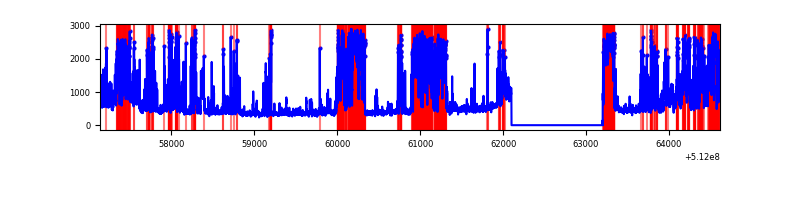 |
| D | 7476 | 6377 | 4 | 4 | 0.05% | 0.06% | 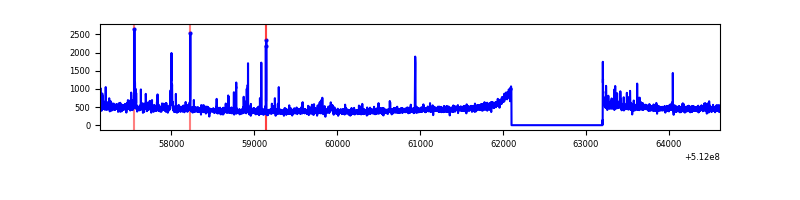 |
Top three noisy pixels from each quadrant. If the there are fewer than three noisy pixels in the level2.evt file, extra rows are filled as -1
| Pixel properties | Quadrant properties | ||||||
|---|---|---|---|---|---|---|---|
| Quadrant | DetID | PixID | Counts | Sigma | Mean | Median | Sigma |
| A | 10 | 251 | 163420 | 947.21 | 697 | 680 | 171.8 |
| A | 3 | 62 | 147464 | 854.34 | 697 | 680 | 171.8 |
| A | 8 | 249 | 13057 | 72.04 | 697 | 680 | 171.8 |
| B | 4 | 206 | 578409 | 3899.99 | 685 | 658 | 148.1 |
| B | 5 | 185 | 408925 | 2755.92 | 685 | 658 | 148.1 |
| B | 0 | 213 | 165785 | 1114.66 | 685 | 658 | 148.1 |
| C | 15 | 230 | 1171410 | 6733.76 | 627 | 618 | 173.9 |
| C | 6 | 223 | 1047599 | 6021.66 | 627 | 618 | 173.9 |
| C | 15 | 208 | 535711 | 3077.56 | 627 | 618 | 173.9 |
| D | 5 | 173 | 53224 | 278.56 | 669 | 637 | 188.8 |
| D | 2 | 236 | 50997 | 266.76 | 669 | 637 | 188.8 |
| D | 2 | 252 | 36094 | 187.82 | 669 | 637 | 188.8 |
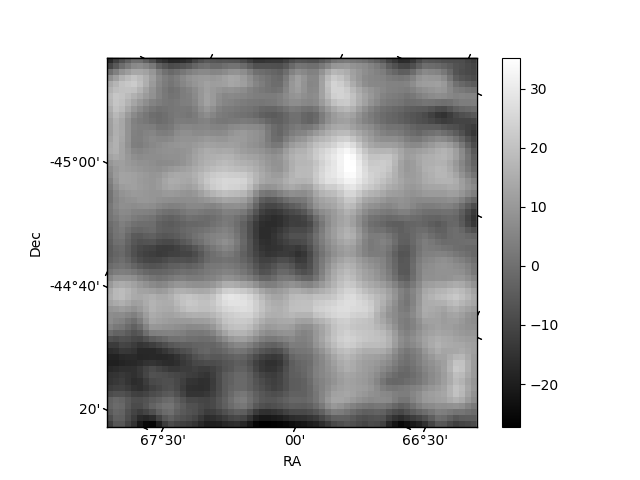
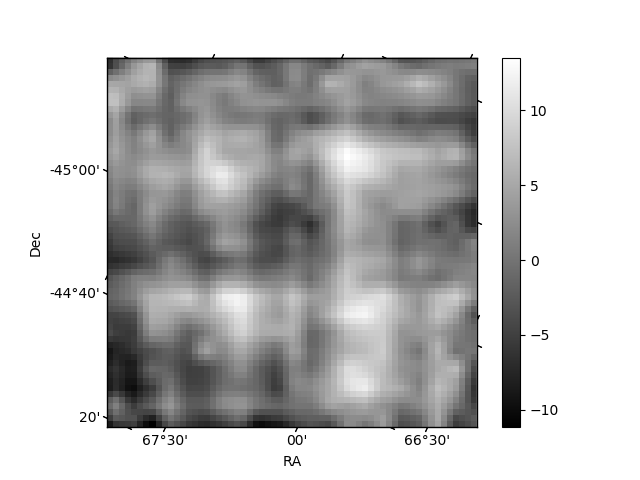
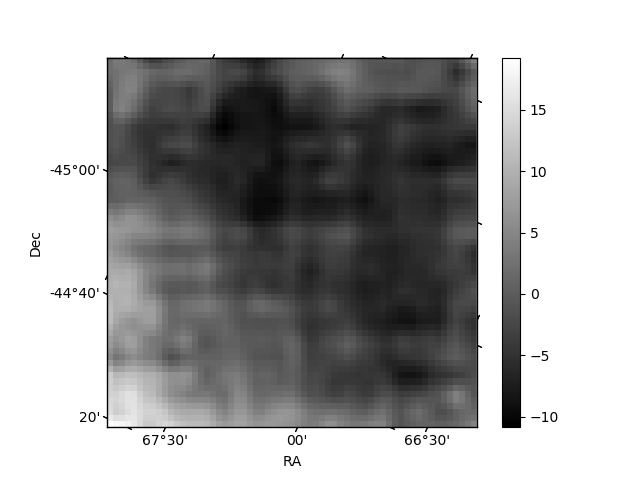
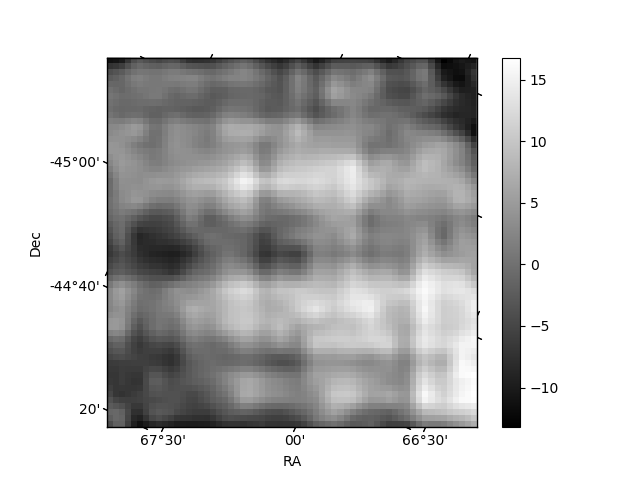
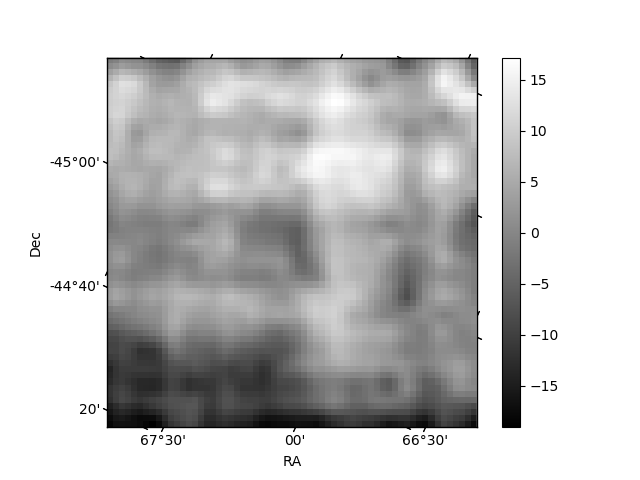
Histogram calculated using DETX and DETY for each event in the final _common_clean file
| Quadrant A | 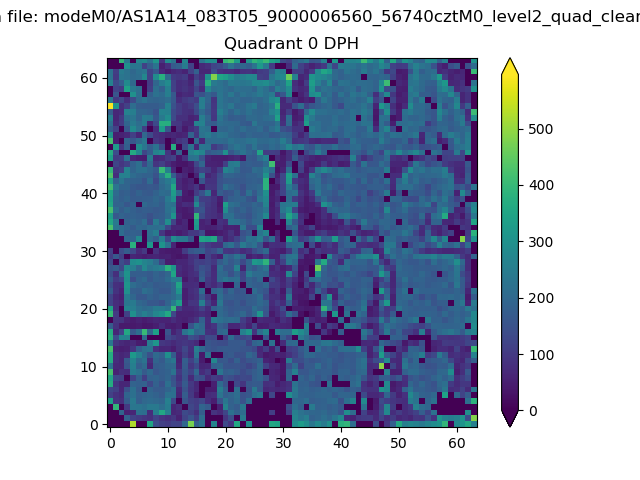 |
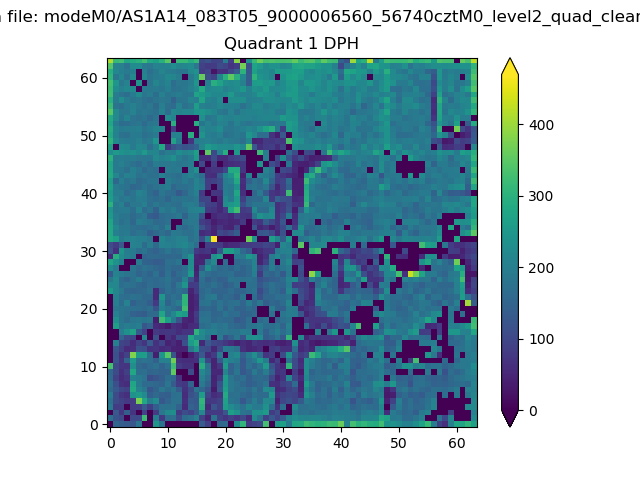 |
Quadrant B |
|---|---|---|---|
| Quadrant D | 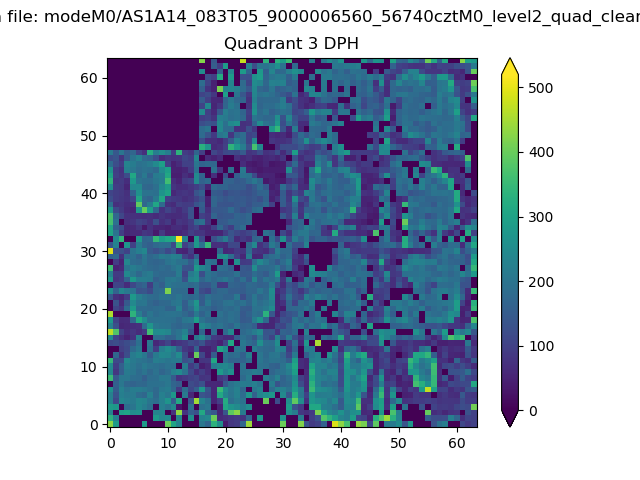 |
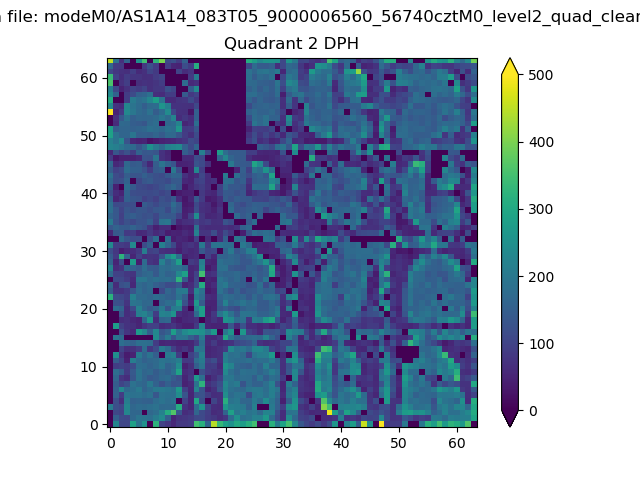 |
Quadrant C |
| Plot type | Count rate plots | Images |
|---|---|---|
| Comparison with Poisson distribution Blue bars denote a histogram of data divided into 1 sec bins. Red curve is a Poisson curve with rate = median count rate of data. |
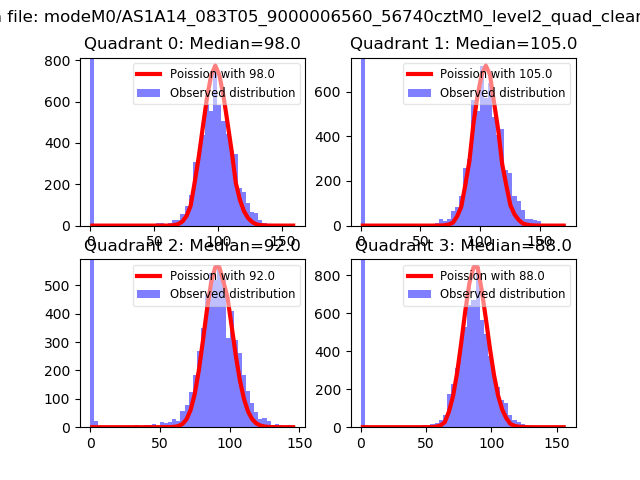 |
 |
| Quadrant-wise count rates Data is divided into 100 sec bins |
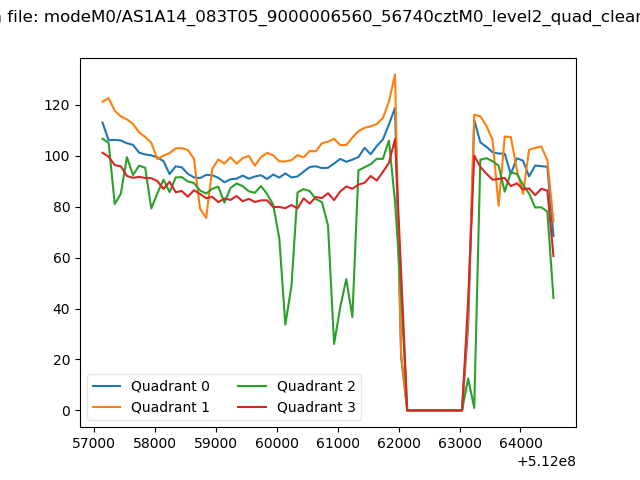 |
|
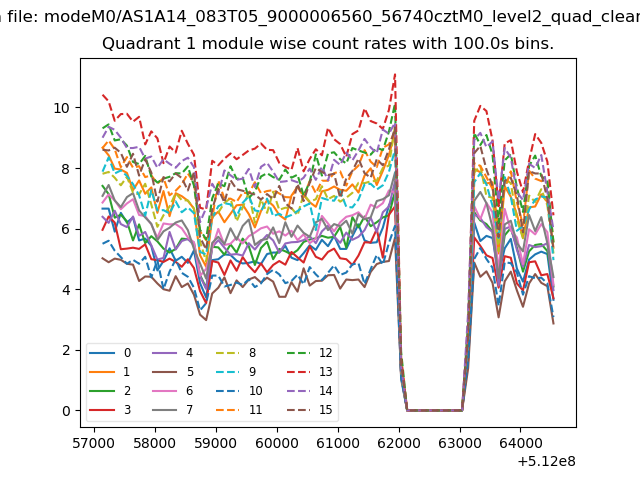
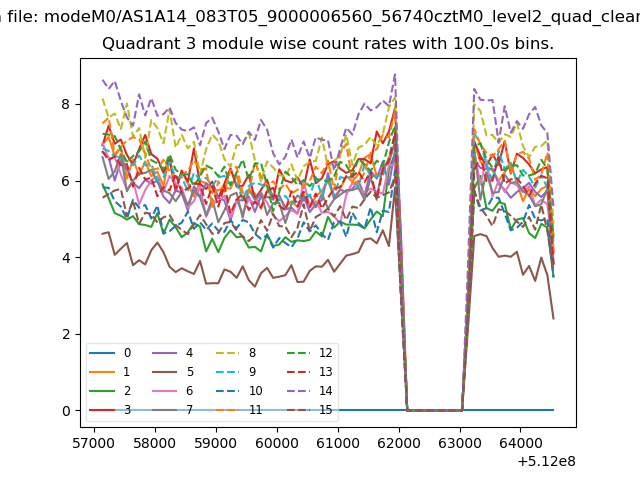
| Module-wise count rates for Quadrant A Data is divided into 100 sec bins |
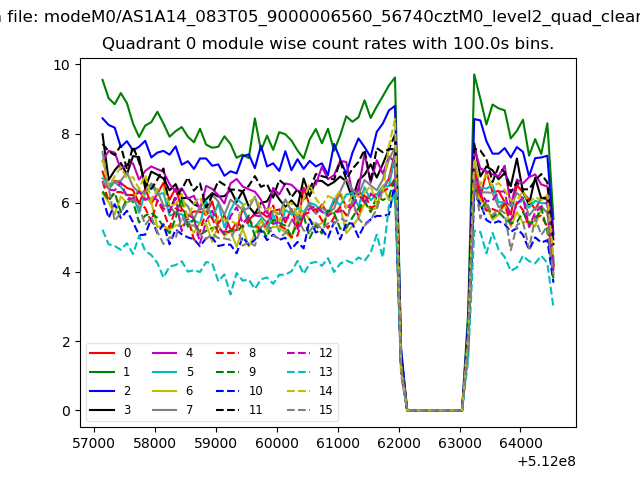 |
 |
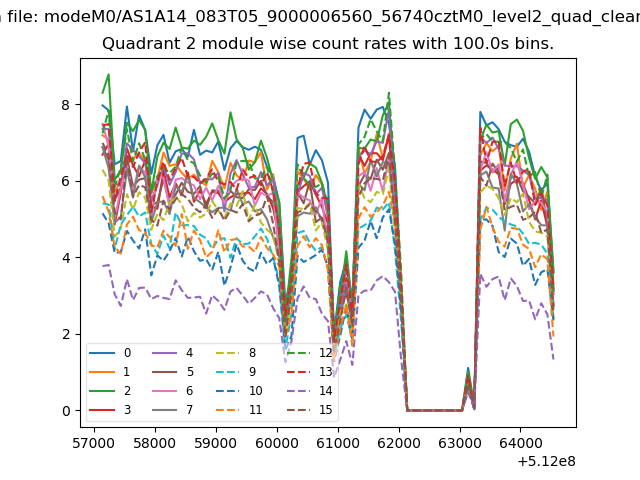
| Module-wise count rates for Quadrant B Data is divided into 100 sec bins |
 |
 |
| Module-wise count rates for Quadrant C Data is divided into 100 sec bins |
 |
 |
| Module-wise count rates for Quadrant D Data is divided into 100 sec bins |
 |
 |
| Parameter | Plot |
|---|---|
| CZT HV Monitor | 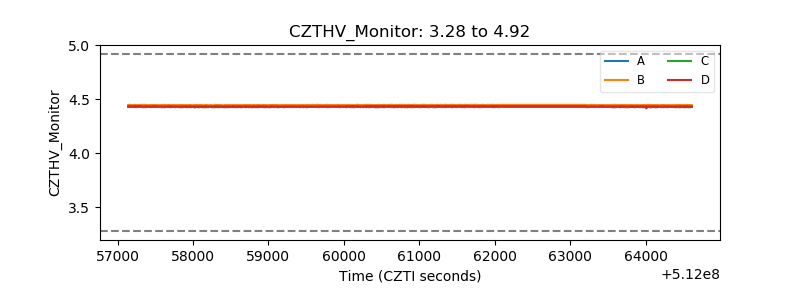 |
| D_VDD | 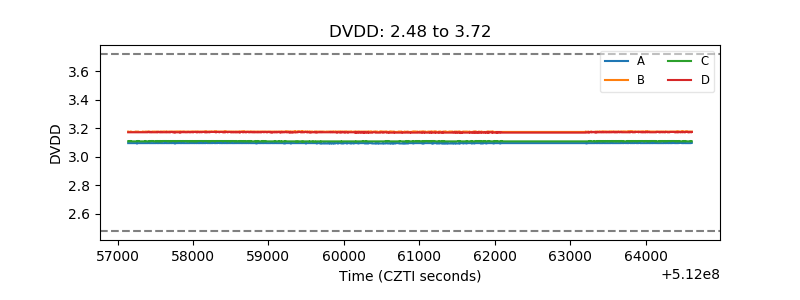 |
| Temperature 1 | 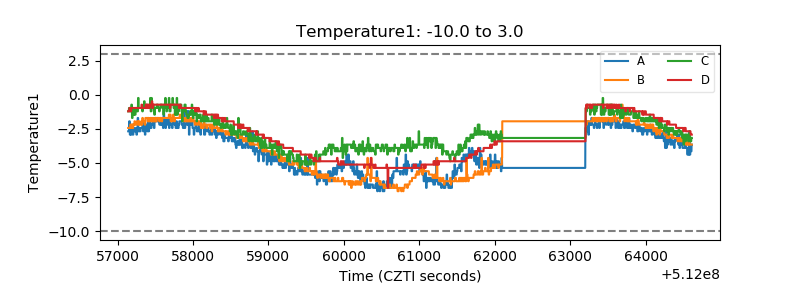 |
| Veto HV Monitor | 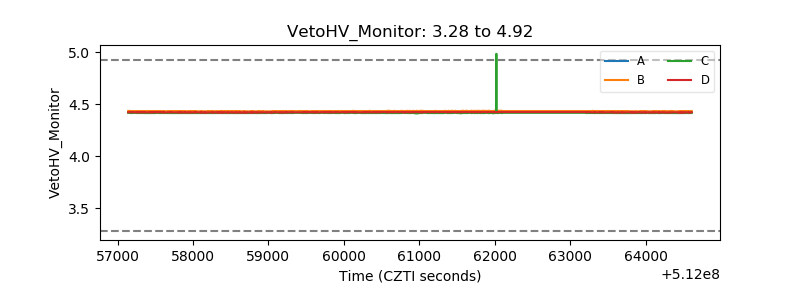 |
| Veto LLD | 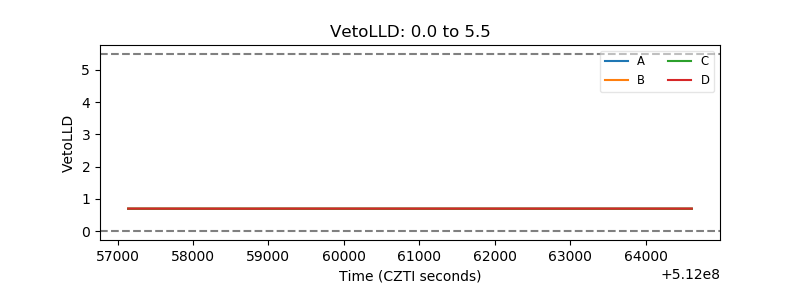 |
| Alpha Counter | 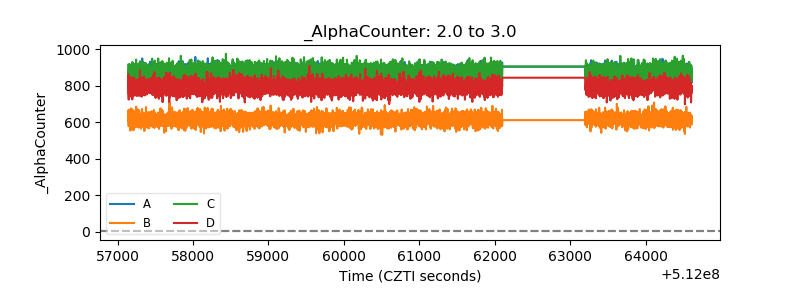 |
| _CPM_Rate | 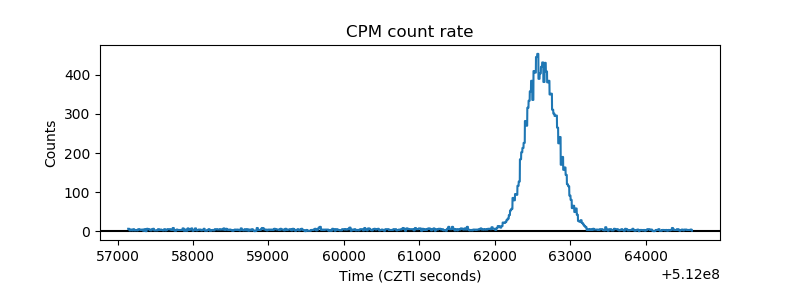 |
| CZT Counter | 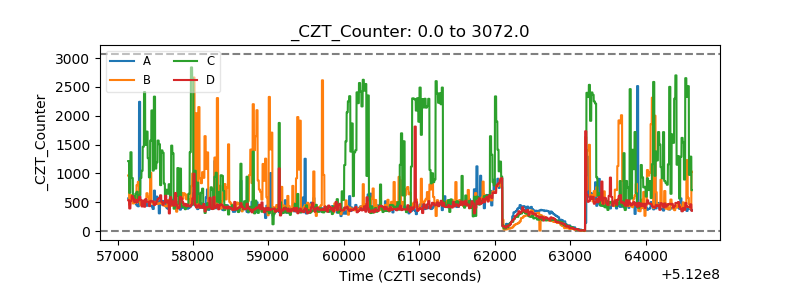 |
| +2.5 Volts monitor |  |
| +5 Volts monitor |  |
| _ROLL_ROT | 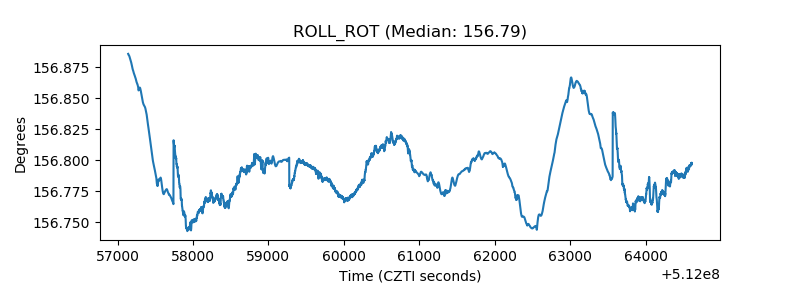 |
| _Roll_DEC | 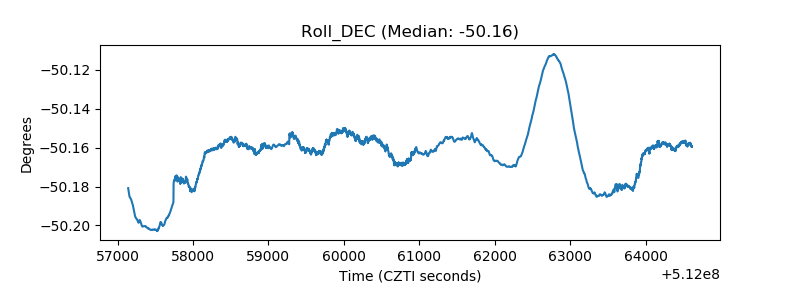 |
| _Roll_RA | 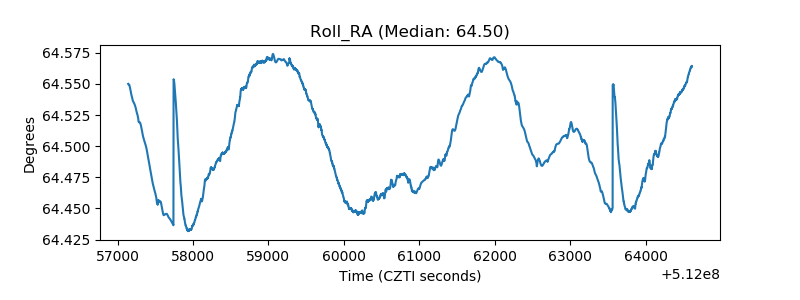 |
| Veto Counter | 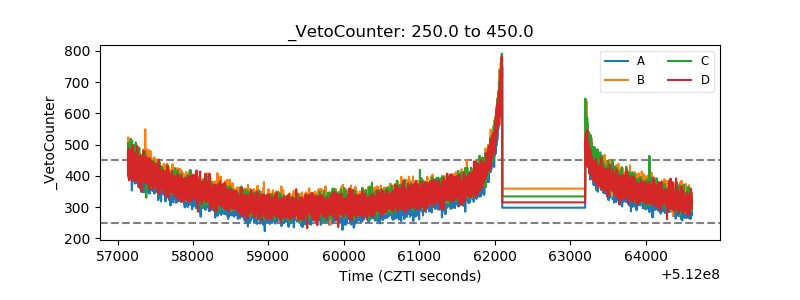 |