| Param | Original file | Final file |
|---|---|---|
| Filename | modeM0/AS1A14_083T05_9000006560_56741cztM0_level2.fits | modeM0/AS1A14_083T05_9000006560_56741cztM0_level2_quad_clean.evt |
| Size (bytes) | 438,618,240 | 89,850,240 |
| Size | 418.3 MB | 85.7 MB |
| Events in quadrant A | 3,431,761 | 598,939 |
| Events in quadrant B | 4,026,489 | 620,523 |
| Events in quadrant C | 5,331,573 | 520,880 |
| Events in quadrant D | 2,956,099 | 540,419 |
| Mode SS | |||
|---|---|---|---|
| Quadrant | BADHDUFLAG | Total packets | Discarded packets |
| A | 0 | 128 | 0 |
| B | 0 | 128 | 0 |
| C | 0 | 128 | 0 |
| D | 0 | 128 | 0 |
| Mode M0 | |||
|---|---|---|---|
| Quadrant | BADHDUFLAG | Total packets | Discarded packets |
| A | 0 | 15005 | 1 |
| B | 0 | 16538 | 1 |
| C | 0 | 20475 | 1 |
| D | 0 | 13393 | 1 |
| Mode M9 | |||
|---|---|---|---|
| Quadrant | BADHDUFLAG | Total packets | Discarded packets |
| A | 0 | 10 | 0 |
| B | 0 | 10 | 0 |
| C | 0 | 10 | 0 |
| D | 0 | 10 | 0 |
| Quadrant | Total seconds | Saturated seconds | Saturation percentage |
|---|---|---|---|
| A | 6300 | 149 | 2.365079% |
| B | 6301 | 427 | 6.776702% |
| C | 6301 | 663 | 10.522139% |
| D | 6301 | 32 | 0.507856% |
Noise dominated data is calculated using 1-second bins in cleaned event files. If a bin has >2000 counts, and if more than 50% of those come from <1% of pixels, then it is considered to be noise-dominated and hence unusable.
| Quadrant | # 1 sec bins | Bins with >0 counts | Bins with >2000 counts | High rate bins dominated by noise | Noise dominated (total time) | Noise dominated (detector-on time) | Marked lightcurve |
|---|---|---|---|---|---|---|---|
| A | 7305 | 6301 | 110 | 110 | 1.51% | 1.75% | 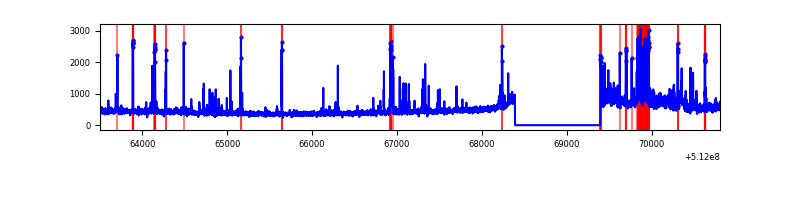 |
| B | 7306 | 6302 | 235 | 235 | 3.22% | 3.73% | 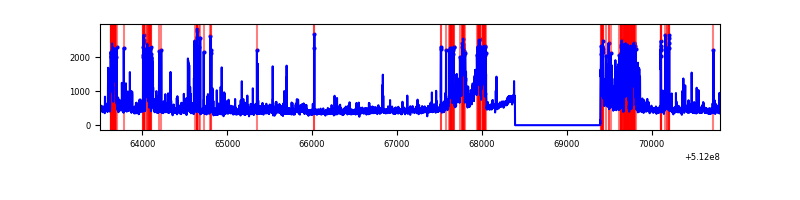 |
| C | 7306 | 6302 | 705 | 705 | 9.65% | 11.19% | 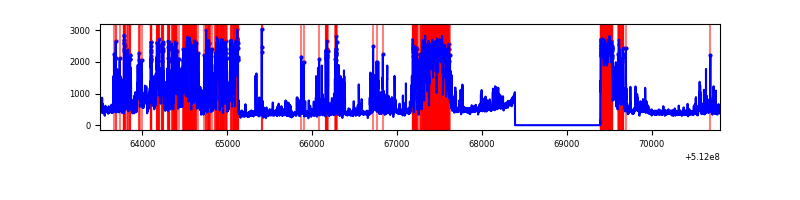 |
| D | 7306 | 6302 | 18 | 18 | 0.25% | 0.29% | 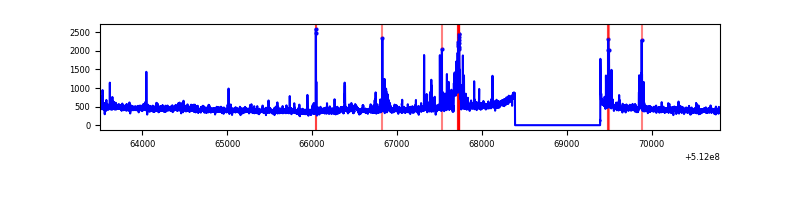 |
Top three noisy pixels from each quadrant. If the there are fewer than three noisy pixels in the level2.evt file, extra rows are filled as -1
| Pixel properties | Quadrant properties | ||||||
|---|---|---|---|---|---|---|---|
| Quadrant | DetID | PixID | Counts | Sigma | Mean | Median | Sigma |
| A | 3 | 14 | 359863 | 2154.47 | 670 | 652 | 166.7 |
| A | 3 | 62 | 295357 | 1767.58 | 670 | 652 | 166.7 |
| A | 10 | 251 | 166709 | 995.97 | 670 | 652 | 166.7 |
| B | 4 | 206 | 496333 | 3510.49 | 656 | 633 | 141.2 |
| B | 8 | 128 | 398882 | 2820.36 | 656 | 633 | 141.2 |
| B | 5 | 185 | 200455 | 1415.12 | 656 | 633 | 141.2 |
| C | 15 | 230 | 2116350 | 12333.76 | 620 | 612 | 171.5 |
| C | 6 | 223 | 335353 | 1951.38 | 620 | 612 | 171.5 |
| C | 13 | 3 | 285428 | 1660.34 | 620 | 612 | 171.5 |
| D | 2 | 249 | 140038 | 771.57 | 643 | 616 | 180.7 |
| D | 5 | 113 | 82386 | 452.52 | 643 | 616 | 180.7 |
| D | 5 | 173 | 50930 | 278.44 | 643 | 616 | 180.7 |
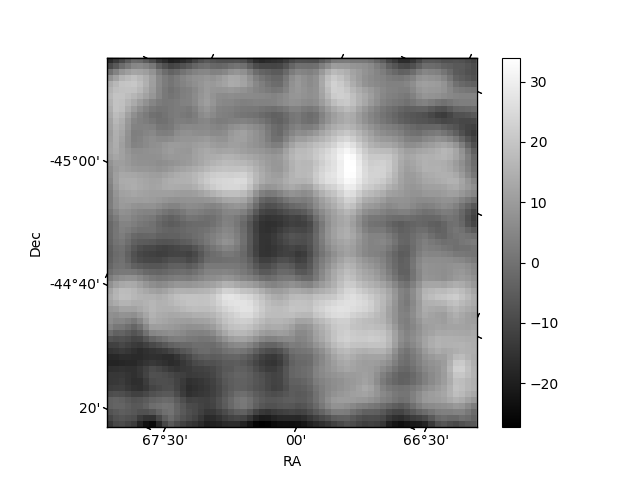
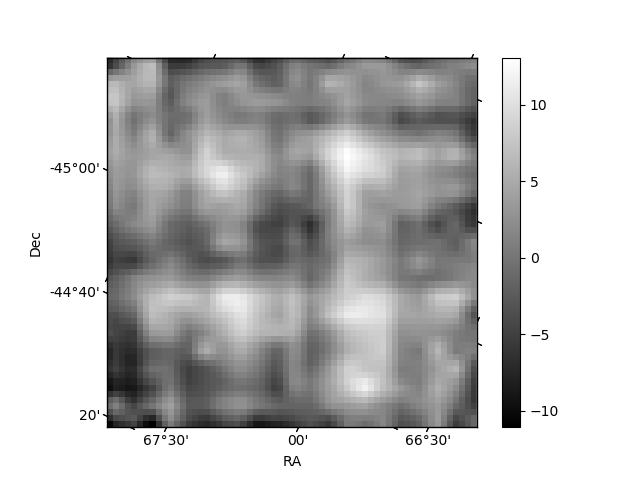
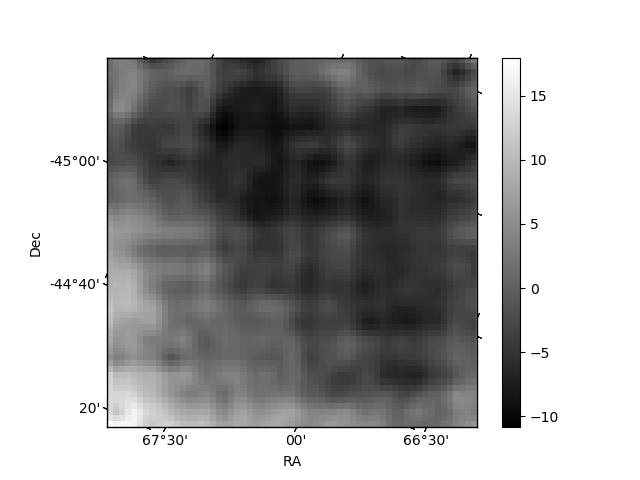
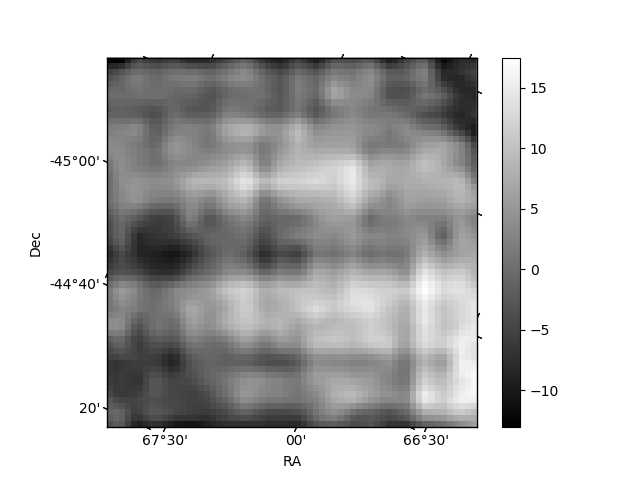
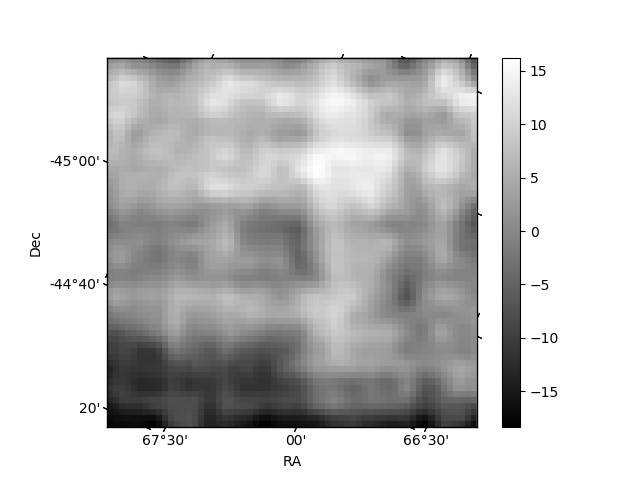
Histogram calculated using DETX and DETY for each event in the final _common_clean file
| Quadrant A | 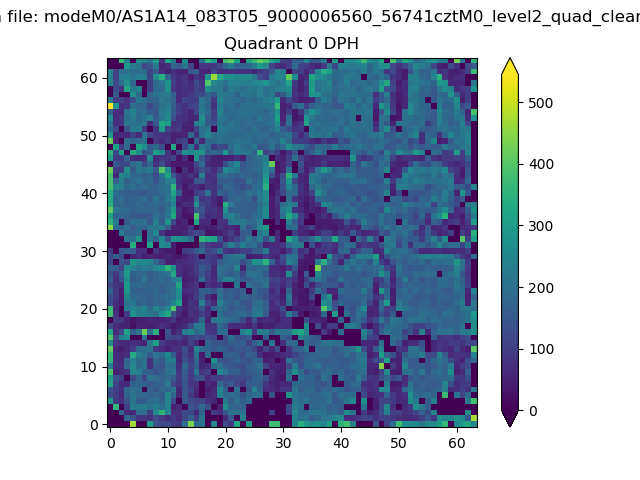 |
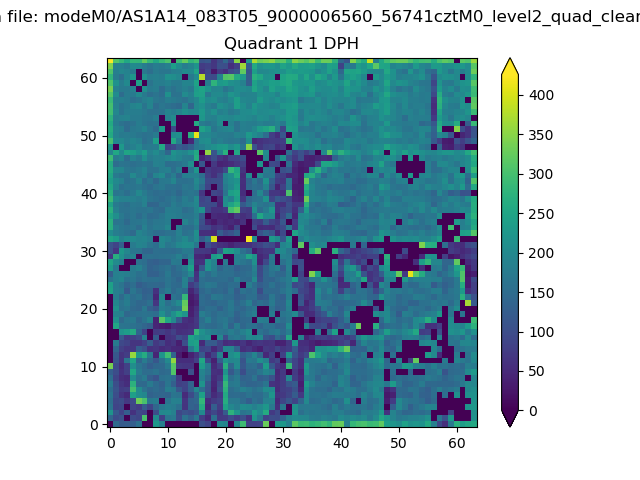 |
Quadrant B |
|---|---|---|---|
| Quadrant D | 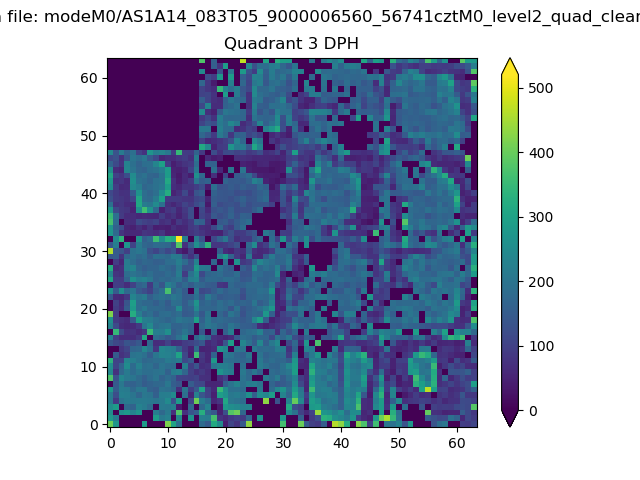 |
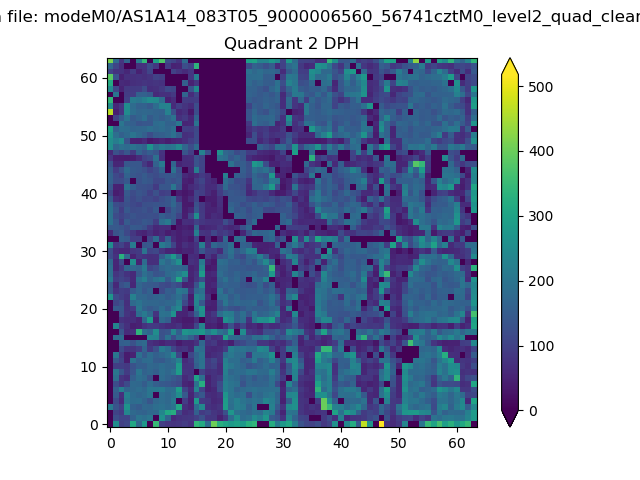 |
Quadrant C |
| Plot type | Count rate plots | Images |
|---|---|---|
| Comparison with Poisson distribution Blue bars denote a histogram of data divided into 1 sec bins. Red curve is a Poisson curve with rate = median count rate of data. |
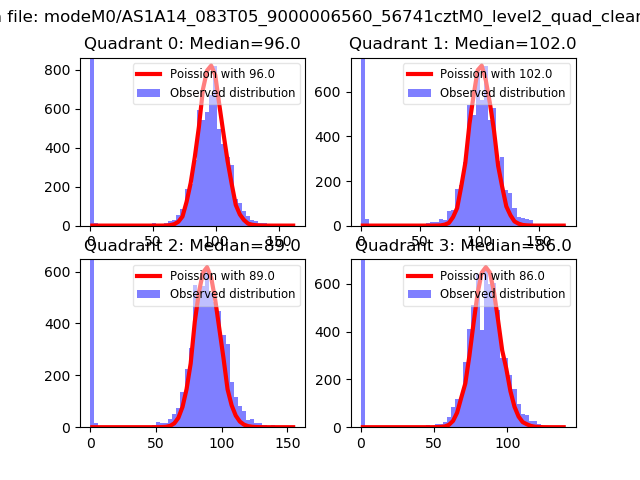 |
 |
| Quadrant-wise count rates Data is divided into 100 sec bins |
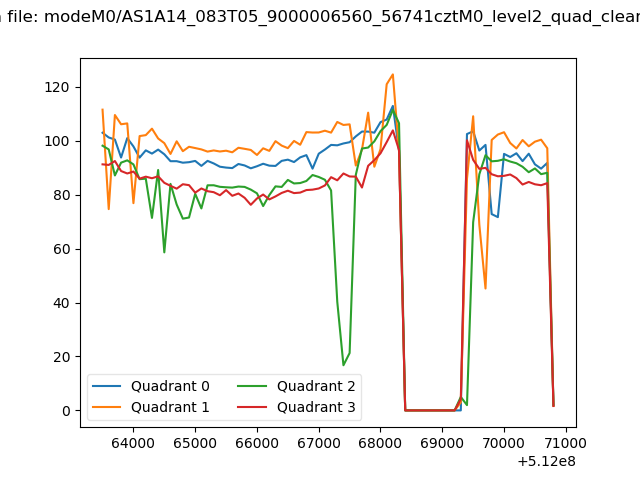 |
|
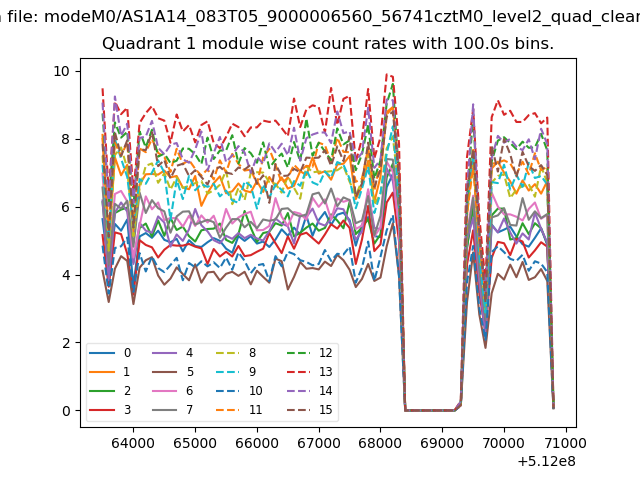
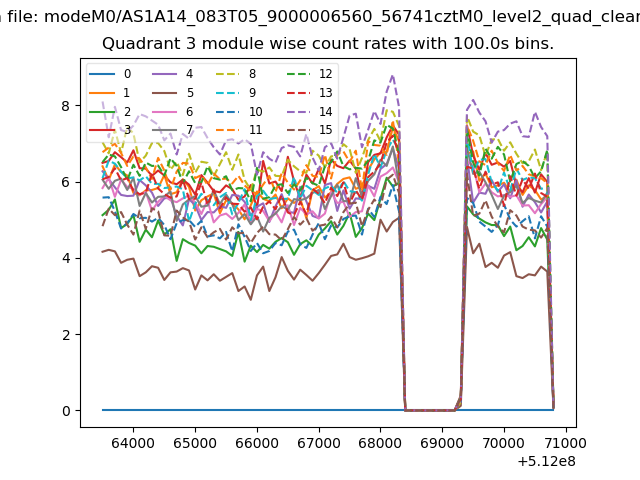
| Module-wise count rates for Quadrant A Data is divided into 100 sec bins |
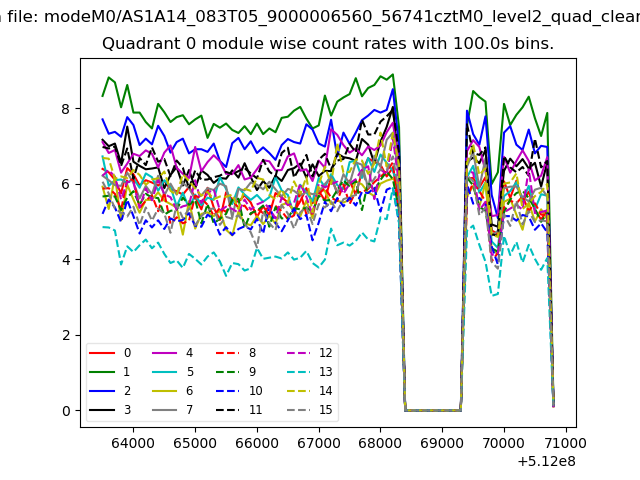 |
 |
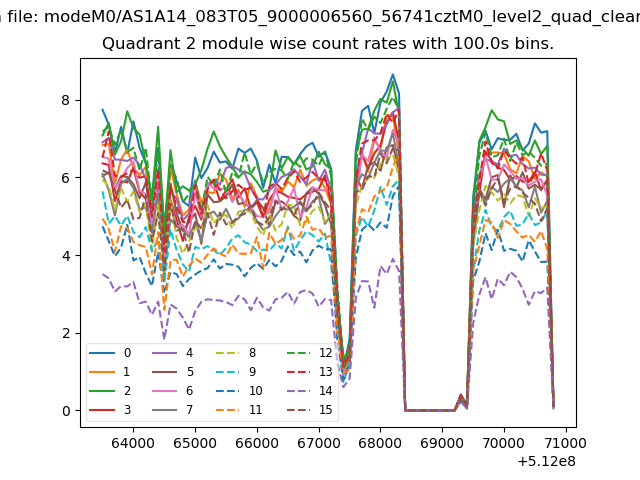
| Module-wise count rates for Quadrant B Data is divided into 100 sec bins |
 |
 |
| Module-wise count rates for Quadrant C Data is divided into 100 sec bins |
 |
 |
| Module-wise count rates for Quadrant D Data is divided into 100 sec bins |
 |
 |
| Parameter | Plot |
|---|---|
| CZT HV Monitor | 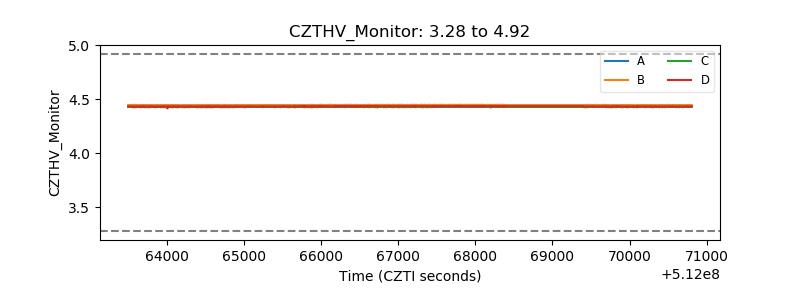 |
| D_VDD | 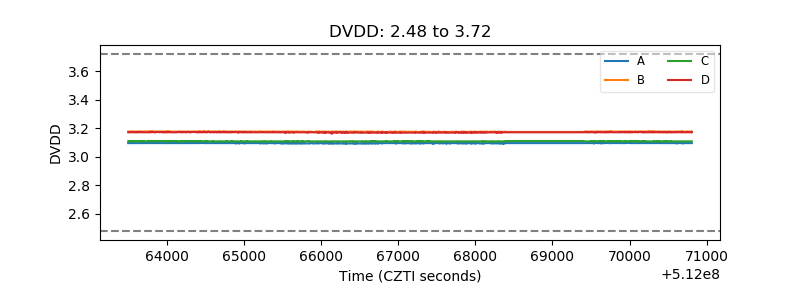 |
| Temperature 1 | 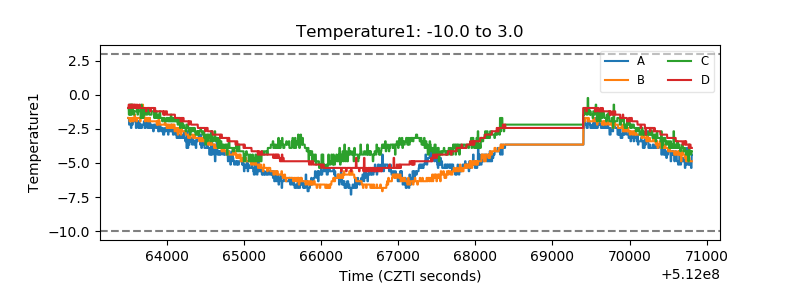 |
| Veto HV Monitor | 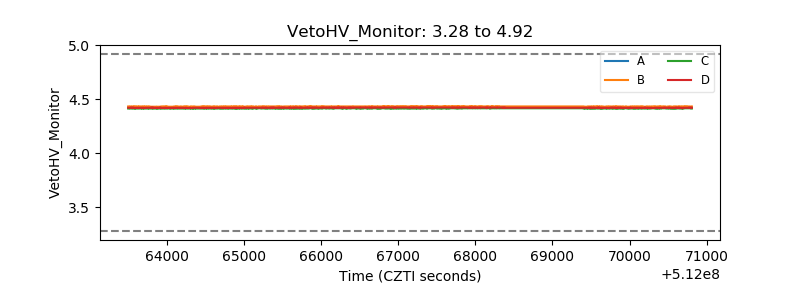 |
| Veto LLD | 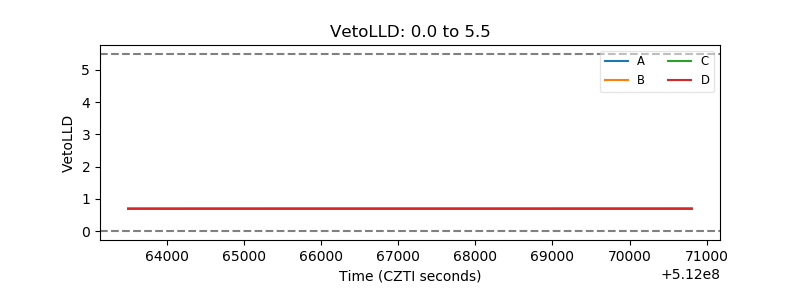 |
| Alpha Counter | 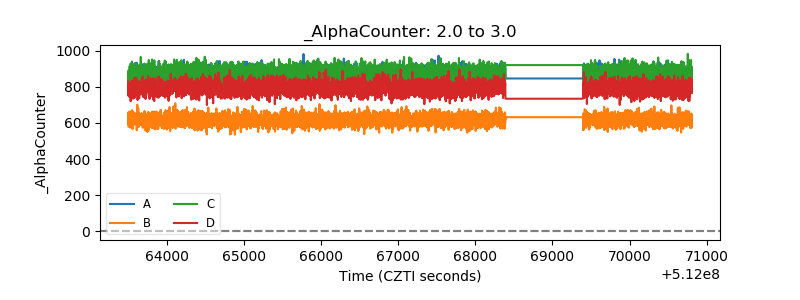 |
| _CPM_Rate | 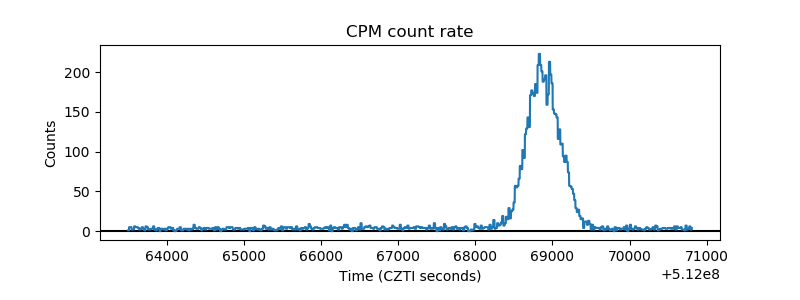 |
| CZT Counter | 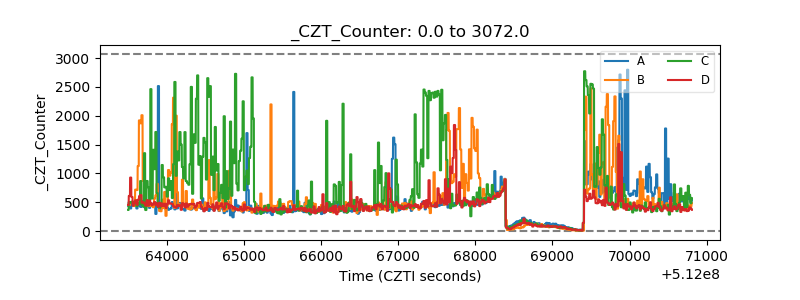 |
| +2.5 Volts monitor |  |
| +5 Volts monitor |  |
| _ROLL_ROT | 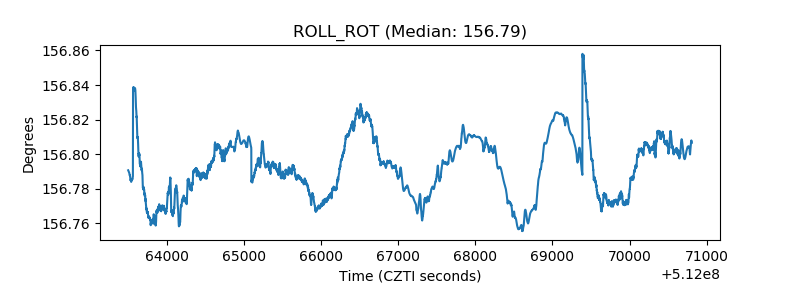 |
| _Roll_DEC | 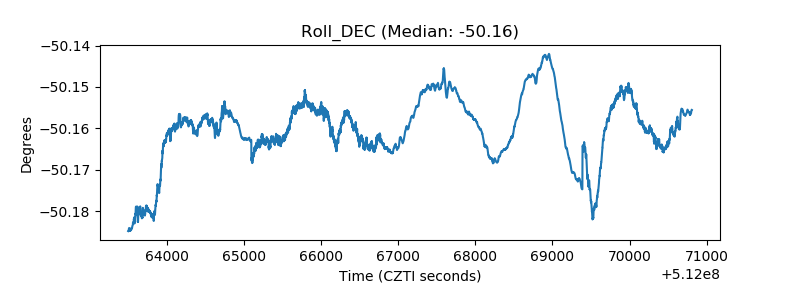 |
| _Roll_RA | 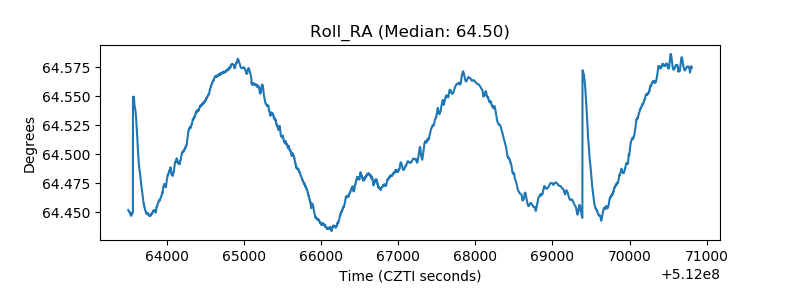 |
| Veto Counter | 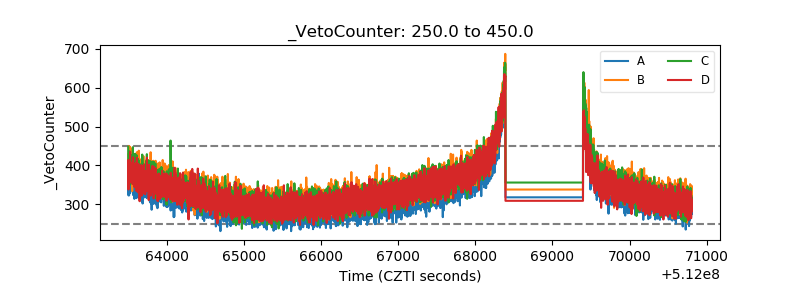 |