| Param | Original file | Final file |
|---|---|---|
| Filename | modeM0/AS1A14_083T05_9000006560_56743cztM0_level2.fits | modeM0/AS1A14_083T05_9000006560_56743cztM0_level2_quad_clean.evt |
| Size (bytes) | 548,619,840 | 105,874,560 |
| Size | 523.2 MB | 101.0 MB |
| Events in quadrant A | 4,393,407 | 710,597 |
| Events in quadrant B | 5,362,178 | 706,016 |
| Events in quadrant C | 5,807,992 | 614,747 |
| Events in quadrant D | 4,150,109 | 642,021 |
| Mode SS | |||
|---|---|---|---|
| Quadrant | BADHDUFLAG | Total packets | Discarded packets |
| A | 0 | 156 | 0 |
| B | 0 | 156 | 0 |
| C | 0 | 156 | 0 |
| D | 0 | 156 | 0 |
| Mode M0 | |||
|---|---|---|---|
| Quadrant | BADHDUFLAG | Total packets | Discarded packets |
| A | 0 | 18129 | 3 |
| B | 0 | 21330 | 3 |
| C | 0 | 23010 | 3 |
| D | 0 | 18070 | 3 |
| Mode M9 | |||
|---|---|---|---|
| Quadrant | BADHDUFLAG | Total packets | Discarded packets |
| A | 0 | 3 | 0 |
| B | 0 | 4 | 0 |
| C | 0 | 4 | 0 |
| D | 0 | 4 | 0 |
| Quadrant | Total seconds | Saturated seconds | Saturation percentage |
|---|---|---|---|
| A | 7648 | 193 | 2.523536% |
| B | 7648 | 811 | 10.604079% |
| C | 7648 | 897 | 11.728556% |
| D | 7648 | 161 | 2.105126% |
Noise dominated data is calculated using 1-second bins in cleaned event files. If a bin has >2000 counts, and if more than 50% of those come from <1% of pixels, then it is considered to be noise-dominated and hence unusable.
| Quadrant | # 1 sec bins | Bins with >0 counts | Bins with >2000 counts | High rate bins dominated by noise | Noise dominated (total time) | Noise dominated (detector-on time) | Marked lightcurve |
|---|---|---|---|---|---|---|---|
| A | 7813 | 7650 | 78 | 78 | 1.00% | 1.02% | 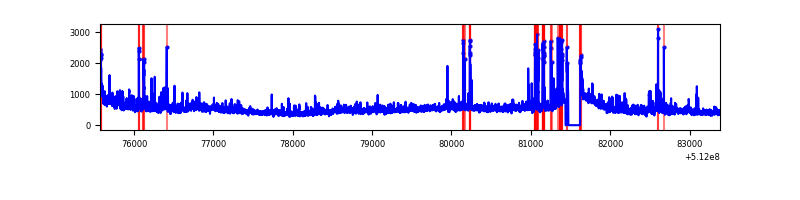 |
| B | 7813 | 7650 | 394 | 394 | 5.04% | 5.15% | 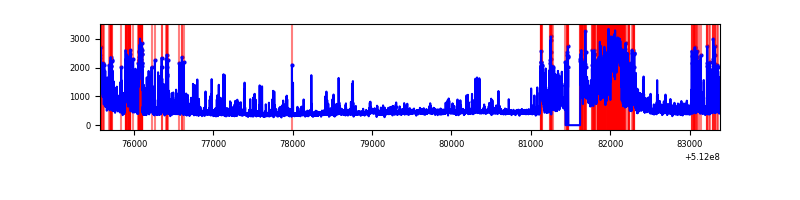 |
| C | 7813 | 7650 | 719 | 719 | 9.20% | 9.40% | 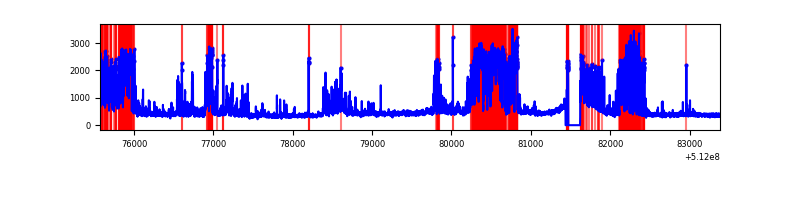 |
| D | 7813 | 7650 | 139 | 139 | 1.78% | 1.82% | 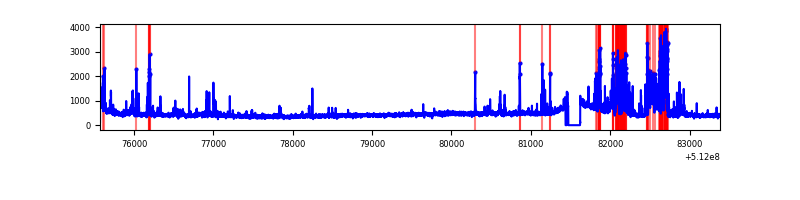 |
Top three noisy pixels from each quadrant. If the there are fewer than three noisy pixels in the level2.evt file, extra rows are filled as -1
| Pixel properties | Quadrant properties | ||||||
|---|---|---|---|---|---|---|---|
| Quadrant | DetID | PixID | Counts | Sigma | Mean | Median | Sigma |
| A | 3 | 14 | 912109 | 4496.92 | 822 | 802 | 202.7 |
| A | 3 | 62 | 211394 | 1039.18 | 822 | 802 | 202.7 |
| A | 10 | 251 | 73997 | 361.19 | 822 | 802 | 202.7 |
| B | 4 | 206 | 1106054 | 6638.68 | 776 | 749 | 166.5 |
| B | 5 | 185 | 827208 | 4963.87 | 776 | 749 | 166.5 |
| B | 10 | 16 | 142973 | 854.22 | 776 | 749 | 166.5 |
| C | 15 | 230 | 1579943 | 7672.57 | 756 | 749 | 205.8 |
| C | 15 | 208 | 599417 | 2908.65 | 756 | 749 | 205.8 |
| C | 1 | 12 | 520409 | 2524.79 | 756 | 749 | 205.8 |
| D | 2 | 249 | 607424 | 2716.33 | 792 | 756 | 223.3 |
| D | 2 | 31 | 105815 | 470.4 | 792 | 756 | 223.3 |
| D | 5 | 222 | 73472 | 325.58 | 792 | 756 | 223.3 |
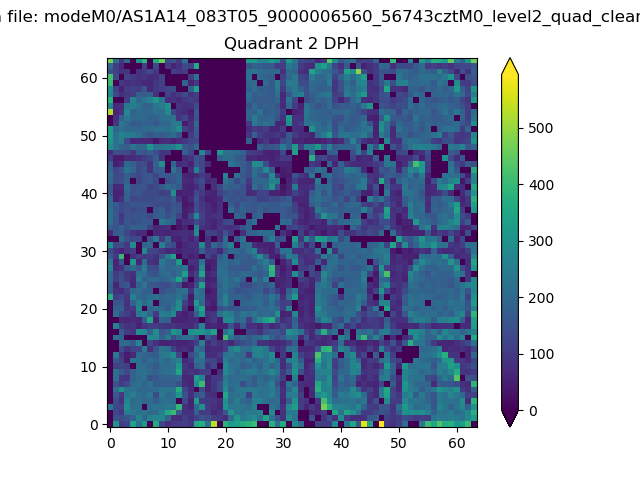
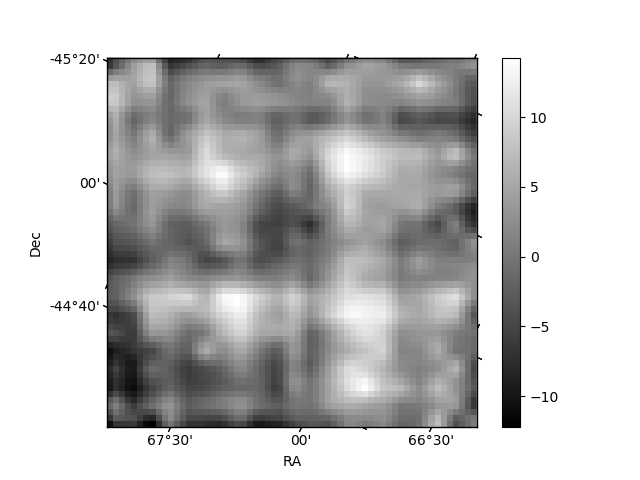
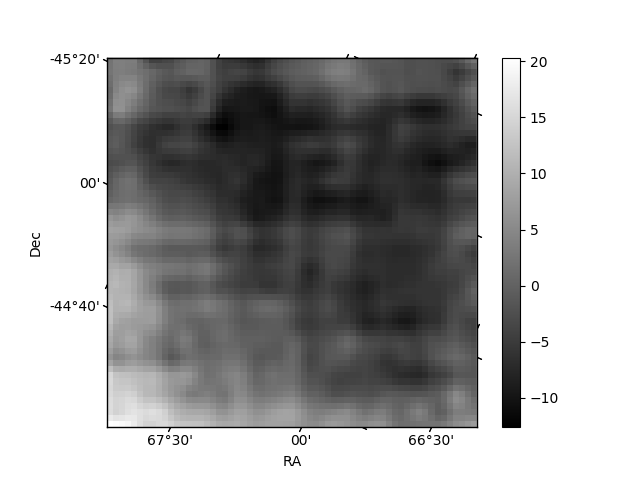
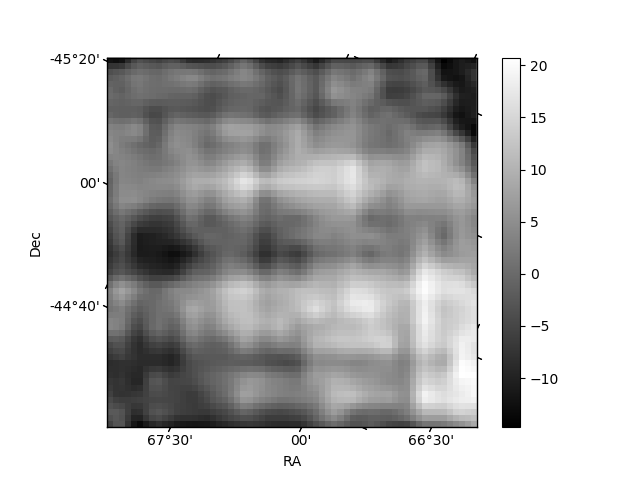
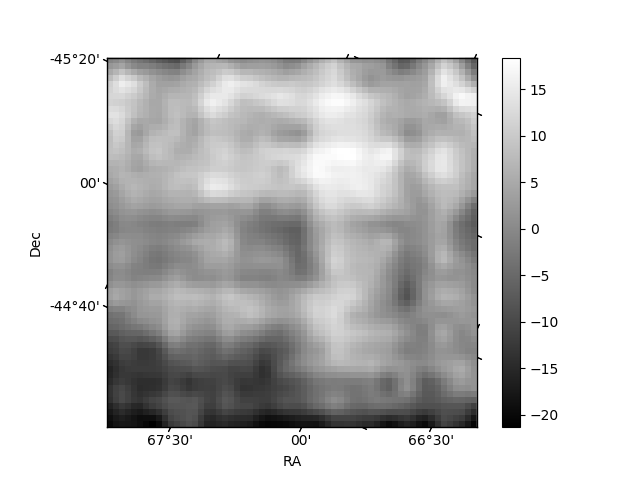
Histogram calculated using DETX and DETY for each event in the final _common_clean file
| Quadrant A | 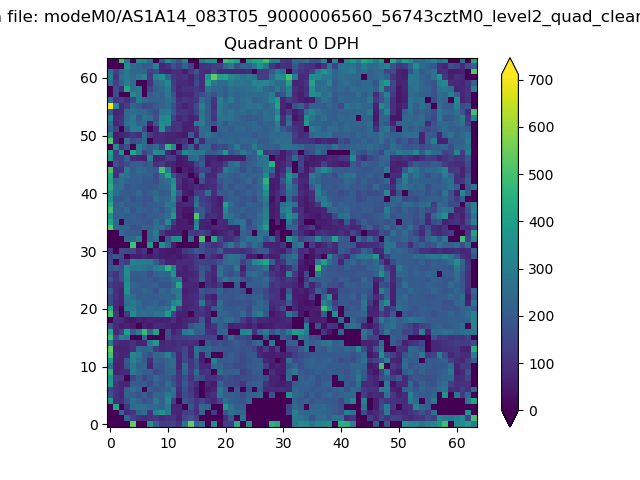 |
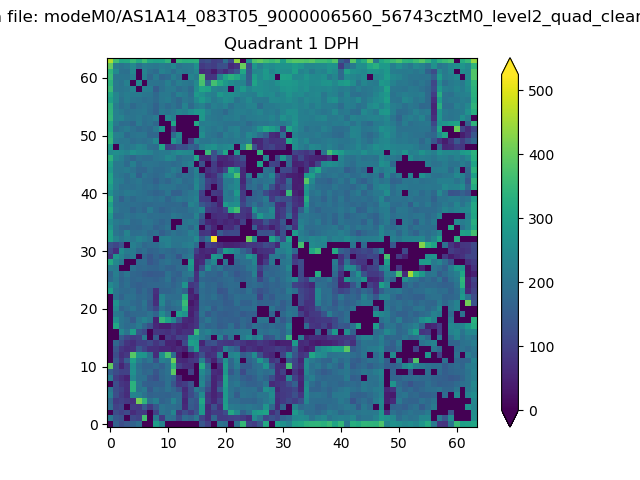 |
Quadrant B |
|---|---|---|---|
| Quadrant D | 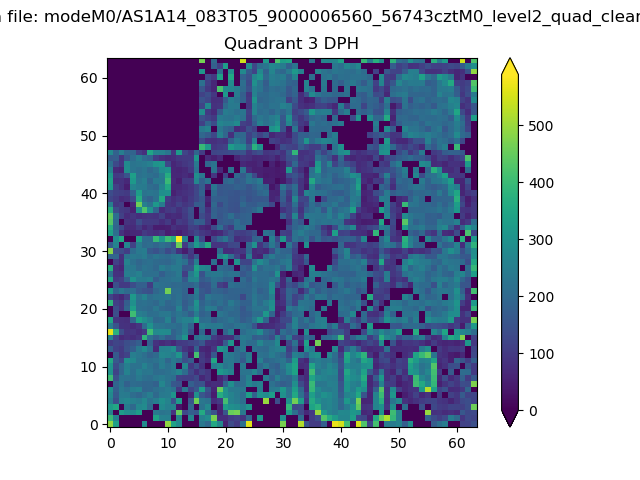 |
 |
Quadrant C |
| Plot type | Count rate plots | Images |
|---|---|---|
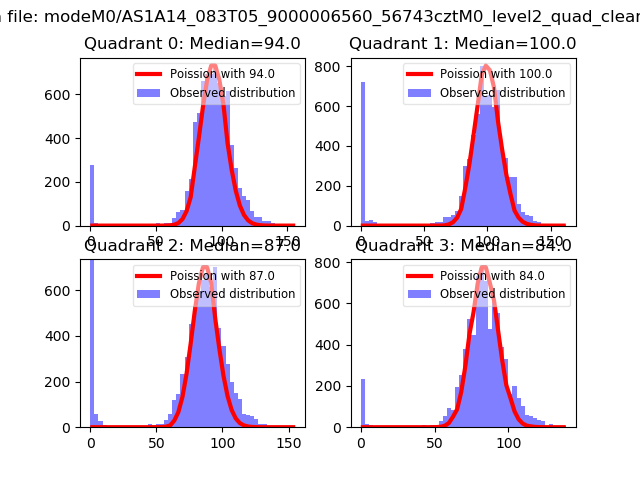
| Comparison with Poisson distribution Blue bars denote a histogram of data divided into 1 sec bins. Red curve is a Poisson curve with rate = median count rate of data. |
 |
 |
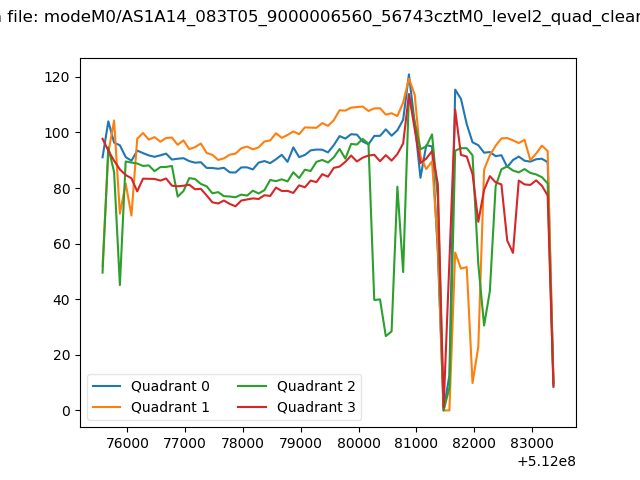
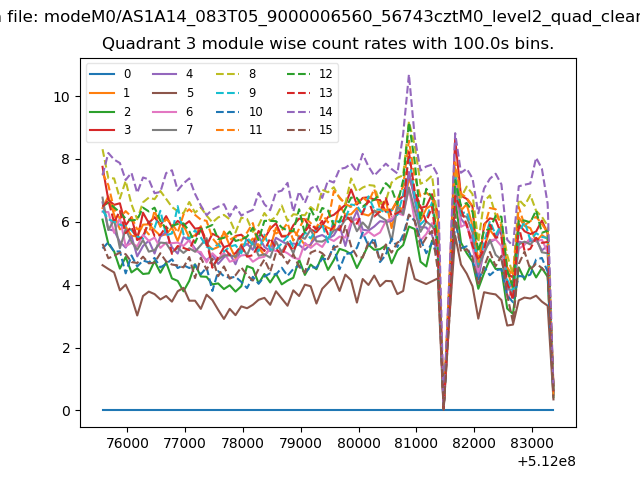
| Quadrant-wise count rates Data is divided into 100 sec bins |
 |
|
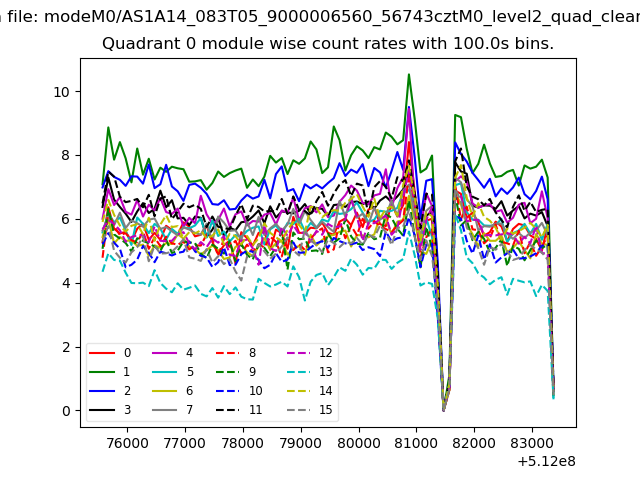
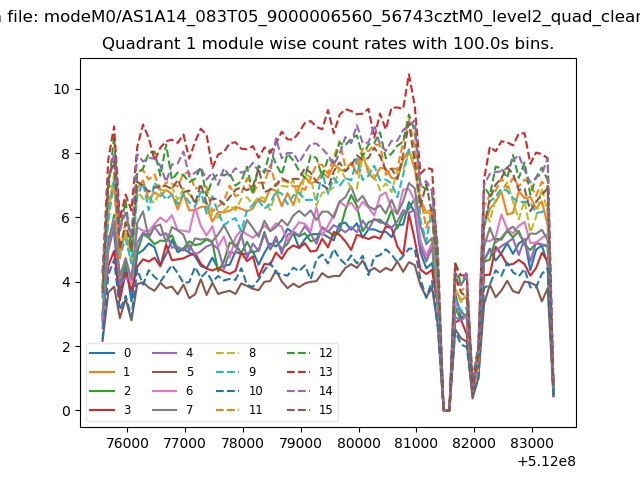
| Module-wise count rates for Quadrant A Data is divided into 100 sec bins |
 |
 |
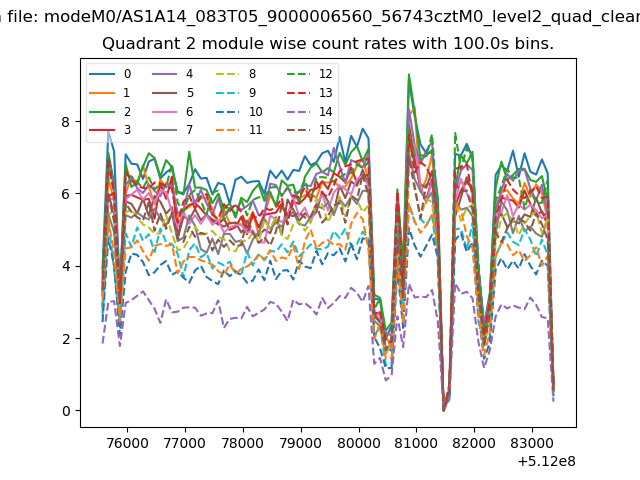
| Module-wise count rates for Quadrant B Data is divided into 100 sec bins |
 |
 |
| Module-wise count rates for Quadrant C Data is divided into 100 sec bins |
 |
 |
| Module-wise count rates for Quadrant D Data is divided into 100 sec bins |
 |
 |
| Parameter | Plot |
|---|---|
| CZT HV Monitor | 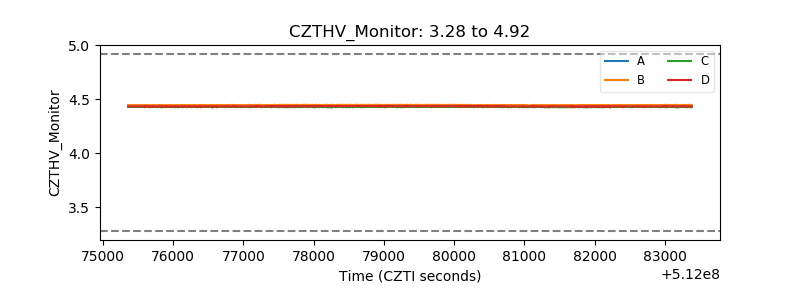 |
| D_VDD | 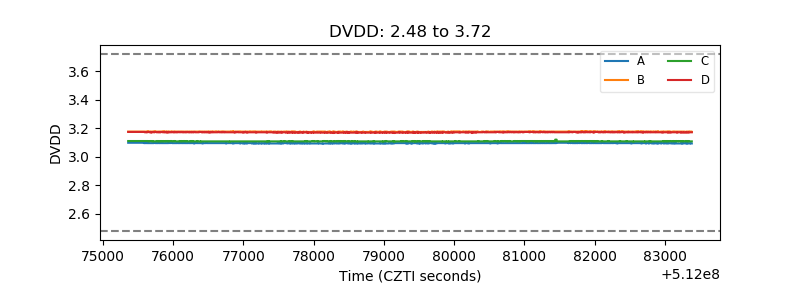 |
| Temperature 1 | 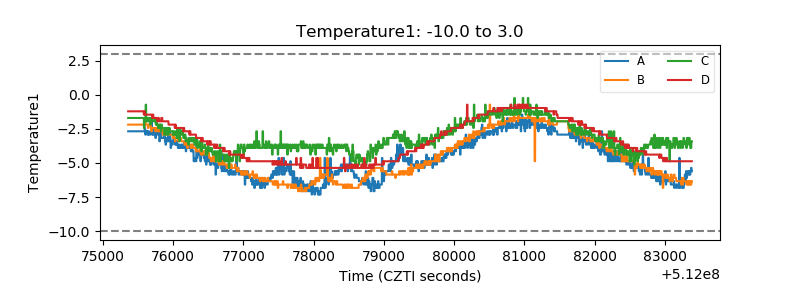 |
| Veto HV Monitor | 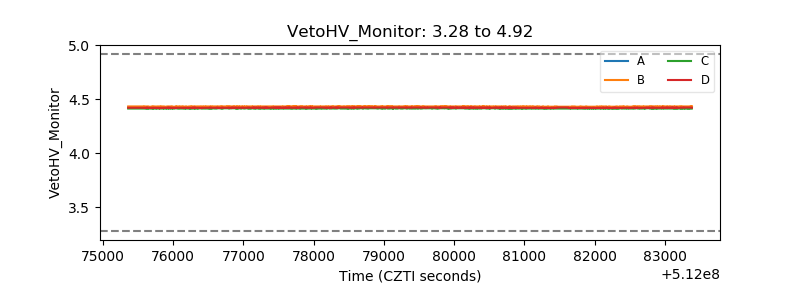 |
| Veto LLD | 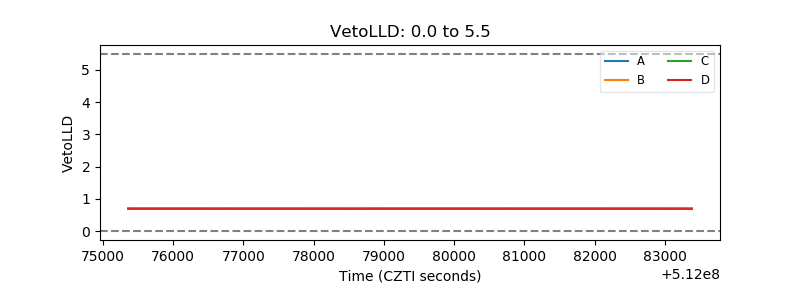 |
| Alpha Counter | 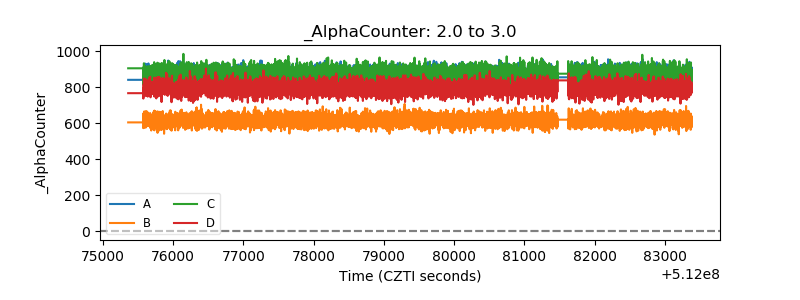 |
| _CPM_Rate | 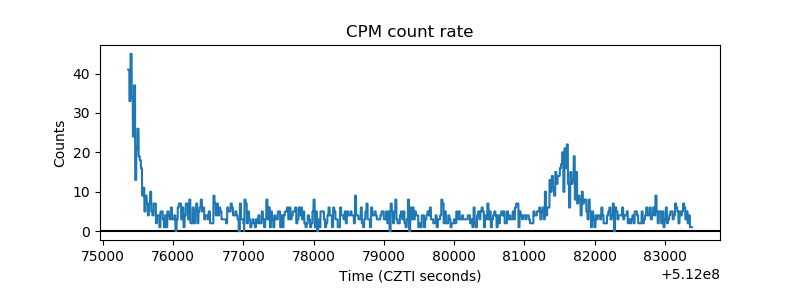 |
| CZT Counter | 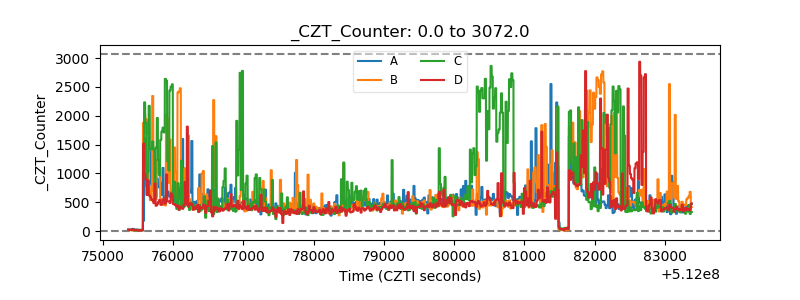 |
| +2.5 Volts monitor |  |
| +5 Volts monitor |  |
| _ROLL_ROT | 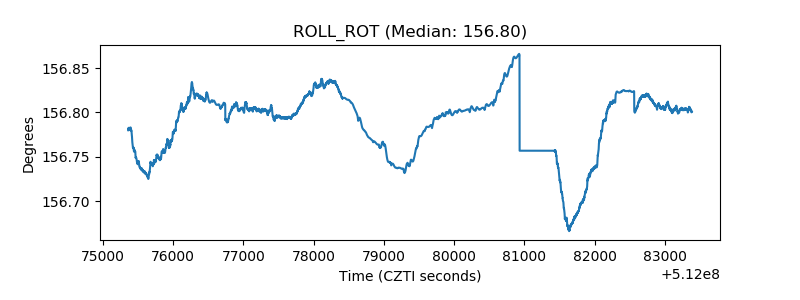 |
| _Roll_DEC | 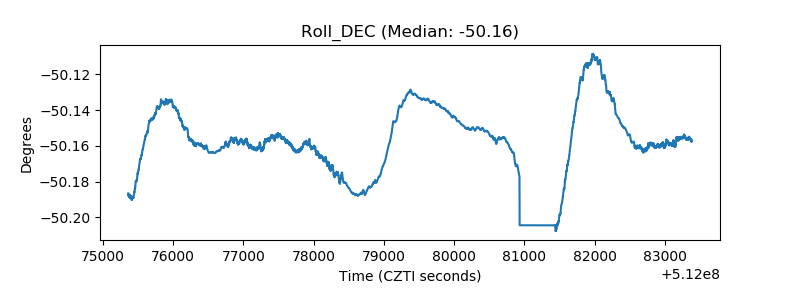 |
| _Roll_RA | 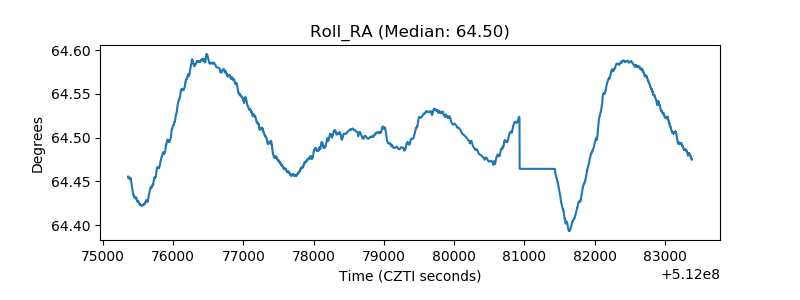 |
| Veto Counter | 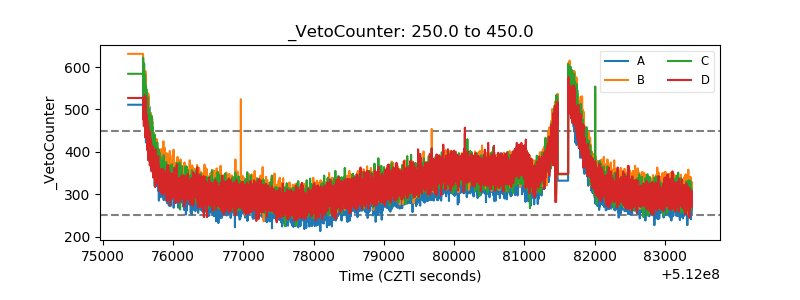 |