| Param | Original file | Final file |
|---|---|---|
| Filename | modeM0/AS1A14_083T05_9000006560_56744cztM0_level2.fits | modeM0/AS1A14_083T05_9000006560_56744cztM0_level2_quad_clean.evt |
| Size (bytes) | 566,444,160 | 110,232,000 |
| Size | 540.2 MB | 105.1 MB |
| Events in quadrant A | 4,767,119 | 723,708 |
| Events in quadrant B | 6,020,170 | 735,033 |
| Events in quadrant C | 5,089,194 | 666,348 |
| Events in quadrant D | 4,475,913 | 661,261 |
| Mode SS | |||
|---|---|---|---|
| Quadrant | BADHDUFLAG | Total packets | Discarded packets |
| A | 0 | 162 | 0 |
| B | 0 | 162 | 0 |
| C | 0 | 162 | 0 |
| D | 0 | 162 | 0 |
| Mode M0 | |||
|---|---|---|---|
| Quadrant | BADHDUFLAG | Total packets | Discarded packets |
| A | 0 | 19800 | 2 |
| B | 0 | 23283 | 2 |
| C | 0 | 21091 | 2 |
| D | 0 | 19051 | 2 |
| Mode M9 | |||
|---|---|---|---|
| Quadrant | BADHDUFLAG | Total packets | Discarded packets |
| A | 0 | 1 | 0 |
| B | 0 | 1 | 0 |
| C | 0 | 1 | 0 |
| D | 0 | 1 | 0 |
| Quadrant | Total seconds | Saturated seconds | Saturation percentage |
|---|---|---|---|
| A | 7923 | 354 | 4.468005% |
| B | 7924 | 819 | 10.335689% |
| C | 7924 | 635 | 8.013629% |
| D | 7924 | 151 | 1.905603% |
Noise dominated data is calculated using 1-second bins in cleaned event files. If a bin has >2000 counts, and if more than 50% of those come from <1% of pixels, then it is considered to be noise-dominated and hence unusable.
| Quadrant | # 1 sec bins | Bins with >0 counts | Bins with >2000 counts | High rate bins dominated by noise | Noise dominated (total time) | Noise dominated (detector-on time) | Marked lightcurve |
|---|---|---|---|---|---|---|---|
| A | 8088 | 7925 | 223 | 223 | 2.76% | 2.81% | 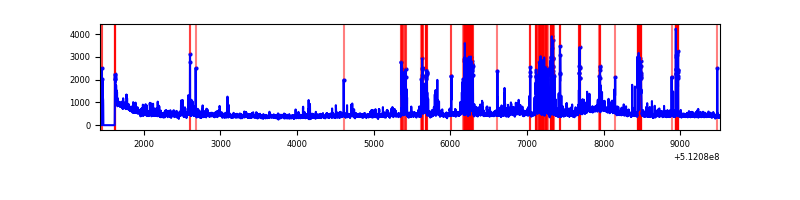 |
| B | 8089 | 7926 | 380 | 380 | 4.70% | 4.79% | 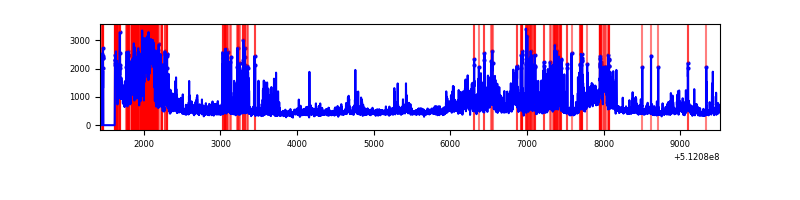 |
| C | 8089 | 7926 | 365 | 365 | 4.51% | 4.61% | 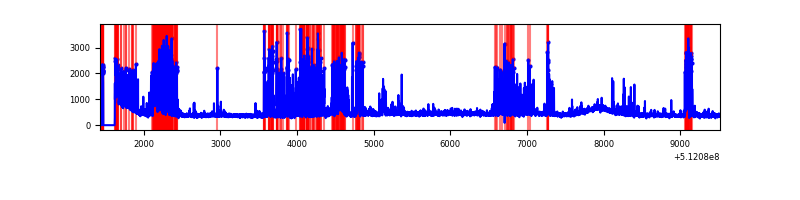 |
| D | 8089 | 7926 | 145 | 145 | 1.79% | 1.83% | 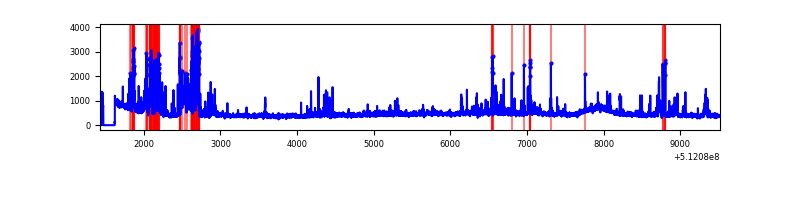 |
Top three noisy pixels from each quadrant. If the there are fewer than three noisy pixels in the level2.evt file, extra rows are filled as -1
| Pixel properties | Quadrant properties | ||||||
|---|---|---|---|---|---|---|---|
| Quadrant | DetID | PixID | Counts | Sigma | Mean | Median | Sigma |
| A | 3 | 62 | 775861 | 3728.5 | 849 | 826 | 207.9 |
| A | 3 | 14 | 550476 | 2644.23 | 849 | 826 | 207.9 |
| A | 10 | 251 | 121543 | 580.74 | 849 | 826 | 207.9 |
| B | 5 | 185 | 1254621 | 7142.83 | 814 | 783 | 175.5 |
| B | 4 | 206 | 1138146 | 6479.3 | 814 | 783 | 175.5 |
| B | 10 | 16 | 109094 | 617.02 | 814 | 783 | 175.5 |
| C | 1 | 12 | 1373553 | 6217.35 | 804 | 795 | 220.8 |
| C | 15 | 230 | 284580 | 1285.29 | 804 | 795 | 220.8 |
| C | 12 | 252 | 65309 | 292.19 | 804 | 795 | 220.8 |
| D | 2 | 249 | 729287 | 3111.7 | 826 | 787 | 234.1 |
| D | 2 | 31 | 107028 | 453.8 | 826 | 787 | 234.1 |
| D | 5 | 222 | 87560 | 370.64 | 826 | 787 | 234.1 |
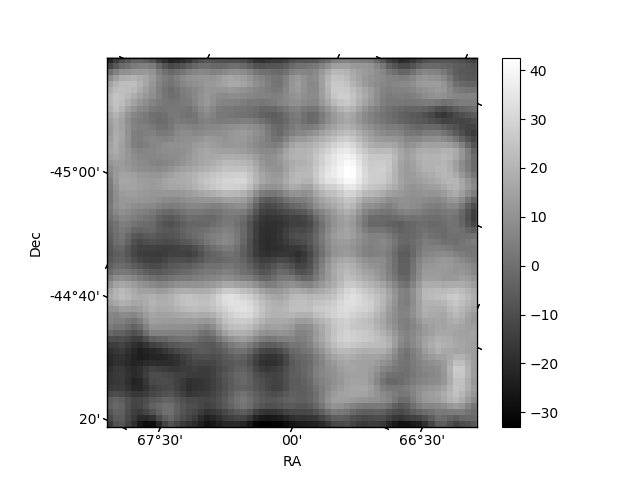
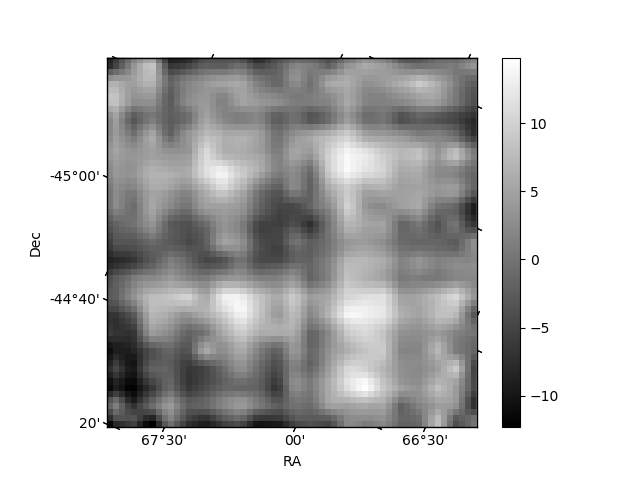
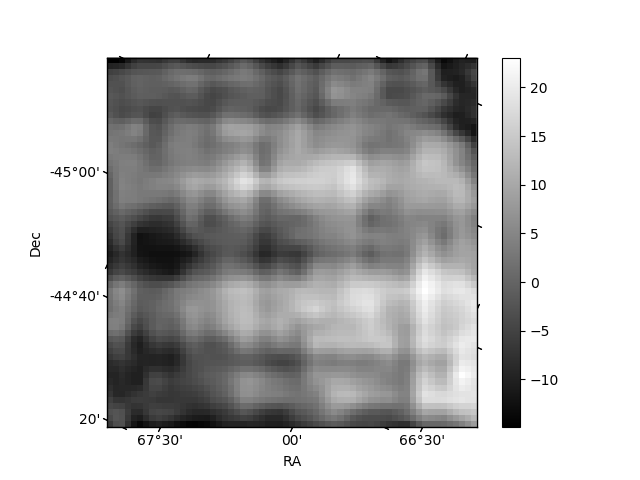
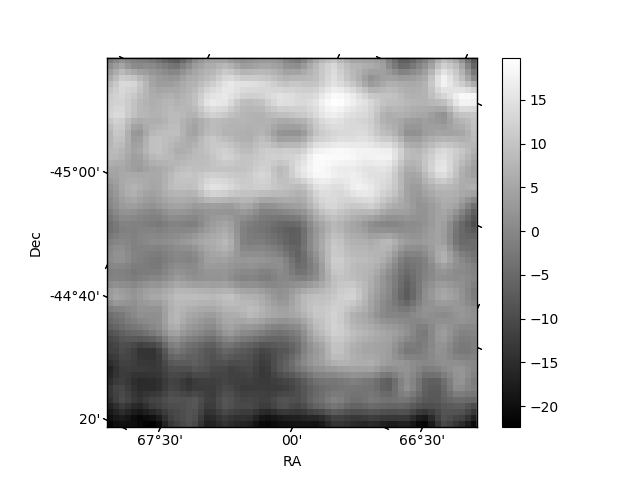
Histogram calculated using DETX and DETY for each event in the final _common_clean file
| Quadrant A | 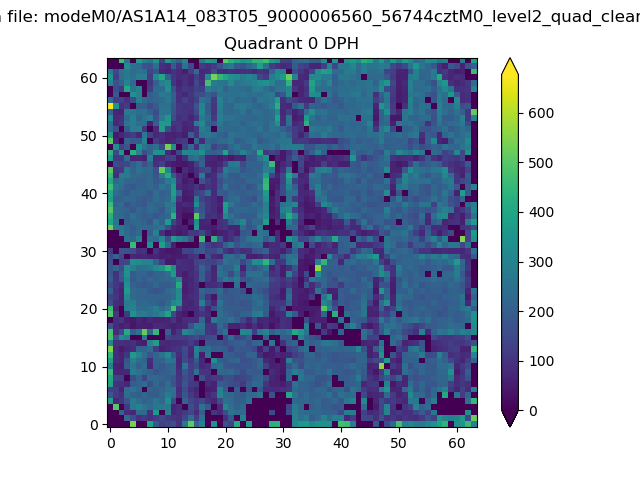 |
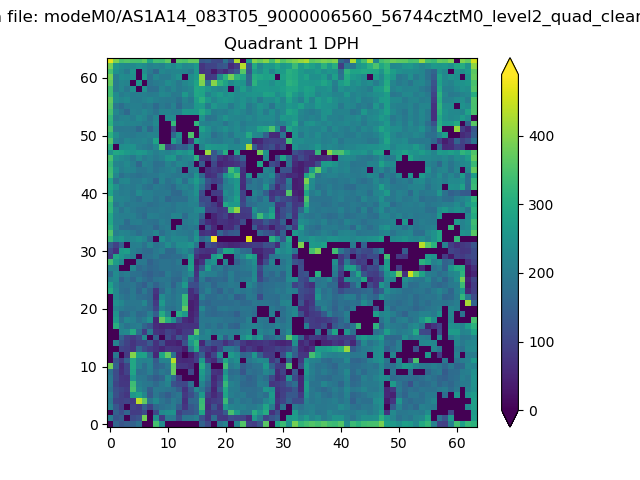 |
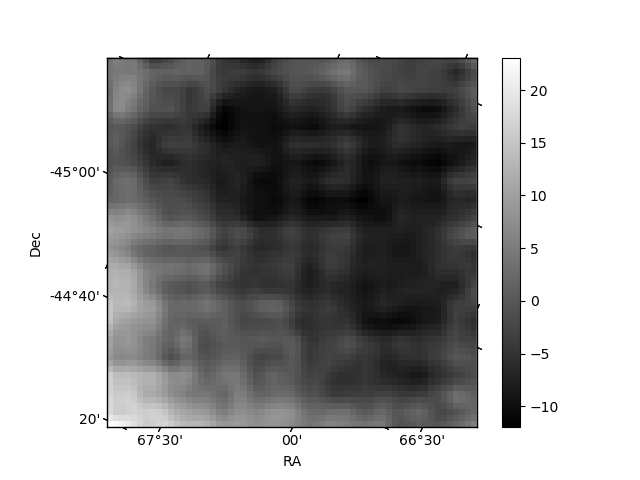
Quadrant B |
|---|---|---|---|
| Quadrant D | 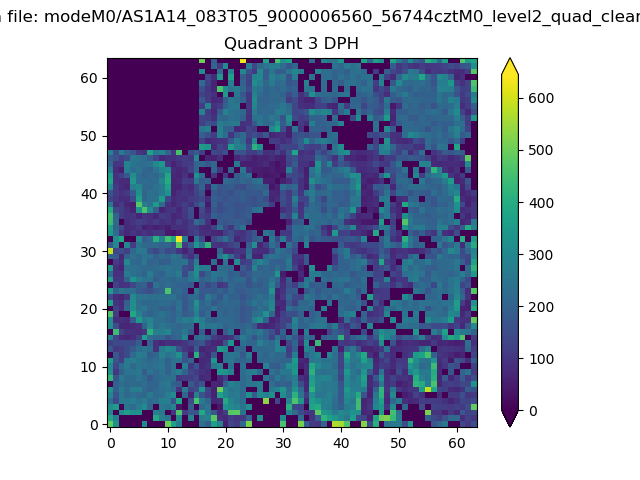 |
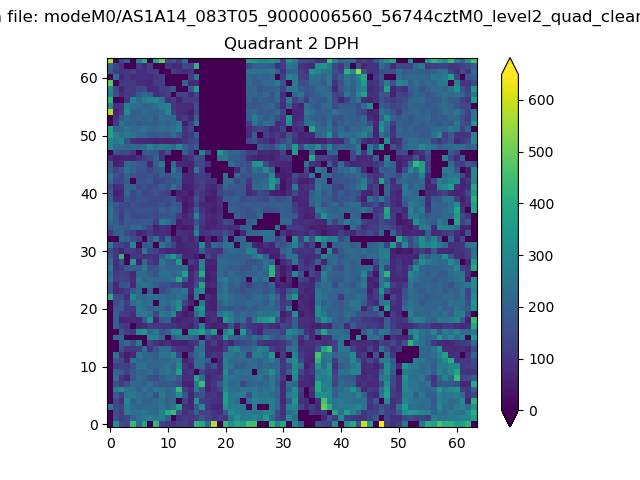 |
Quadrant C |
| Plot type | Count rate plots | Images |
|---|---|---|
| Comparison with Poisson distribution Blue bars denote a histogram of data divided into 1 sec bins. Red curve is a Poisson curve with rate = median count rate of data. |
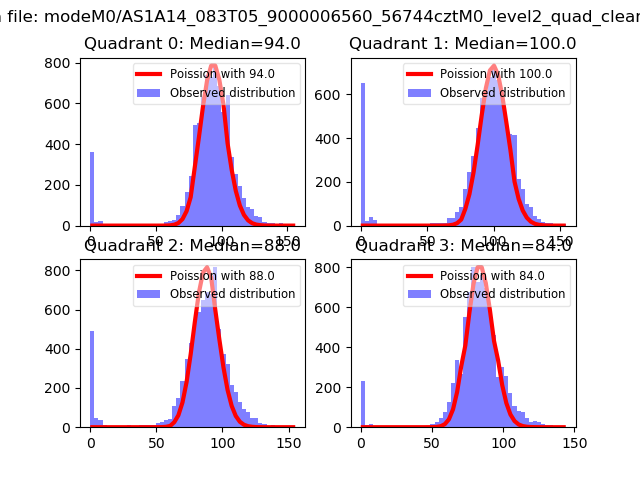 |
 |
| Quadrant-wise count rates Data is divided into 100 sec bins |
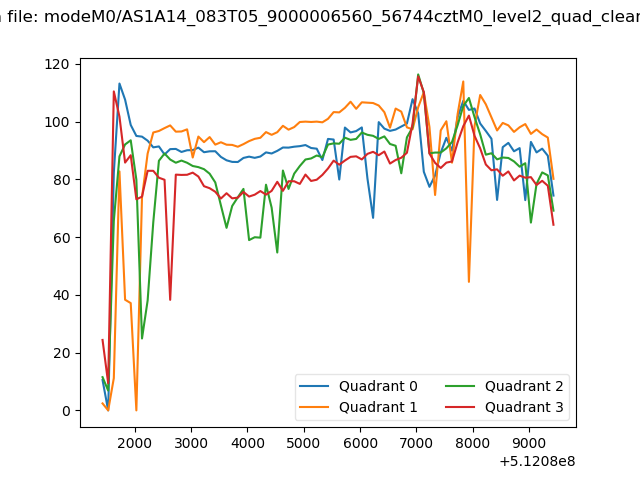 |
|
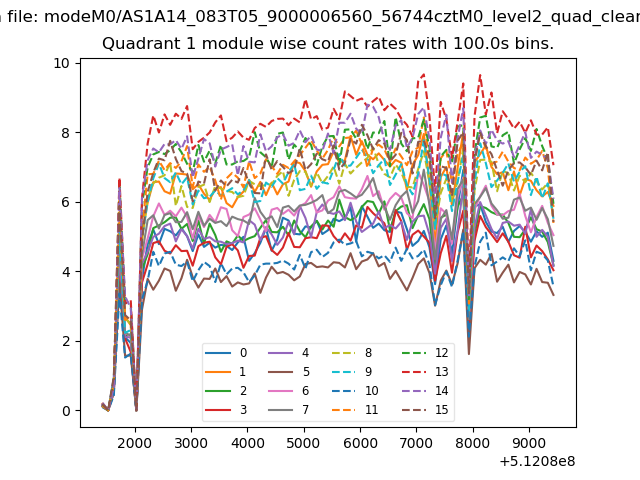
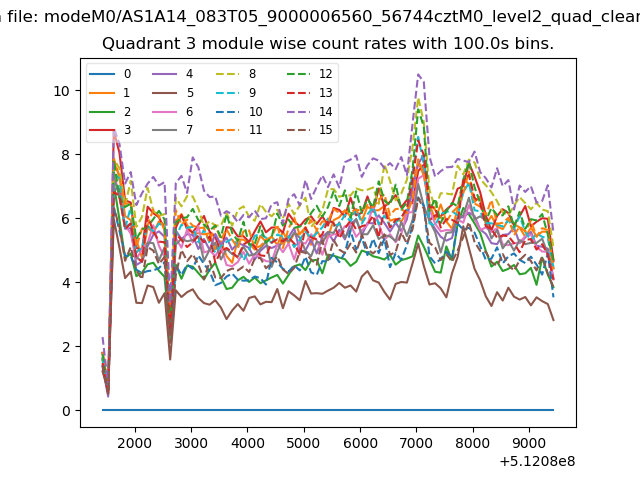
| Module-wise count rates for Quadrant A Data is divided into 100 sec bins |
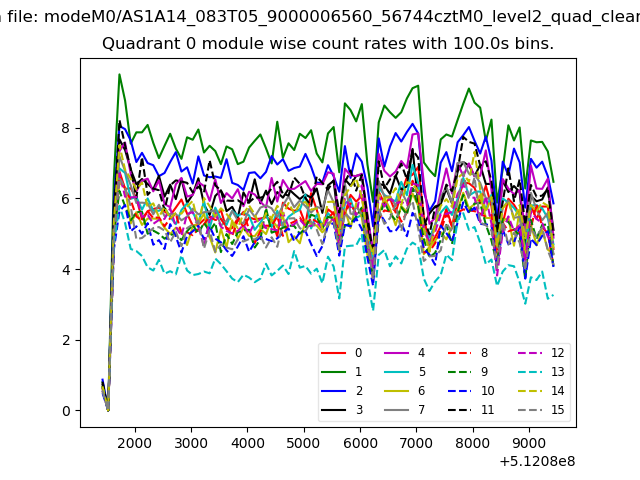 |
 |
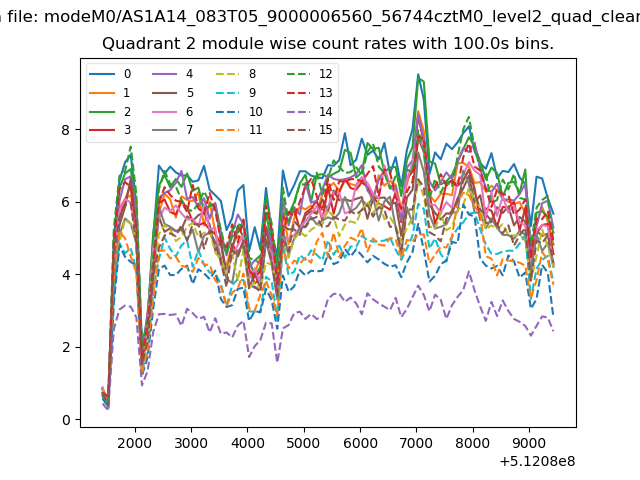
| Module-wise count rates for Quadrant B Data is divided into 100 sec bins |
 |
 |
| Module-wise count rates for Quadrant C Data is divided into 100 sec bins |
 |
 |
| Module-wise count rates for Quadrant D Data is divided into 100 sec bins |
 |
 |
| Parameter | Plot |
|---|---|
| CZT HV Monitor | 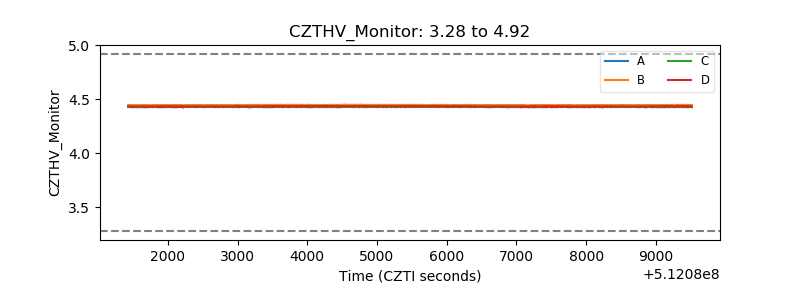 |
| D_VDD | 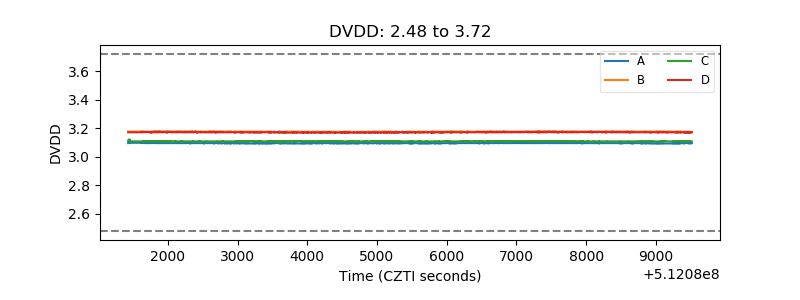 |
| Temperature 1 | 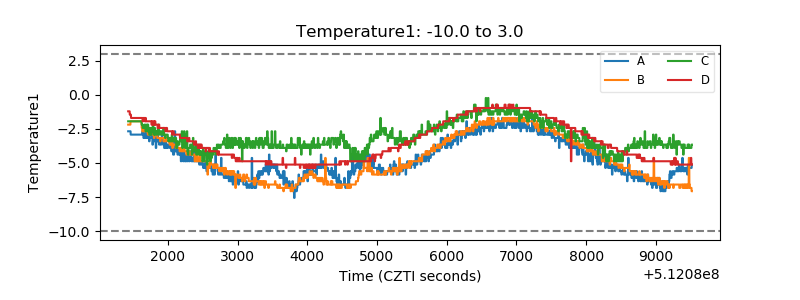 |
| Veto HV Monitor | 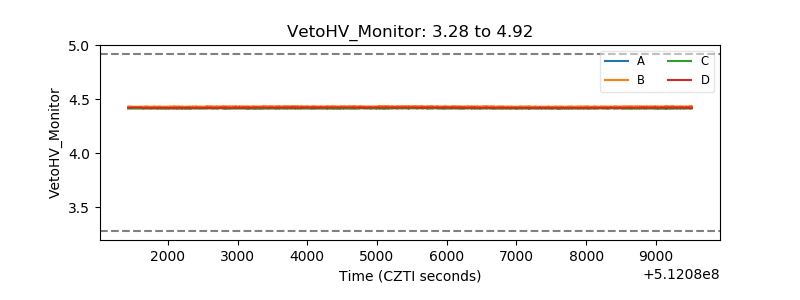 |
| Veto LLD | 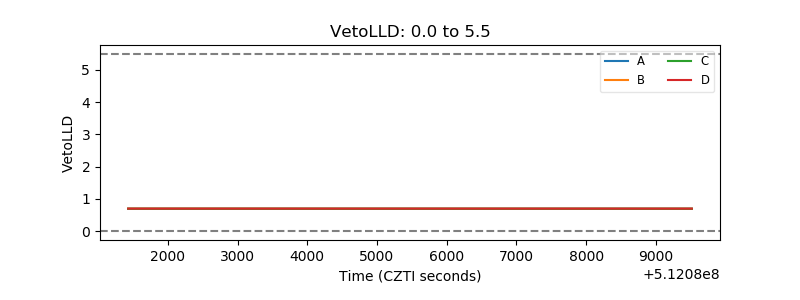 |
| Alpha Counter | 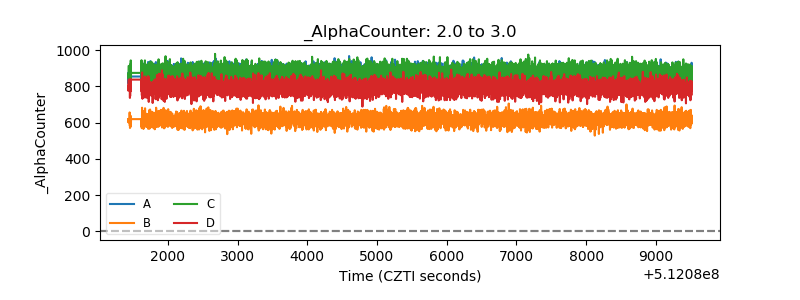 |
| _CPM_Rate | 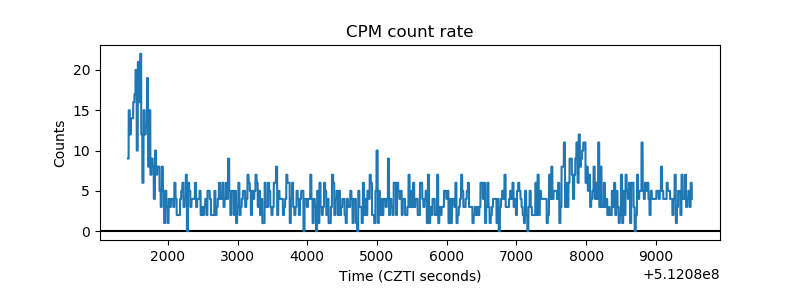 |
| CZT Counter | 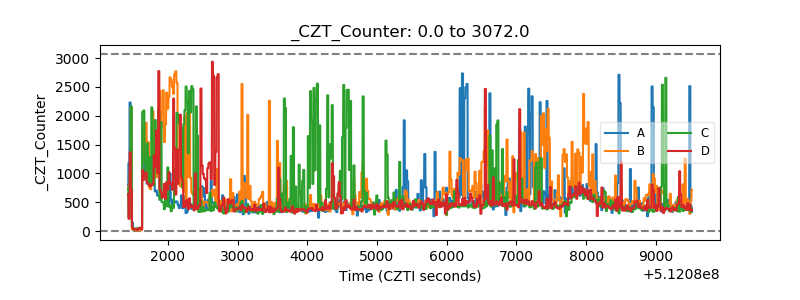 |
| +2.5 Volts monitor |  |
| +5 Volts monitor |  |
| _ROLL_ROT | 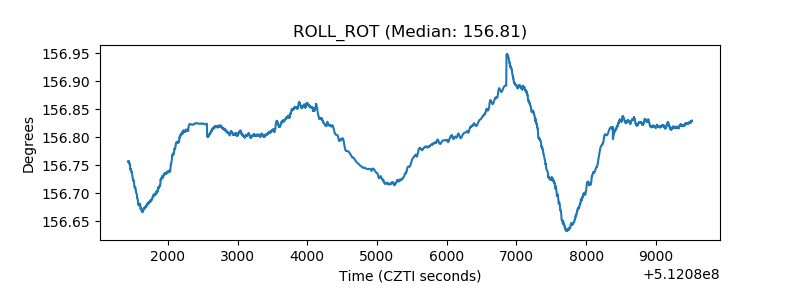 |
| _Roll_DEC | 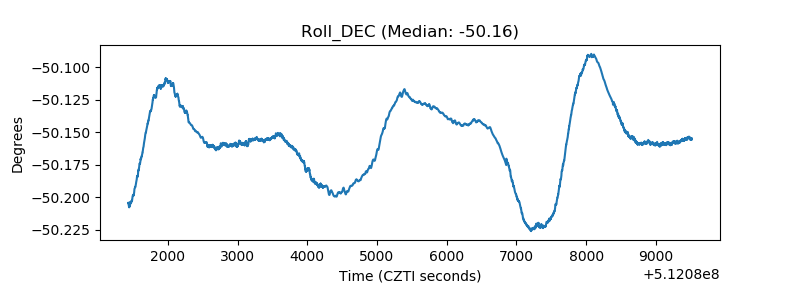 |
| _Roll_RA | 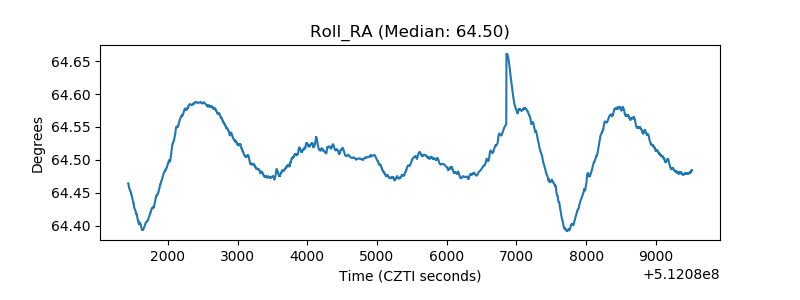 |
| Veto Counter | 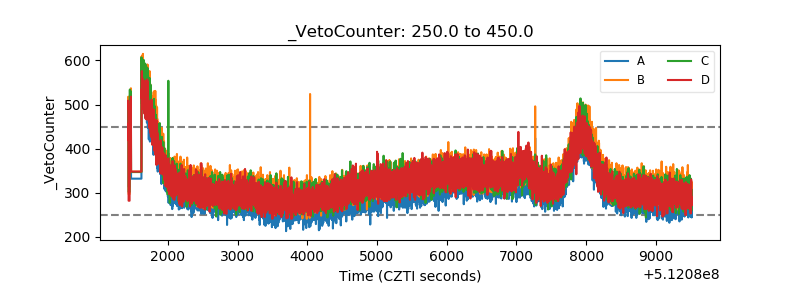 |