| Param | Original file | Final file |
|---|---|---|
| Filename | modeM0/AS1A14_083T05_9000006560_56751cztM0_level2.fits | modeM0/AS1A14_083T05_9000006560_56751cztM0_level2_quad_clean.evt |
| Size (bytes) | 486,506,880 | 95,659,200 |
| Size | 464.0 MB | 91.2 MB |
| Events in quadrant A | 4,786,661 | 604,775 |
| Events in quadrant B | 4,349,198 | 674,048 |
| Events in quadrant C | 4,156,688 | 590,138 |
| Events in quadrant D | 4,197,536 | 561,889 |
| Mode SS | |||
|---|---|---|---|
| Quadrant | BADHDUFLAG | Total packets | Discarded packets |
| A | 0 | 136 | 0 |
| B | 0 | 136 | 0 |
| C | 0 | 136 | 0 |
| D | 0 | 136 | 0 |
| Mode M0 | |||
|---|---|---|---|
| Quadrant | BADHDUFLAG | Total packets | Discarded packets |
| A | 0 | 18674 | 1 |
| B | 0 | 17467 | 1 |
| C | 0 | 17044 | 1 |
| D | 0 | 16984 | 1 |
| Mode M9 | |||
|---|---|---|---|
| Quadrant | BADHDUFLAG | Total packets | Discarded packets |
| A | 0 | 9 | 0 |
| B | 0 | 9 | 0 |
| C | 0 | 9 | 0 |
| D | 0 | 9 | 0 |
| Quadrant | Total seconds | Saturated seconds | Saturation percentage |
|---|---|---|---|
| A | 6677 | 465 | 6.964205% |
| B | 6678 | 301 | 4.507338% |
| C | 6678 | 391 | 5.855046% |
| D | 6677 | 307 | 4.597873% |
Noise dominated data is calculated using 1-second bins in cleaned event files. If a bin has >2000 counts, and if more than 50% of those come from <1% of pixels, then it is considered to be noise-dominated and hence unusable.
| Quadrant | # 1 sec bins | Bins with >0 counts | Bins with >2000 counts | High rate bins dominated by noise | Noise dominated (total time) | Noise dominated (detector-on time) | Marked lightcurve |
|---|---|---|---|---|---|---|---|
| A | 7592 | 6678 | 294 | 294 | 3.87% | 4.40% | 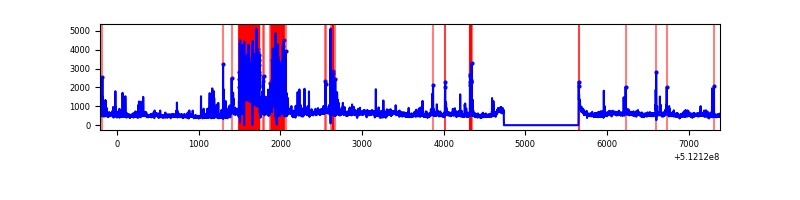 |
| B | 7593 | 6679 | 136 | 136 | 1.79% | 2.04% | 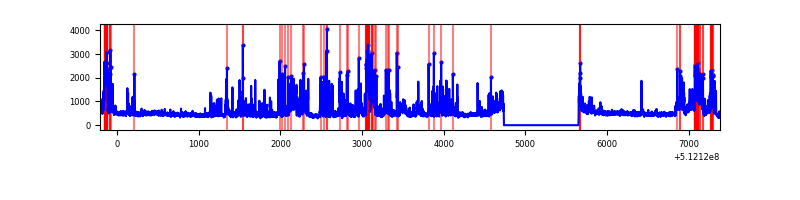 |
| C | 7593 | 6679 | 210 | 210 | 2.77% | 3.14% | 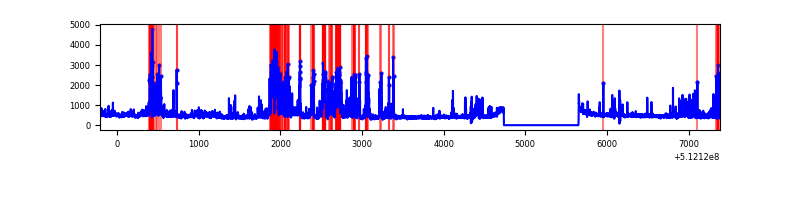 |
| D | 7592 | 6678 | 219 | 219 | 2.88% | 3.28% | 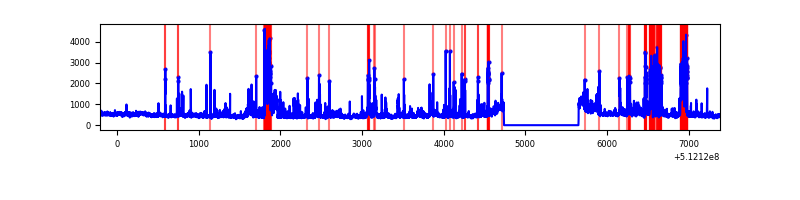 |
Top three noisy pixels from each quadrant. If the there are fewer than three noisy pixels in the level2.evt file, extra rows are filled as -1
| Pixel properties | Quadrant properties | ||||||
|---|---|---|---|---|---|---|---|
| Quadrant | DetID | PixID | Counts | Sigma | Mean | Median | Sigma |
| A | 3 | 14 | 867822 | 4978.15 | 707 | 689 | 174.2 |
| A | 3 | 62 | 858038 | 4921.98 | 707 | 689 | 174.2 |
| A | 10 | 251 | 265624 | 1520.97 | 707 | 689 | 174.2 |
| B | 4 | 206 | 992057 | 6507.71 | 709 | 681 | 152.3 |
| B | 5 | 185 | 164158 | 1073.11 | 709 | 681 | 152.3 |
| B | 8 | 128 | 158543 | 1036.25 | 709 | 681 | 152.3 |
| C | 15 | 230 | 827540 | 4261.09 | 699 | 693 | 194.0 |
| C | 9 | 38 | 181287 | 930.68 | 699 | 693 | 194.0 |
| C | 13 | 3 | 83447 | 426.47 | 699 | 693 | 194.0 |
| D | 5 | 113 | 467202 | 2361.41 | 703 | 672 | 197.6 |
| D | 11 | 246 | 296846 | 1499.13 | 703 | 672 | 197.6 |
| D | 7 | 238 | 165487 | 834.24 | 703 | 672 | 197.6 |
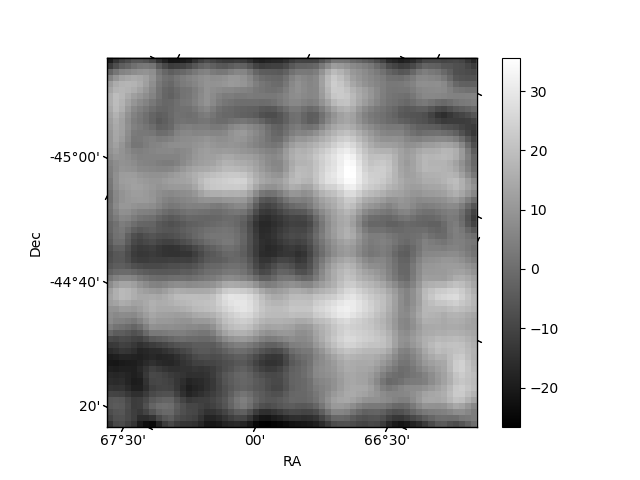
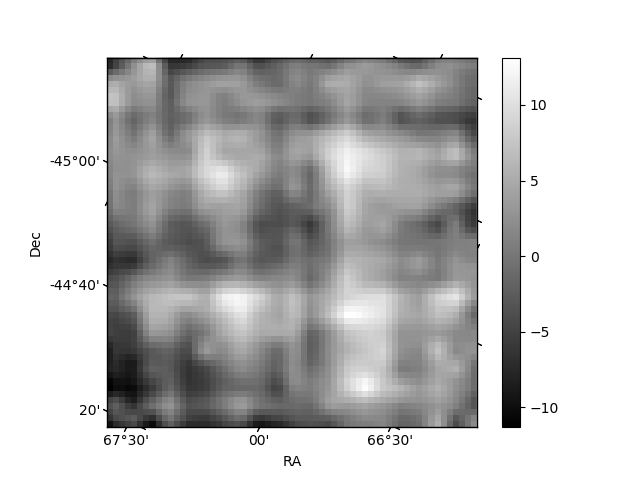
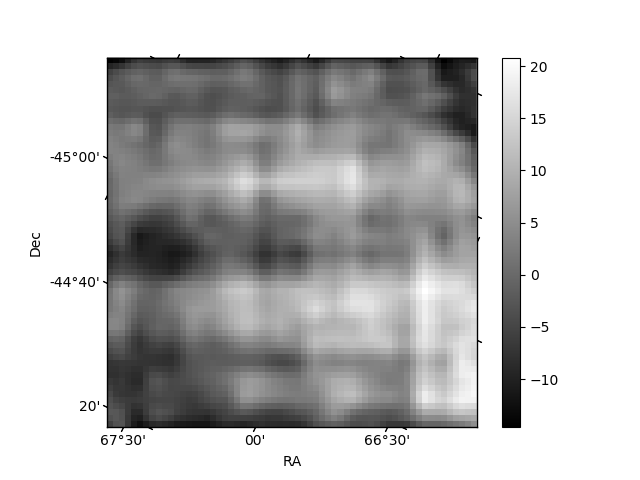
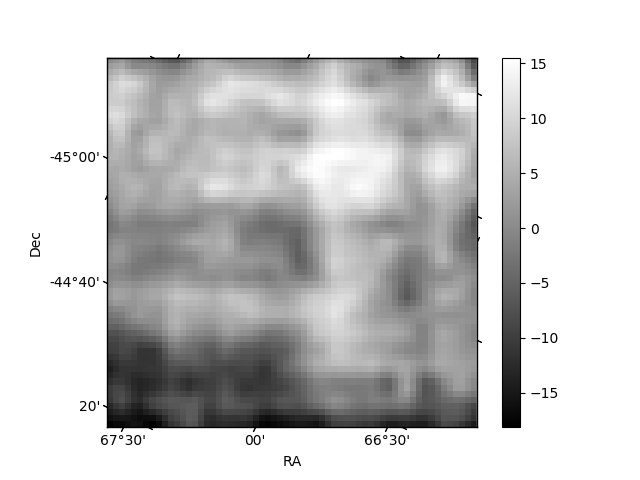
Histogram calculated using DETX and DETY for each event in the final _common_clean file
| Quadrant A | 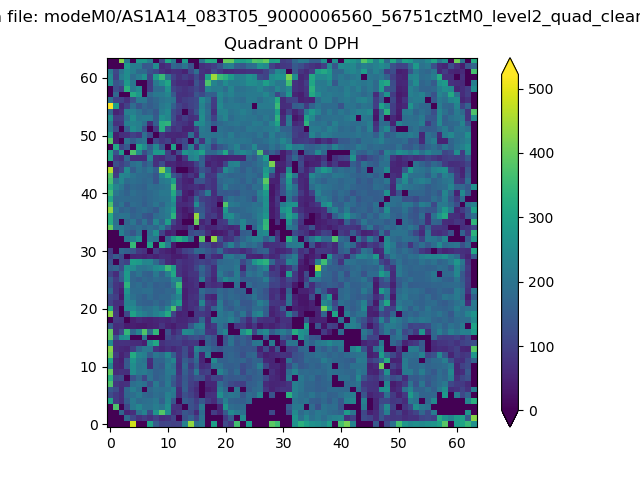 |
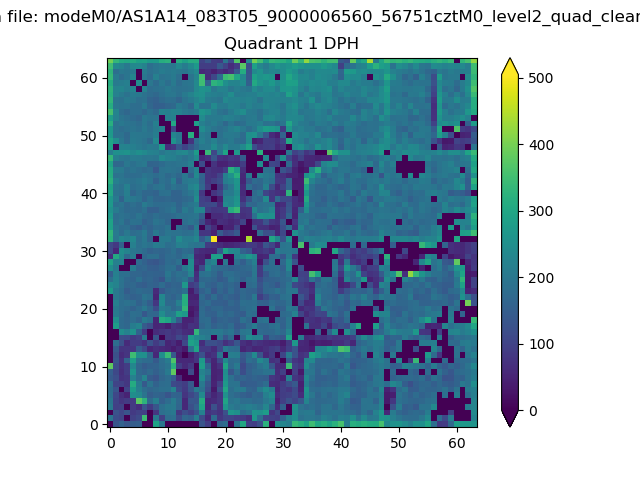 |
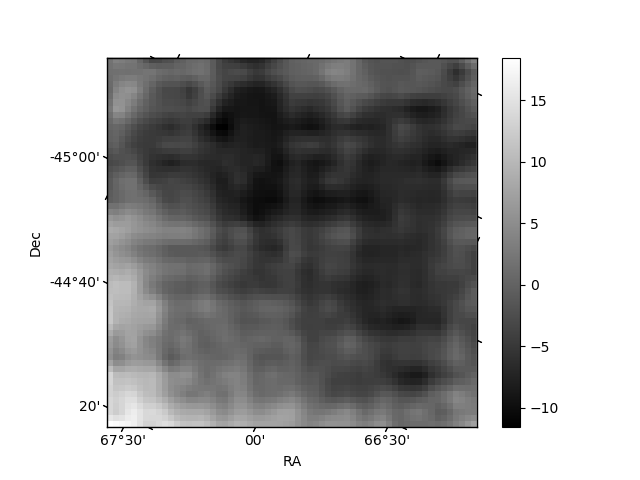
Quadrant B |
|---|---|---|---|
| Quadrant D | 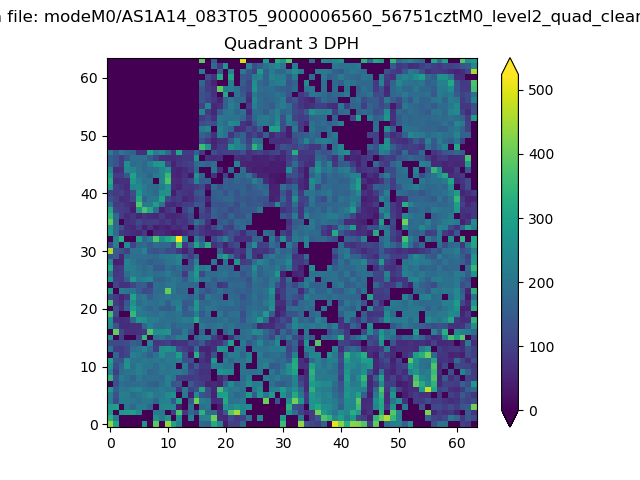 |
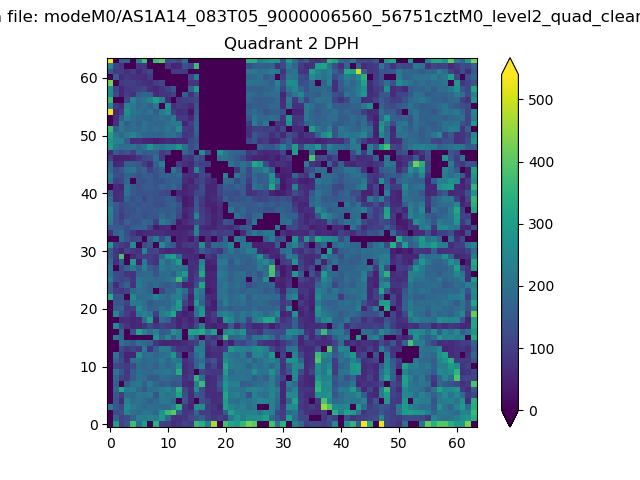 |
Quadrant C |
| Plot type | Count rate plots | Images |
|---|---|---|
| Comparison with Poisson distribution Blue bars denote a histogram of data divided into 1 sec bins. Red curve is a Poisson curve with rate = median count rate of data. |
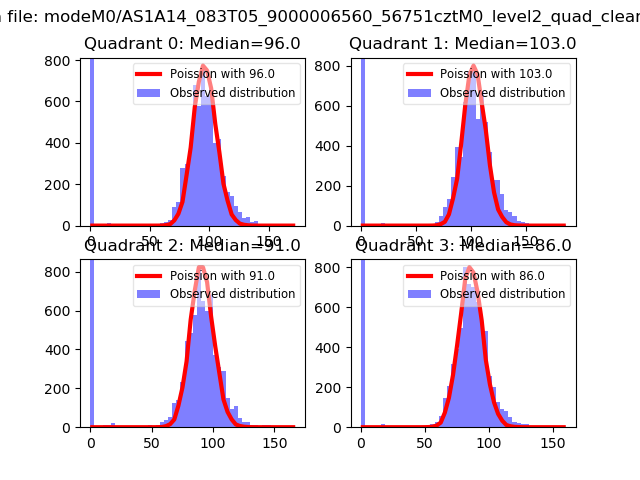 |
 |
| Quadrant-wise count rates Data is divided into 100 sec bins |
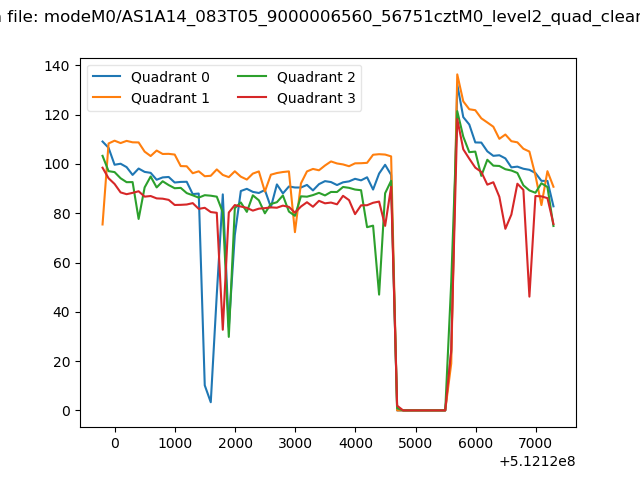 |
|
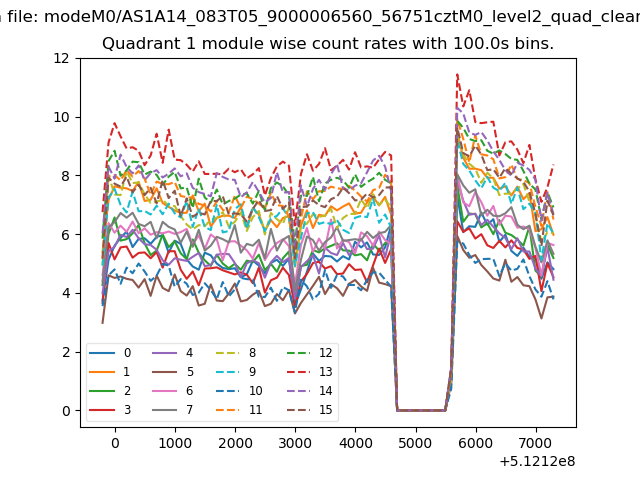
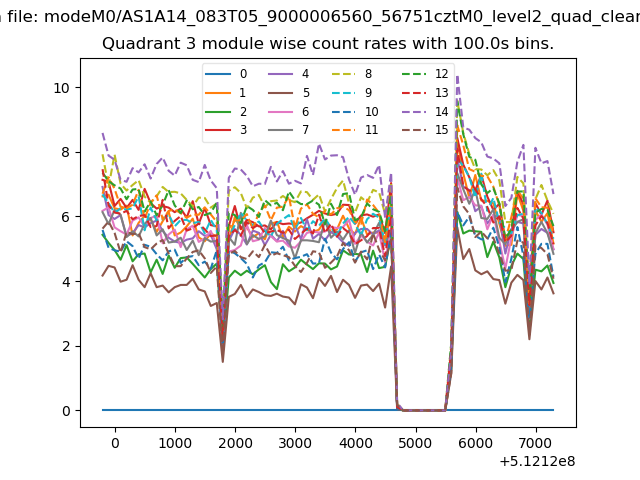
| Module-wise count rates for Quadrant A Data is divided into 100 sec bins |
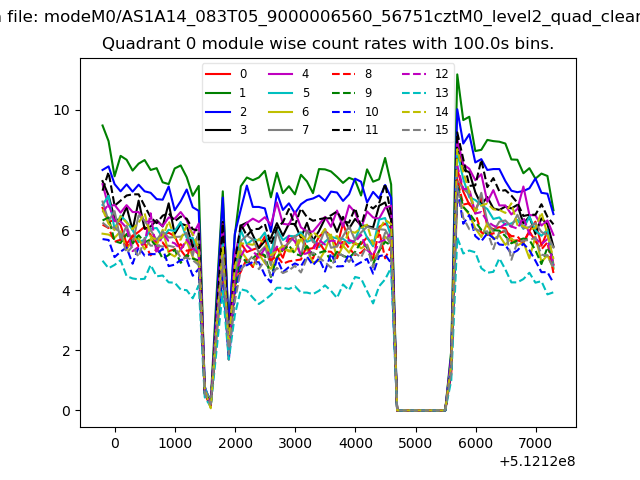 |
 |
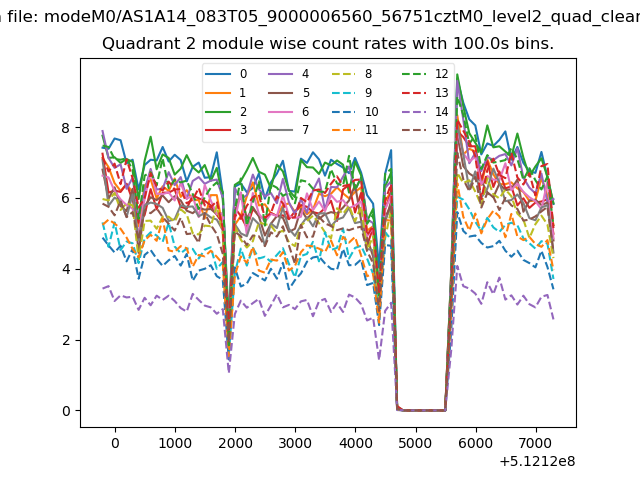
| Module-wise count rates for Quadrant B Data is divided into 100 sec bins |
 |
 |
| Module-wise count rates for Quadrant C Data is divided into 100 sec bins |
 |
 |
| Module-wise count rates for Quadrant D Data is divided into 100 sec bins |
 |
 |
| Parameter | Plot |
|---|---|
| CZT HV Monitor | 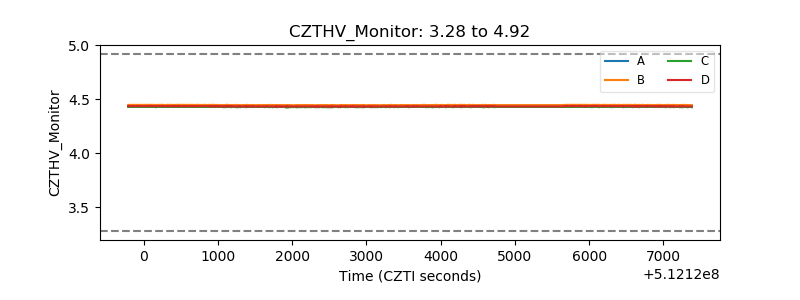 |
| D_VDD | 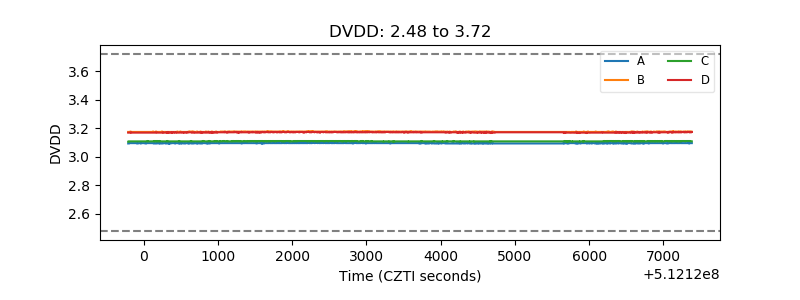 |
| Temperature 1 | 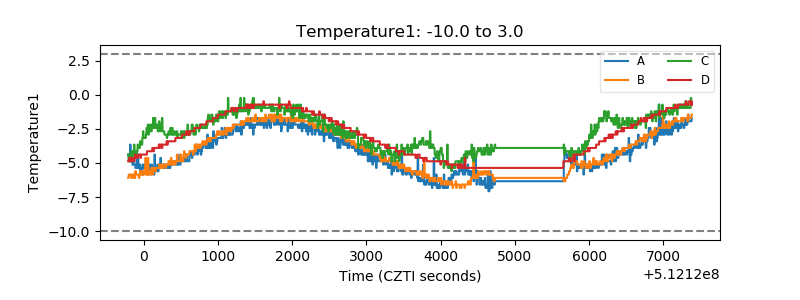 |
| Veto HV Monitor | 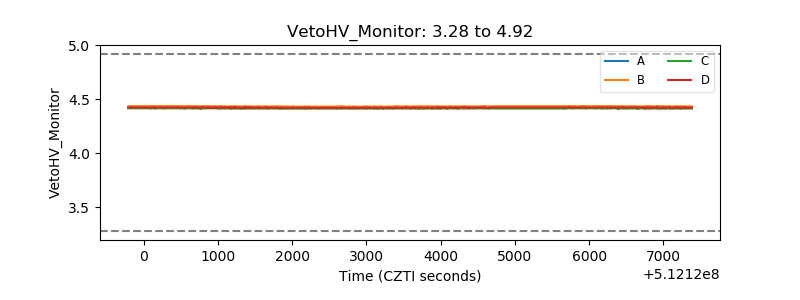 |
| Veto LLD | 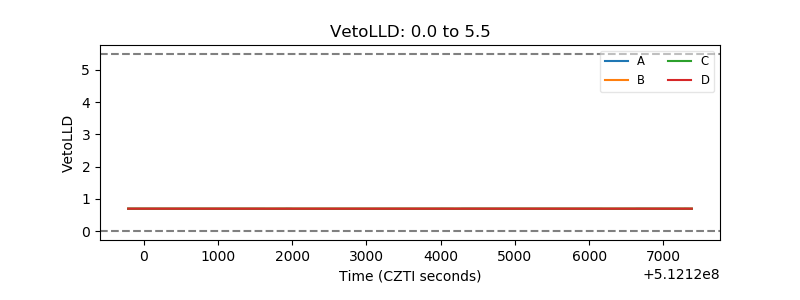 |
| Alpha Counter | 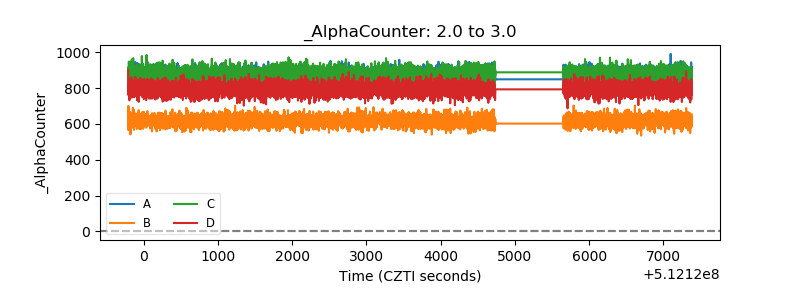 |
| _CPM_Rate | 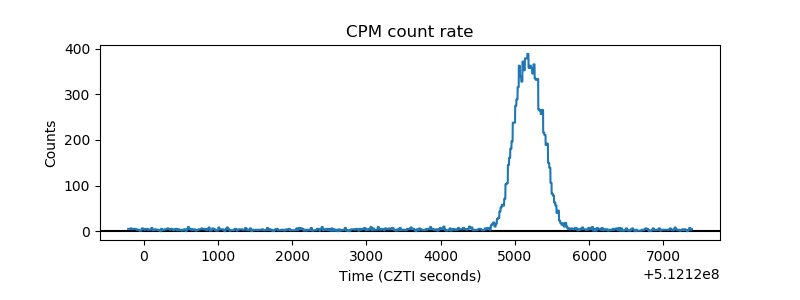 |
| CZT Counter | 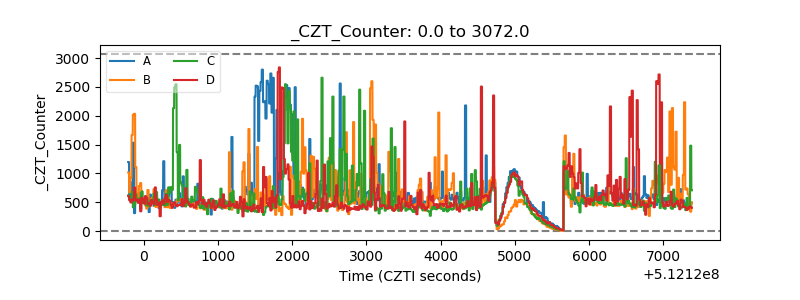 |
| +2.5 Volts monitor |  |
| +5 Volts monitor |  |
| _ROLL_ROT | 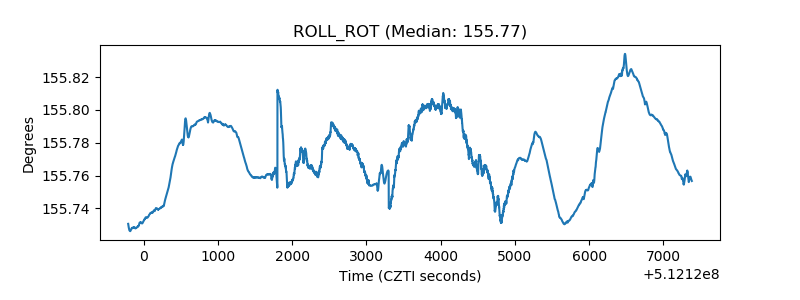 |
| _Roll_DEC | 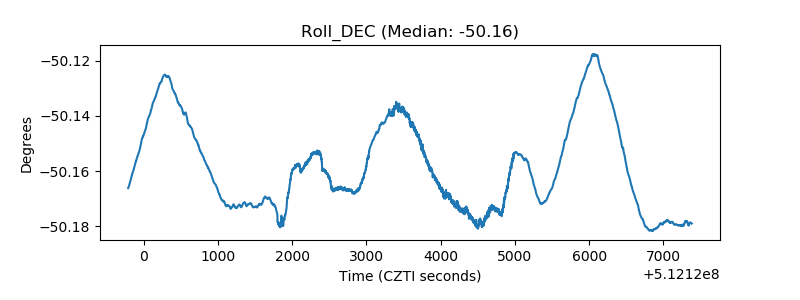 |
| _Roll_RA | 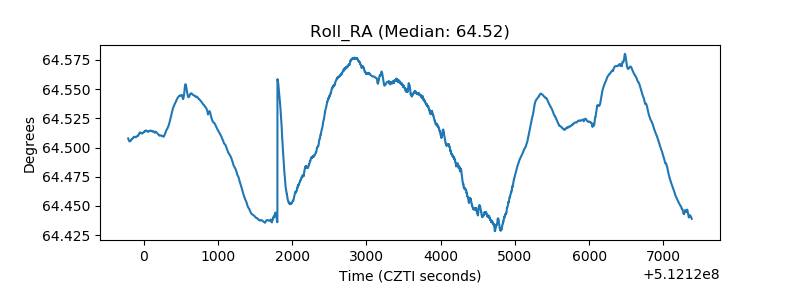 |
| Veto Counter | 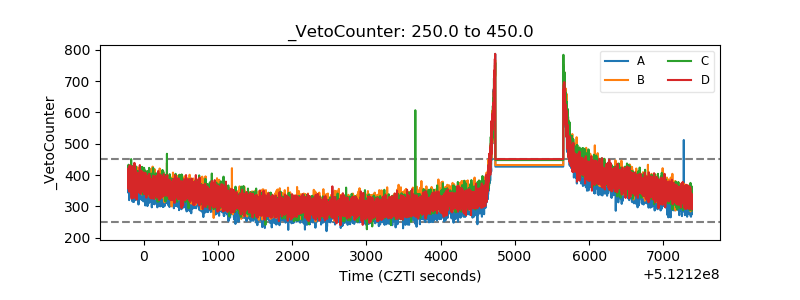 |