| Param | Original file | Final file |
|---|---|---|
| Filename | modeM0/AS1A14_083T05_9000006560_56752cztM0_level2.fits | modeM0/AS1A14_083T05_9000006560_56752cztM0_level2_quad_clean.evt |
| Size (bytes) | 547,248,960 | 91,592,640 |
| Size | 521.9 MB | 87.3 MB |
| Events in quadrant A | 4,354,381 | 612,902 |
| Events in quadrant B | 6,416,946 | 602,616 |
| Events in quadrant C | 4,991,863 | 554,266 |
| Events in quadrant D | 3,989,999 | 550,926 |
| Mode SS | |||
|---|---|---|---|
| Quadrant | BADHDUFLAG | Total packets | Discarded packets |
| A | 0 | 132 | 0 |
| B | 0 | 132 | 0 |
| C | 0 | 132 | 0 |
| D | 0 | 132 | 0 |
| Mode M0 | |||
|---|---|---|---|
| Quadrant | BADHDUFLAG | Total packets | Discarded packets |
| A | 0 | 17292 | 1 |
| B | 0 | 23526 | 1 |
| C | 0 | 19522 | 1 |
| D | 0 | 16287 | 1 |
| Mode M9 | |||
|---|---|---|---|
| Quadrant | BADHDUFLAG | Total packets | Discarded packets |
| A | 0 | 10 | 0 |
| B | 0 | 10 | 0 |
| C | 0 | 10 | 0 |
| D | 0 | 10 | 0 |
| Quadrant | Total seconds | Saturated seconds | Saturation percentage |
|---|---|---|---|
| A | 6490 | 316 | 4.869029% |
| B | 6490 | 1074 | 16.548536% |
| C | 6491 | 682 | 10.506856% |
| D | 6491 | 343 | 5.284240% |
Noise dominated data is calculated using 1-second bins in cleaned event files. If a bin has >2000 counts, and if more than 50% of those come from <1% of pixels, then it is considered to be noise-dominated and hence unusable.
| Quadrant | # 1 sec bins | Bins with >0 counts | Bins with >2000 counts | High rate bins dominated by noise | Noise dominated (total time) | Noise dominated (detector-on time) | Marked lightcurve |
|---|---|---|---|---|---|---|---|
| A | 7535 | 6491 | 188 | 188 | 2.50% | 2.90% | 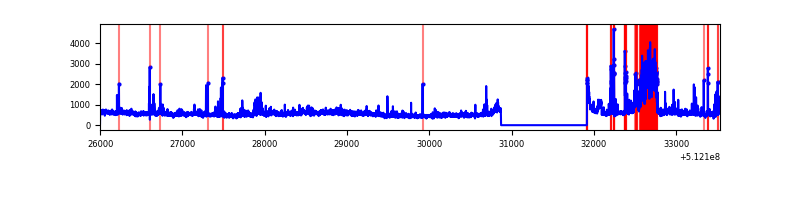 |
| B | 7535 | 6491 | 806 | 806 | 10.70% | 12.42% | 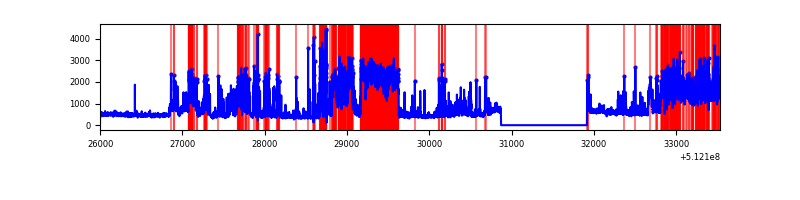 |
| C | 7536 | 6492 | 522 | 522 | 6.93% | 8.04% | 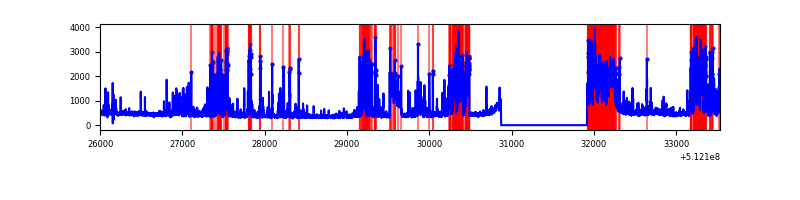 |
| D | 7536 | 6492 | 240 | 240 | 3.18% | 3.70% | 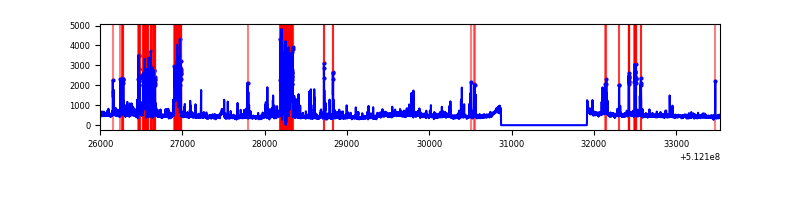 |
Top three noisy pixels from each quadrant. If the there are fewer than three noisy pixels in the level2.evt file, extra rows are filled as -1
| Pixel properties | Quadrant properties | ||||||
|---|---|---|---|---|---|---|---|
| Quadrant | DetID | PixID | Counts | Sigma | Mean | Median | Sigma |
| A | 3 | 14 | 851738 | 4927.1 | 701 | 684 | 172.7 |
| A | 3 | 62 | 621366 | 3593.38 | 701 | 684 | 172.7 |
| A | 10 | 251 | 121429 | 699.04 | 701 | 684 | 172.7 |
| B | 4 | 206 | 3339901 | 23091.45 | 669 | 645 | 144.6 |
| B | 5 | 185 | 190706 | 1314.3 | 669 | 645 | 144.6 |
| B | 0 | 63 | 48095 | 328.12 | 669 | 645 | 144.6 |
| C | 15 | 230 | 1667400 | 9075.93 | 666 | 660 | 183.6 |
| C | 15 | 215 | 216332 | 1174.4 | 666 | 660 | 183.6 |
| C | 6 | 223 | 88186 | 476.61 | 666 | 660 | 183.6 |
| D | 2 | 249 | 473583 | 2409.81 | 683 | 651 | 196.3 |
| D | 5 | 113 | 316285 | 1608.31 | 683 | 651 | 196.3 |
| D | 7 | 238 | 168877 | 857.19 | 683 | 651 | 196.3 |
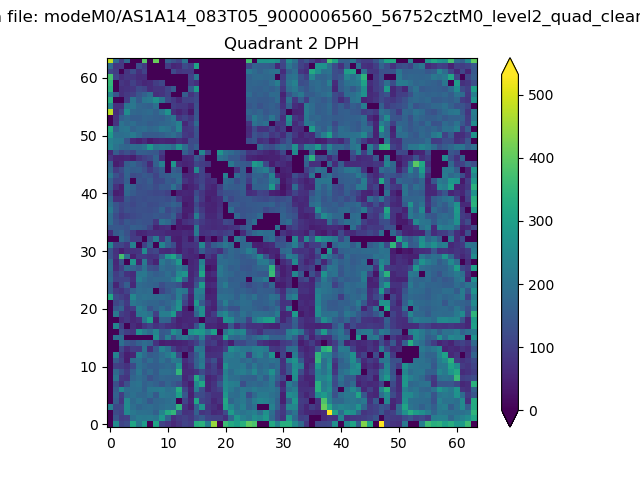
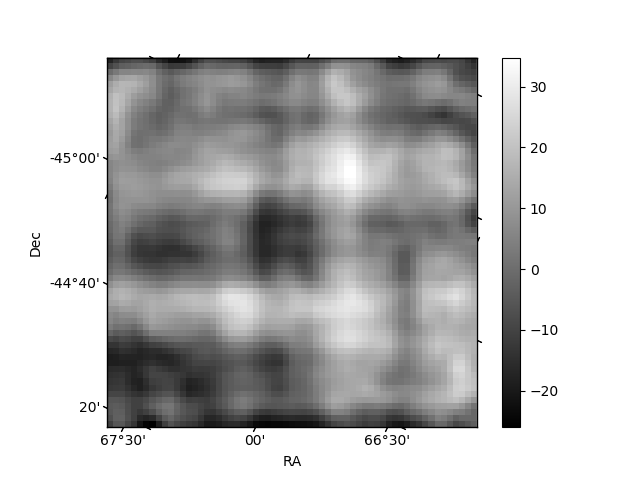
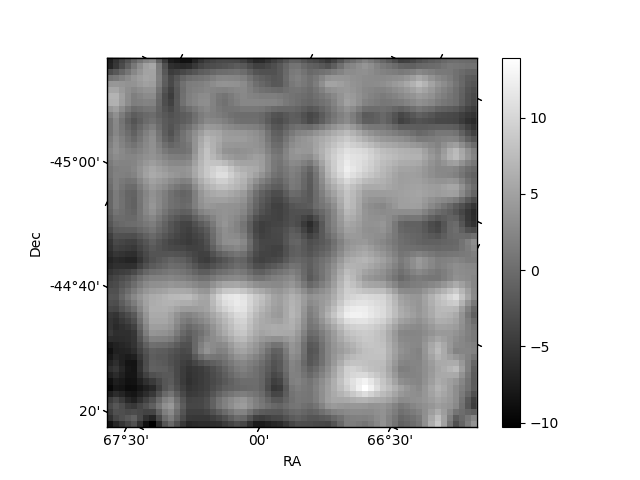
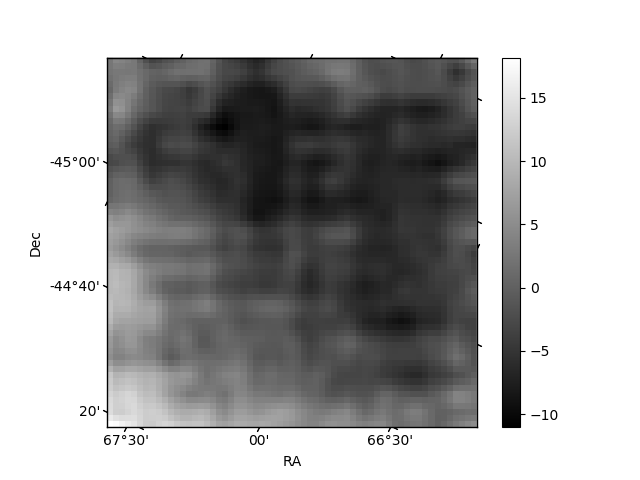
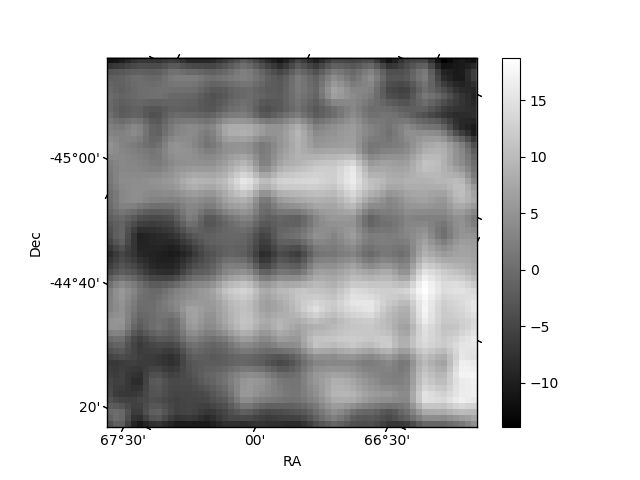
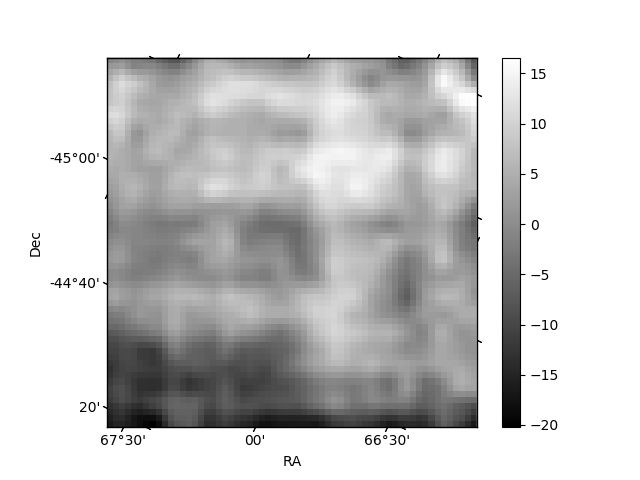
Histogram calculated using DETX and DETY for each event in the final _common_clean file
| Quadrant A | 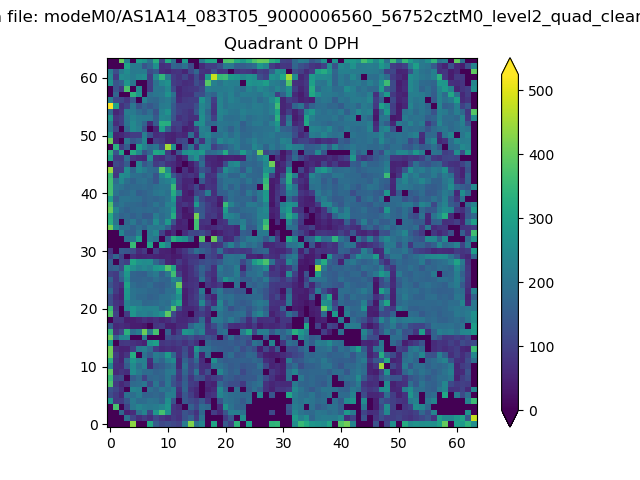 |
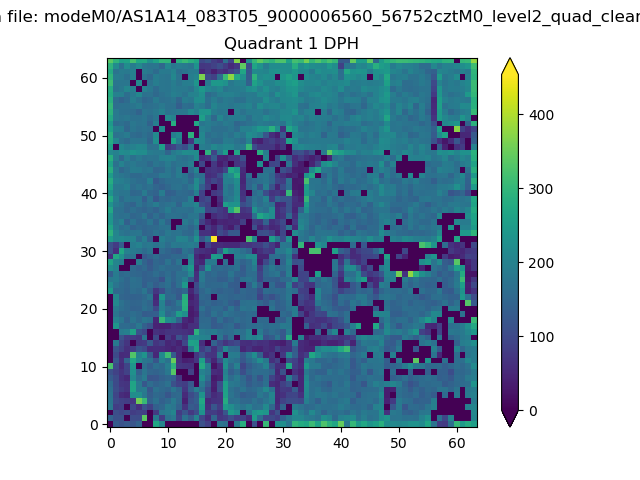 |
Quadrant B |
|---|---|---|---|
| Quadrant D | 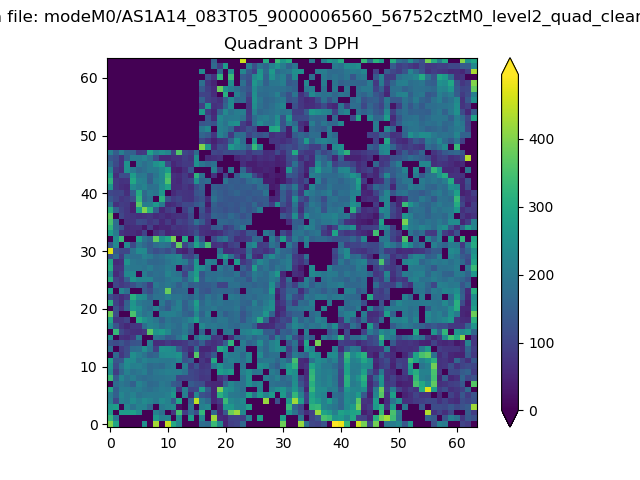 |
 |
Quadrant C |
| Plot type | Count rate plots | Images |
|---|---|---|
| Comparison with Poisson distribution Blue bars denote a histogram of data divided into 1 sec bins. Red curve is a Poisson curve with rate = median count rate of data. |
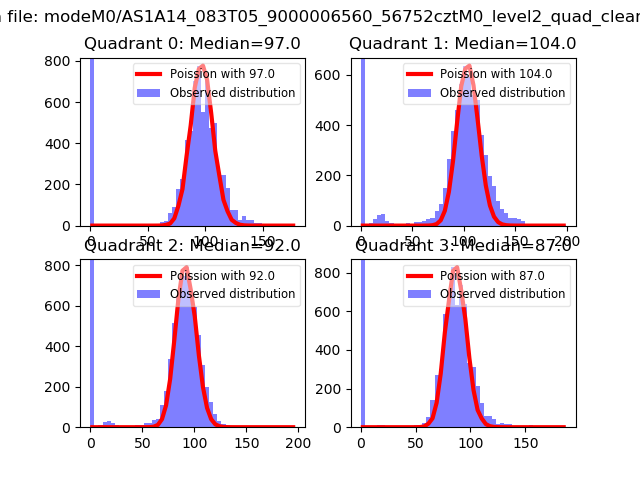 |
 |
| Quadrant-wise count rates Data is divided into 100 sec bins |
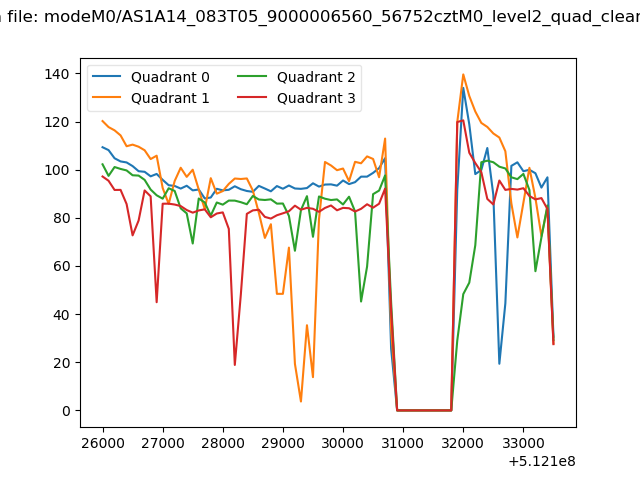 |
|
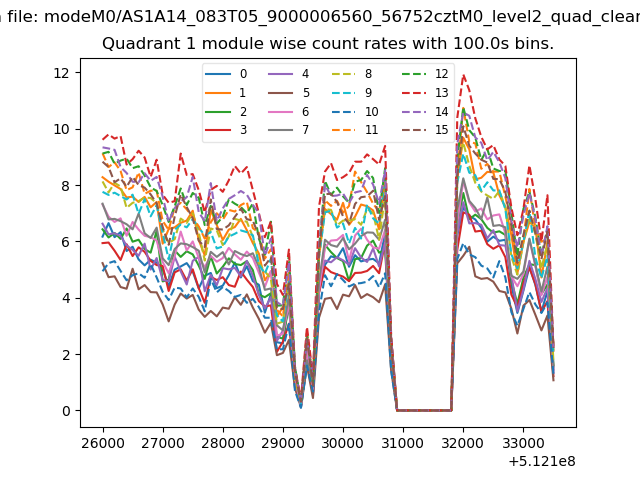
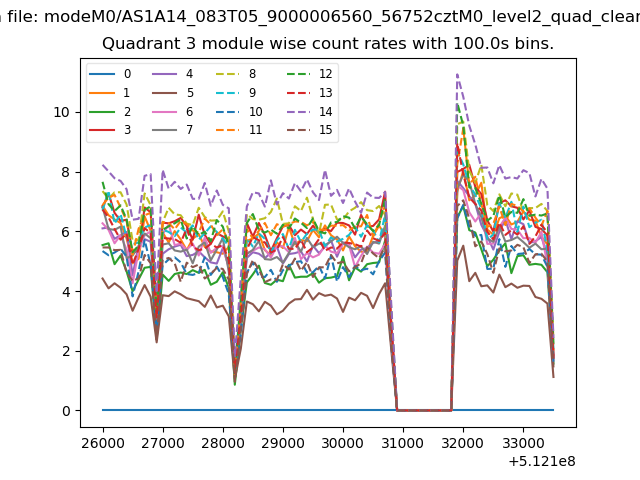
| Module-wise count rates for Quadrant A Data is divided into 100 sec bins |
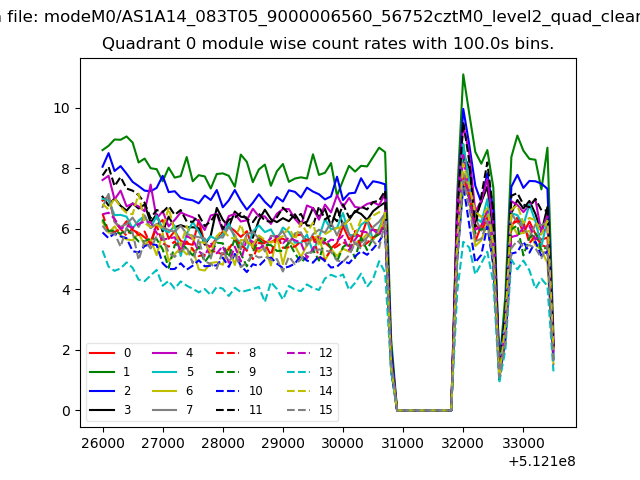 |
 |
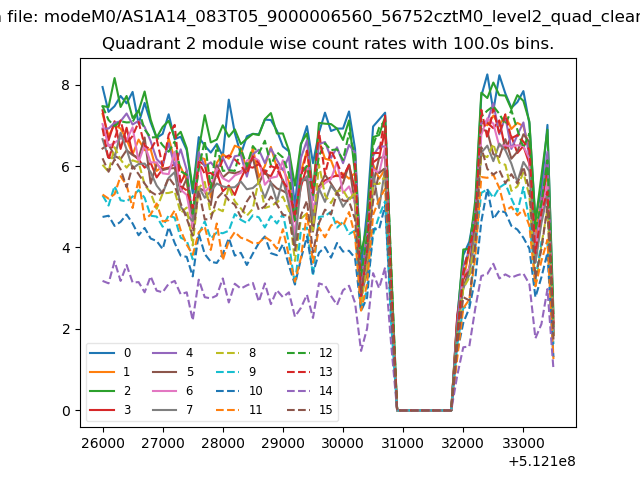
| Module-wise count rates for Quadrant B Data is divided into 100 sec bins |
 |
 |
| Module-wise count rates for Quadrant C Data is divided into 100 sec bins |
 |
 |
| Module-wise count rates for Quadrant D Data is divided into 100 sec bins |
 |
 |
| Parameter | Plot |
|---|---|
| CZT HV Monitor | 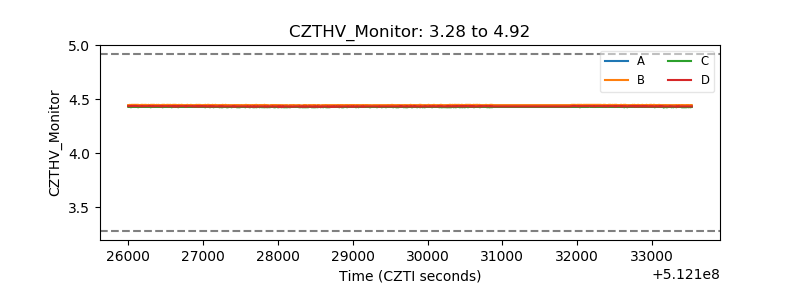 |
| D_VDD | 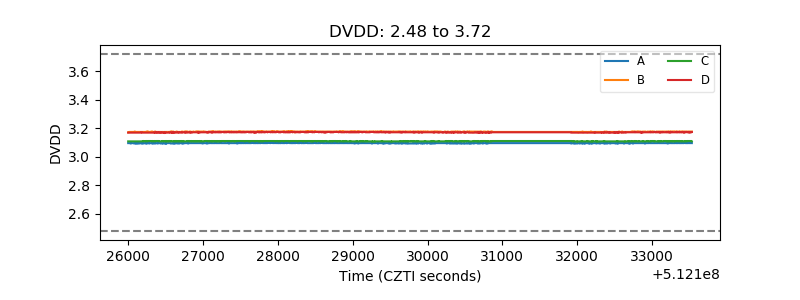 |
| Temperature 1 | 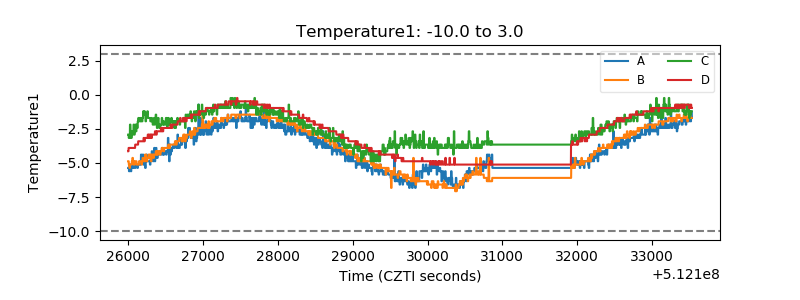 |
| Veto HV Monitor | 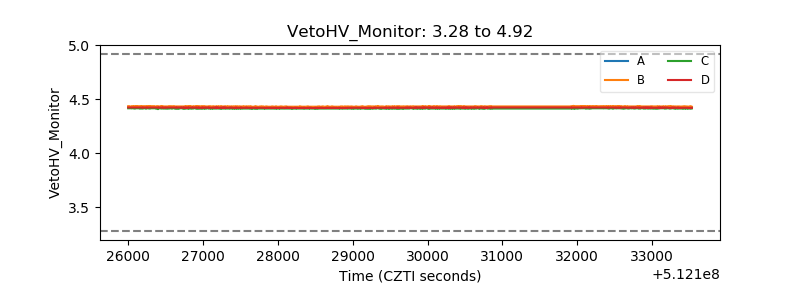 |
| Veto LLD | 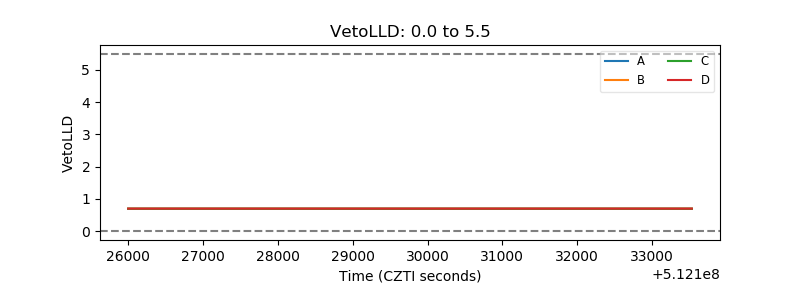 |
| Alpha Counter | 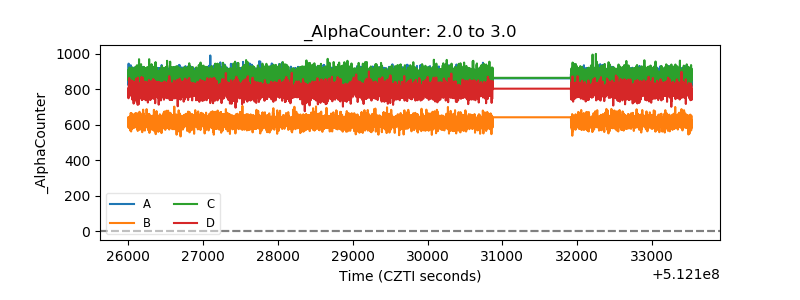 |
| _CPM_Rate | 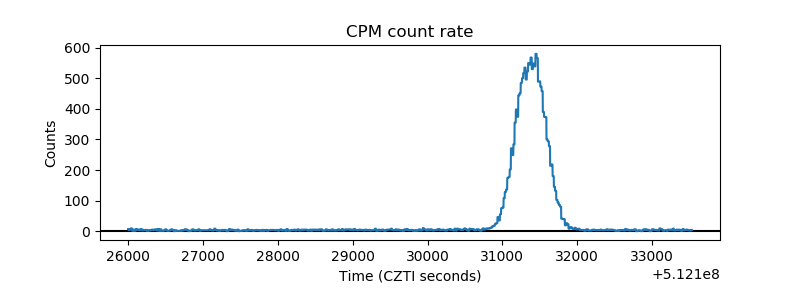 |
| CZT Counter | 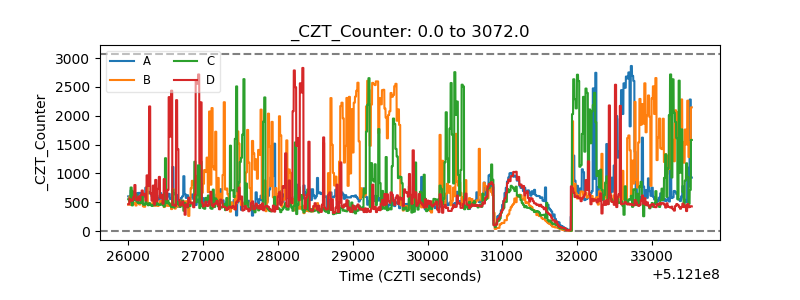 |
| +2.5 Volts monitor |  |
| +5 Volts monitor |  |
| _ROLL_ROT | 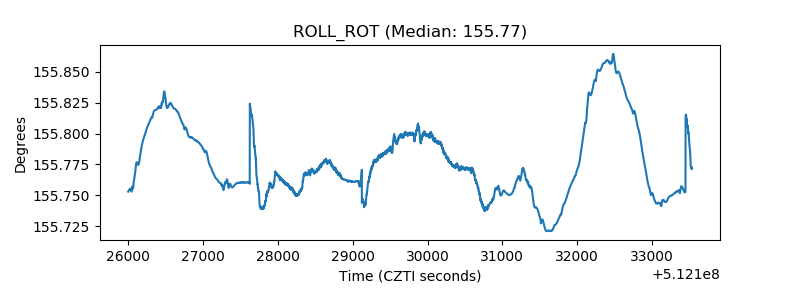 |
| _Roll_DEC | 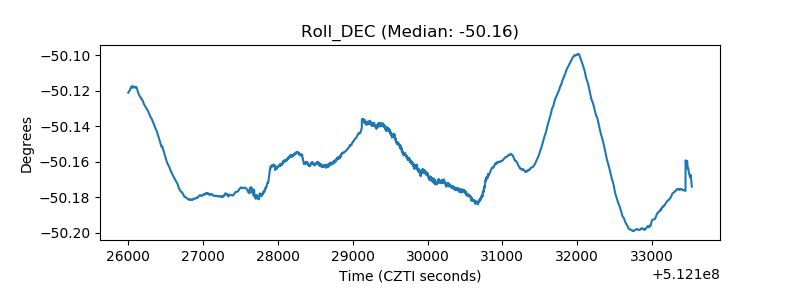 |
| _Roll_RA | 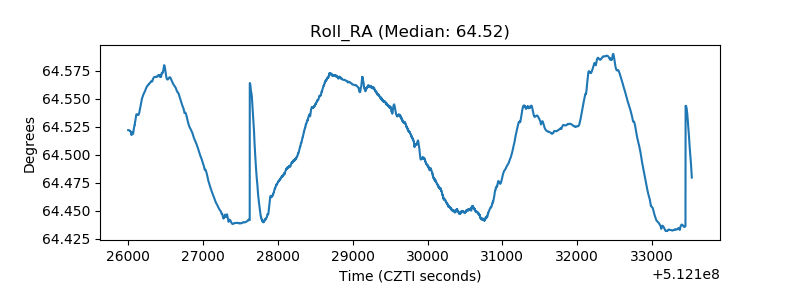 |
| Veto Counter | 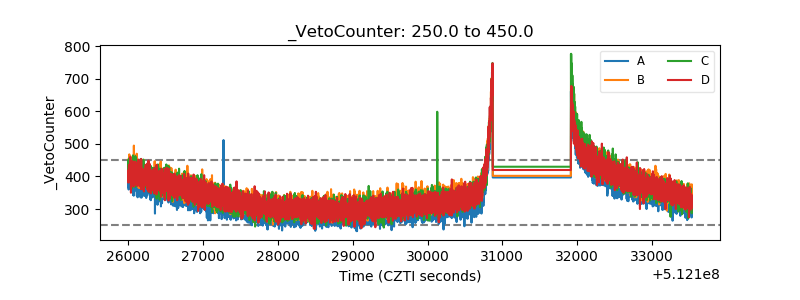 |