| Param | Original file | Final file |
|---|---|---|
| Filename | modeM0/AS1A14_083T05_9000006560_56753cztM0_level2.fits | modeM0/AS1A14_083T05_9000006560_56753cztM0_level2_quad_clean.evt |
| Size (bytes) | 865,601,280 | 153,141,120 |
| Size | 825.5 MB | 146.0 MB |
| Events in quadrant A | 7,475,665 | 1,013,511 |
| Events in quadrant B | 10,102,430 | 1,017,791 |
| Events in quadrant C | 7,722,702 | 929,155 |
| Events in quadrant D | 5,898,338 | 923,066 |
| Mode SS | |||
|---|---|---|---|
| Quadrant | BADHDUFLAG | Total packets | Discarded packets |
| A | 0 | 222 | 0 |
| B | 0 | 222 | 0 |
| C | 0 | 222 | 0 |
| D | 0 | 222 | 0 |
| Mode M0 | |||
|---|---|---|---|
| Quadrant | BADHDUFLAG | Total packets | Discarded packets |
| A | 0 | 29377 | 2 |
| B | 0 | 37558 | 2 |
| C | 0 | 30964 | 2 |
| D | 0 | 25152 | 2 |
| Mode M9 | |||
|---|---|---|---|
| Quadrant | BADHDUFLAG | Total packets | Discarded packets |
| A | 0 | 21 | 0 |
| B | 0 | 21 | 0 |
| C | 0 | 21 | 0 |
| D | 0 | 21 | 0 |
| Quadrant | Total seconds | Saturated seconds | Saturation percentage |
|---|---|---|---|
| A | 10877 | 588 | 5.405902% |
| B | 10878 | 1467 | 13.485935% |
| C | 10878 | 951 | 8.742416% |
| D | 10878 | 345 | 3.171539% |
Noise dominated data is calculated using 1-second bins in cleaned event files. If a bin has >2000 counts, and if more than 50% of those come from <1% of pixels, then it is considered to be noise-dominated and hence unusable.
| Quadrant | # 1 sec bins | Bins with >0 counts | Bins with >2000 counts | High rate bins dominated by noise | Noise dominated (total time) | Noise dominated (detector-on time) | Marked lightcurve |
|---|---|---|---|---|---|---|---|
| A | 13042 | 10879 | 371 | 371 | 2.84% | 3.41% | 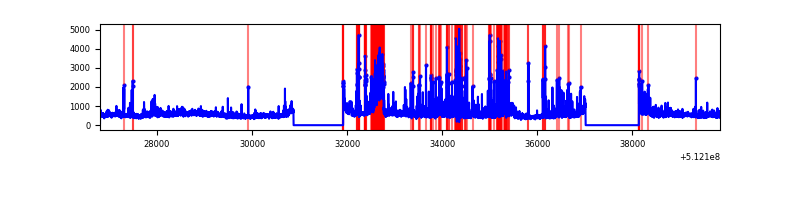 |
| B | 13043 | 10880 | 974 | 974 | 7.47% | 8.95% | 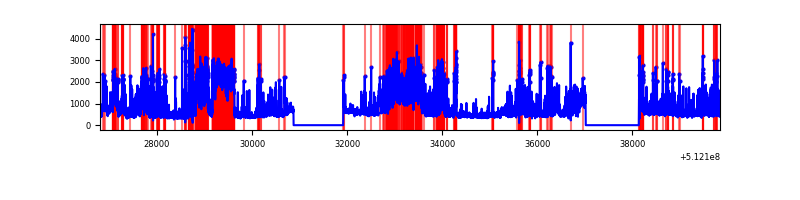 |
| C | 13043 | 10880 | 726 | 726 | 5.57% | 6.67% | 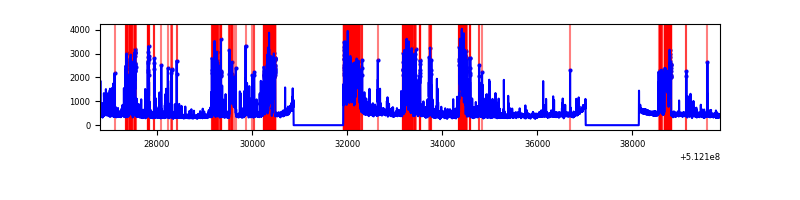 |
| D | 13043 | 10880 | 203 | 203 | 1.56% | 1.87% | 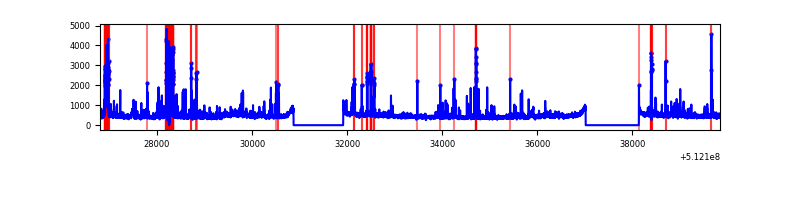 |
Top three noisy pixels from each quadrant. If the there are fewer than three noisy pixels in the level2.evt file, extra rows are filled as -1
| Pixel properties | Quadrant properties | ||||||
|---|---|---|---|---|---|---|---|
| Quadrant | DetID | PixID | Counts | Sigma | Mean | Median | Sigma |
| A | 3 | 62 | 1228733 | 4336.71 | 1154 | 1125 | 283.1 |
| A | 3 | 14 | 1155005 | 4076.26 | 1154 | 1125 | 283.1 |
| A | 10 | 251 | 278628 | 980.32 | 1154 | 1125 | 283.1 |
| B | 4 | 206 | 4067475 | 17170.82 | 1113 | 1074 | 236.8 |
| B | 5 | 185 | 1090930 | 4602.03 | 1113 | 1074 | 236.8 |
| B | 8 | 128 | 120220 | 503.11 | 1113 | 1074 | 236.8 |
| C | 15 | 230 | 2225347 | 7413.63 | 1098 | 1092 | 300.0 |
| C | 15 | 215 | 508884 | 1692.51 | 1098 | 1092 | 300.0 |
| C | 9 | 38 | 158422 | 524.39 | 1098 | 1092 | 300.0 |
| D | 2 | 249 | 509450 | 1577.59 | 1128 | 1073 | 322.2 |
| D | 7 | 238 | 198341 | 612.16 | 1128 | 1073 | 322.2 |
| D | 8 | 129 | 164991 | 508.67 | 1128 | 1073 | 322.2 |
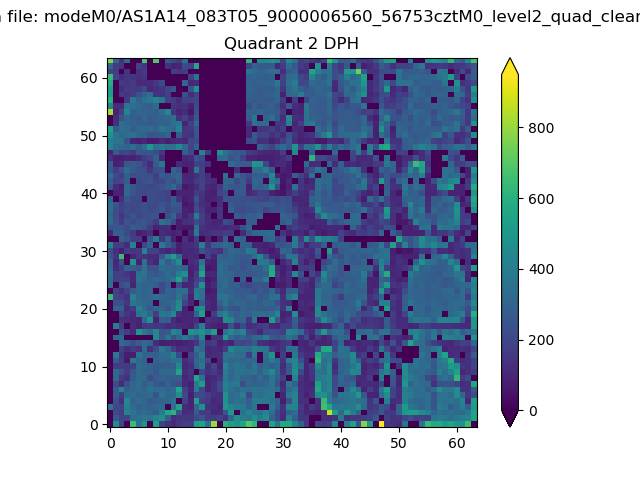
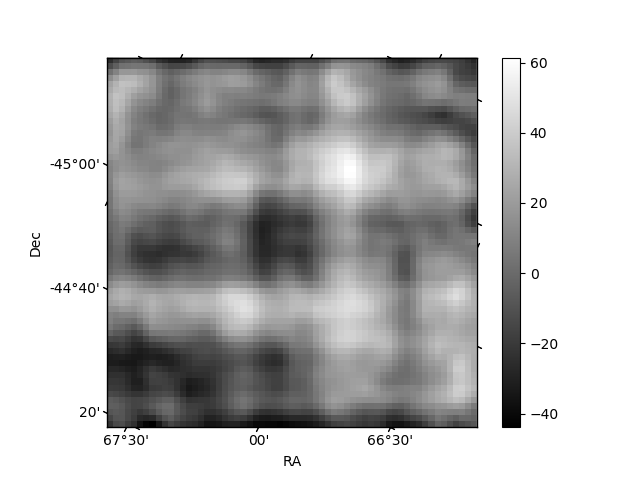
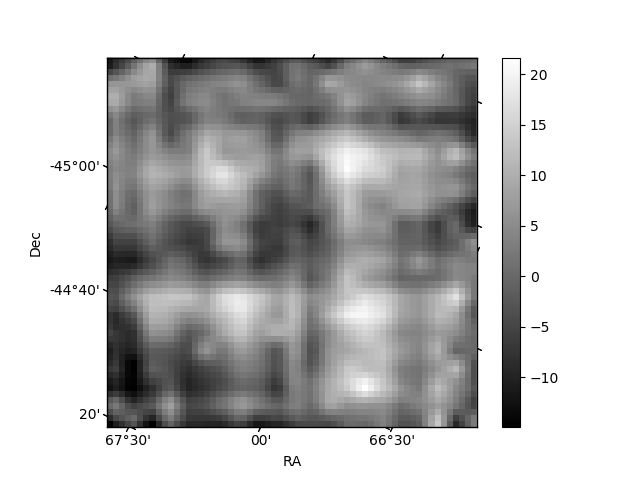
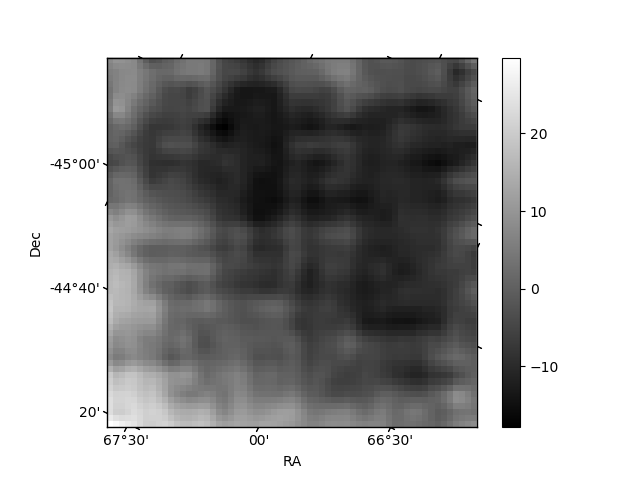
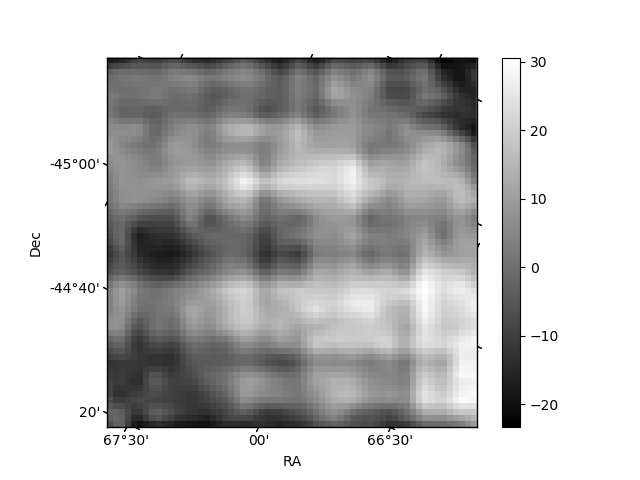
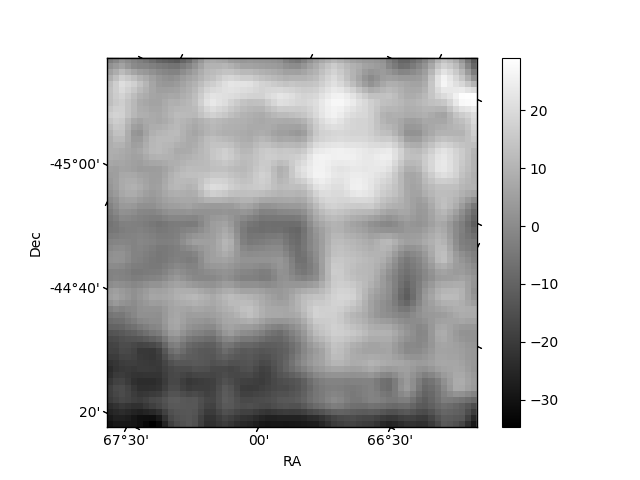
Histogram calculated using DETX and DETY for each event in the final _common_clean file
| Quadrant A | 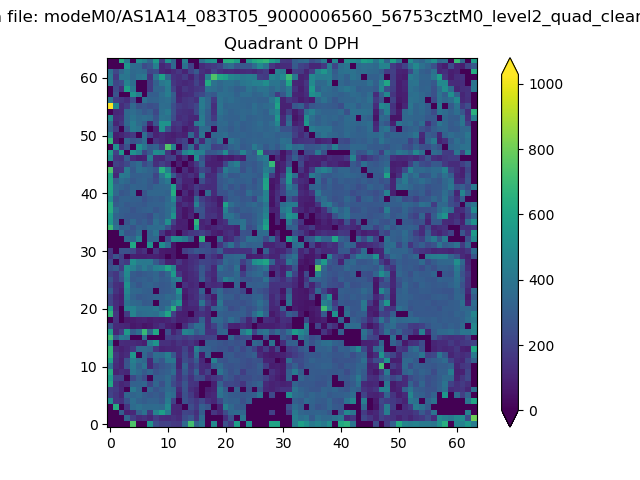 |
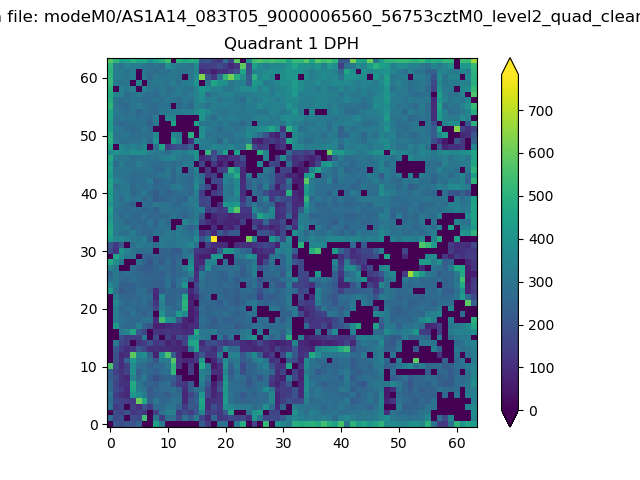 |
Quadrant B |
|---|---|---|---|
| Quadrant D | 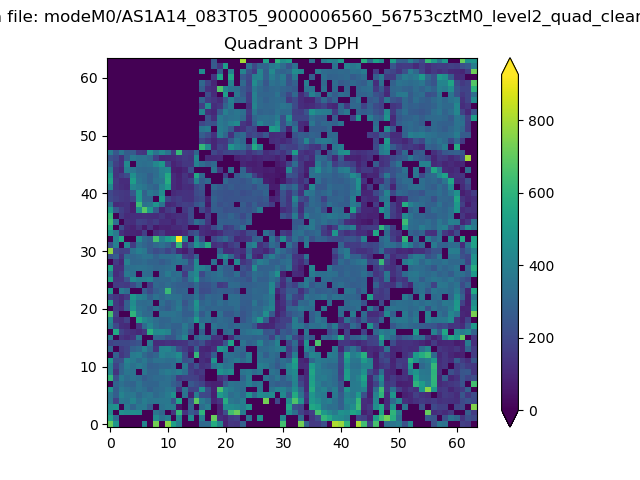 |
 |
Quadrant C |
| Plot type | Count rate plots | Images |
|---|---|---|
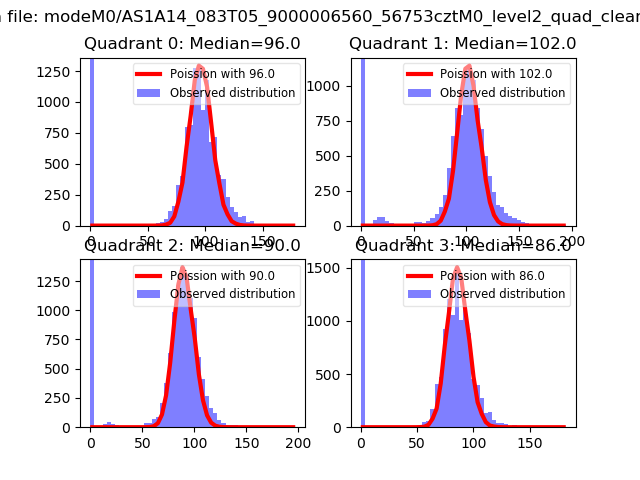
| Comparison with Poisson distribution Blue bars denote a histogram of data divided into 1 sec bins. Red curve is a Poisson curve with rate = median count rate of data. |
 |
 |
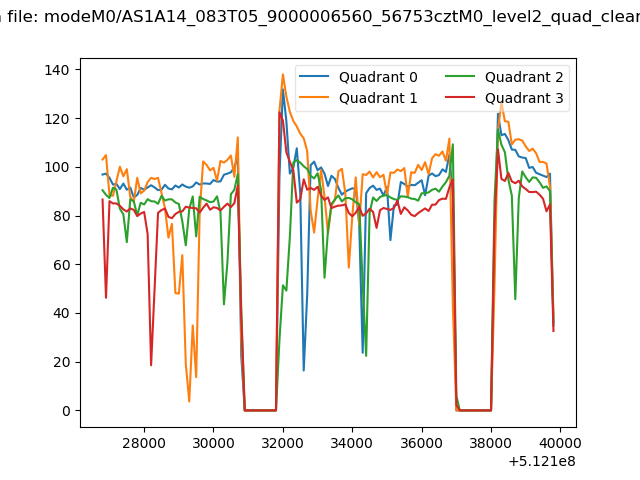
| Quadrant-wise count rates Data is divided into 100 sec bins |
 |
|
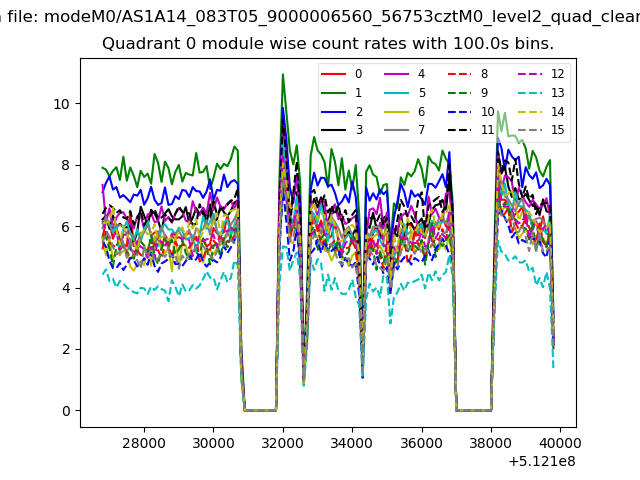
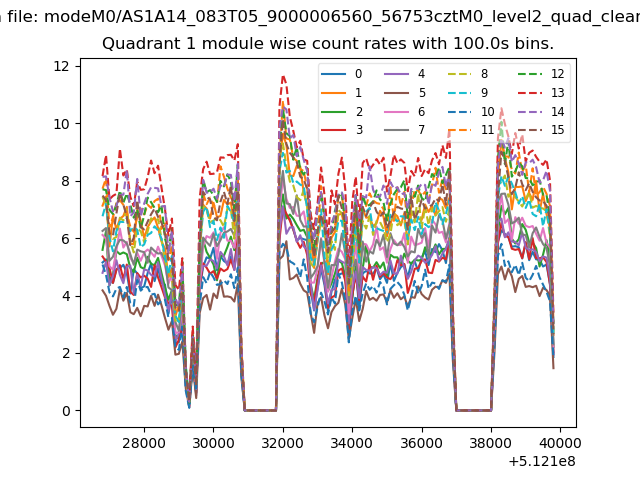
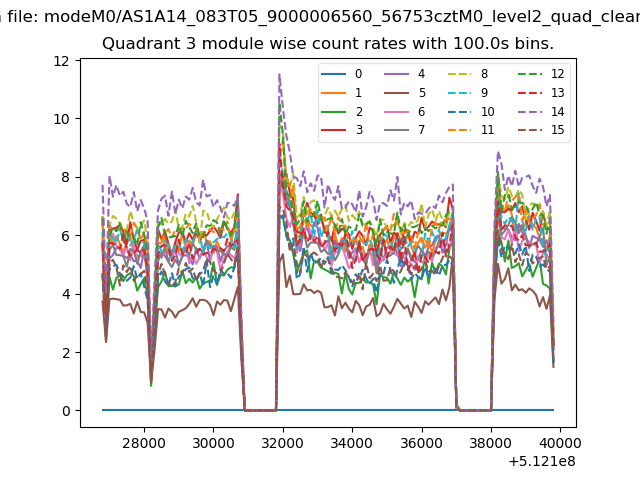
| Module-wise count rates for Quadrant A Data is divided into 100 sec bins |
 |
 |
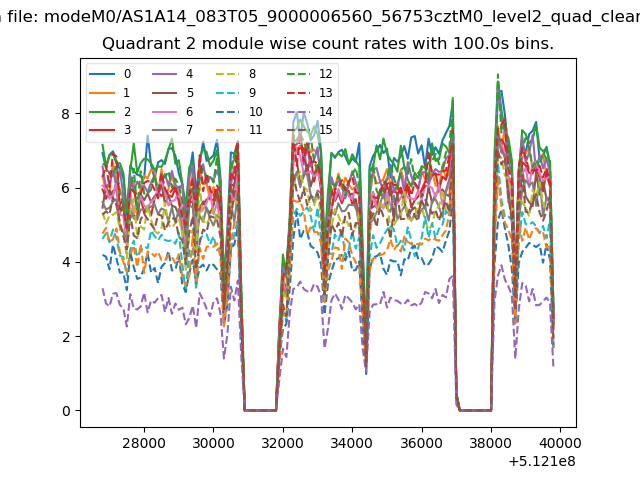
| Module-wise count rates for Quadrant B Data is divided into 100 sec bins |
 |
 |
| Module-wise count rates for Quadrant C Data is divided into 100 sec bins |
 |
 |
| Module-wise count rates for Quadrant D Data is divided into 100 sec bins |
 |
 |
| Parameter | Plot |
|---|---|
| CZT HV Monitor |  |
| D_VDD | 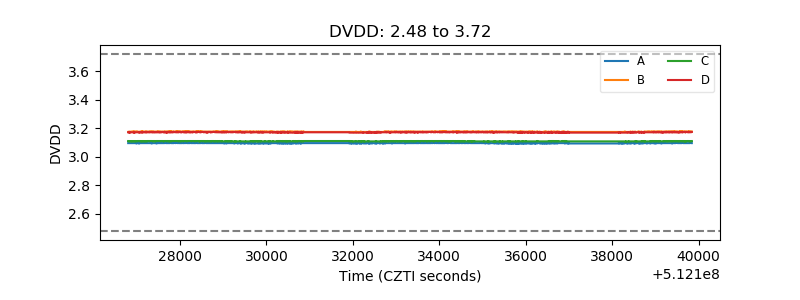 |
| Temperature 1 | 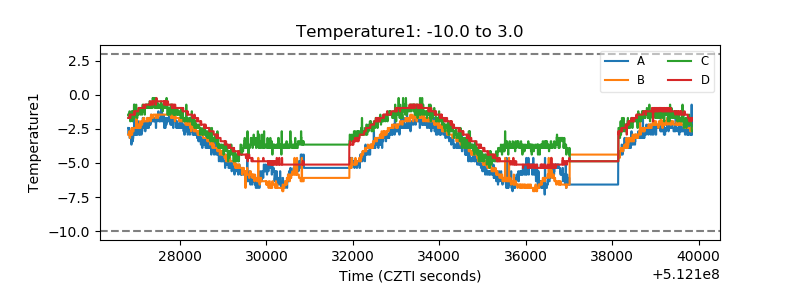 |
| Veto HV Monitor | 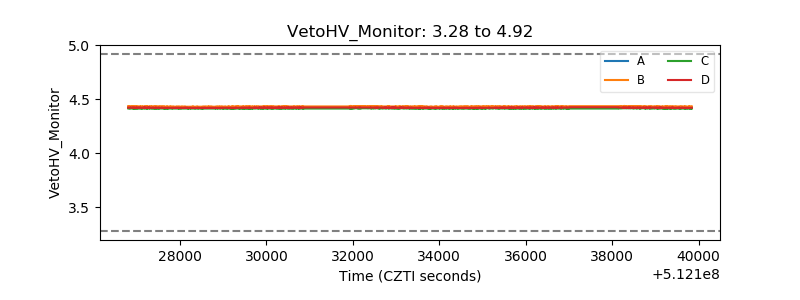 |
| Veto LLD | 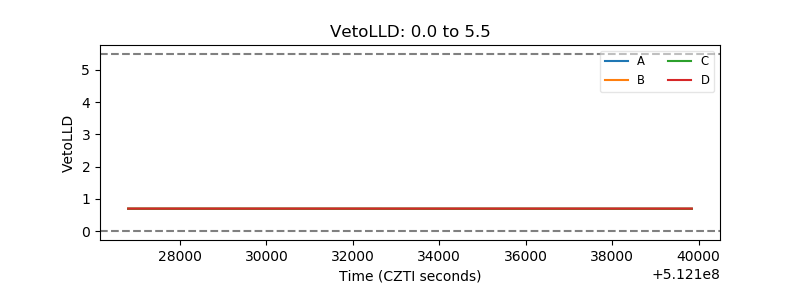 |
| Alpha Counter | 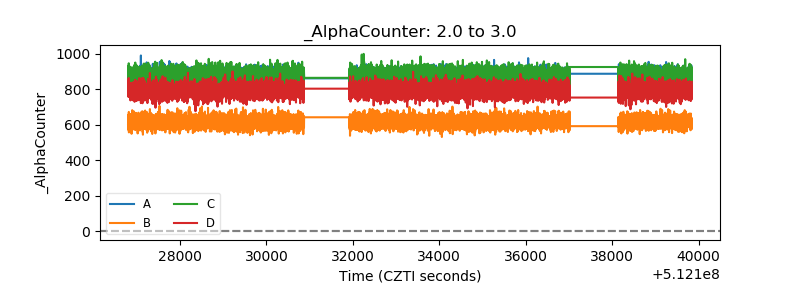 |
| _CPM_Rate | 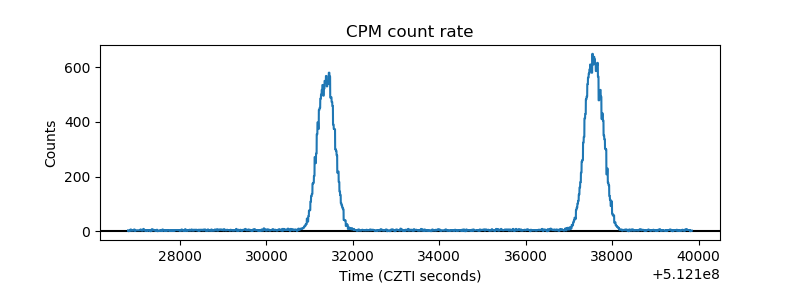 |
| CZT Counter | 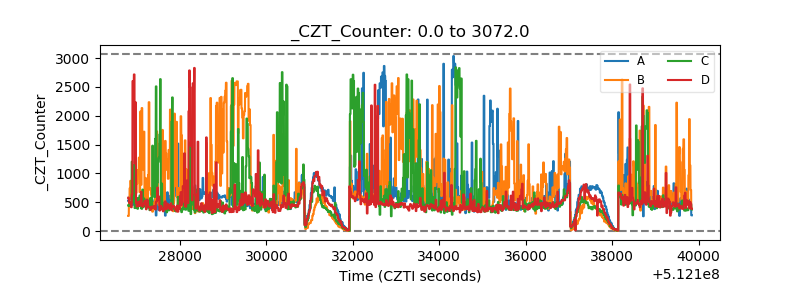 |
| +2.5 Volts monitor | 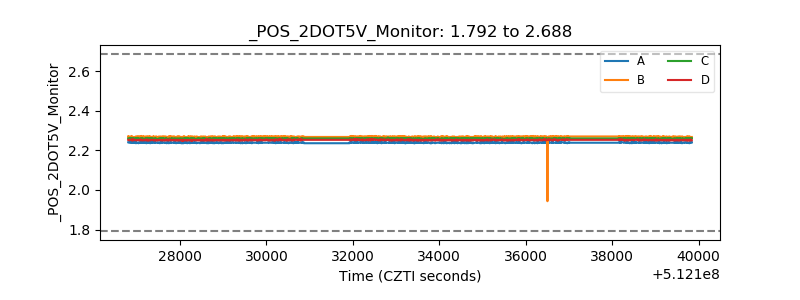 |
| +5 Volts monitor | 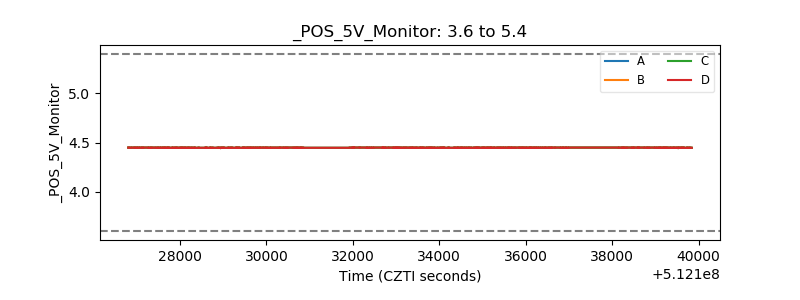 |
| _ROLL_ROT | 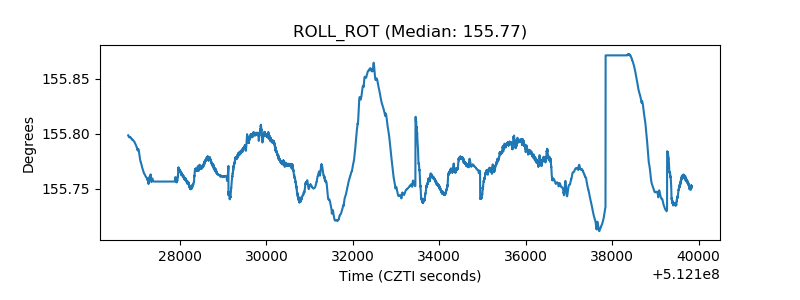 |
| _Roll_DEC | 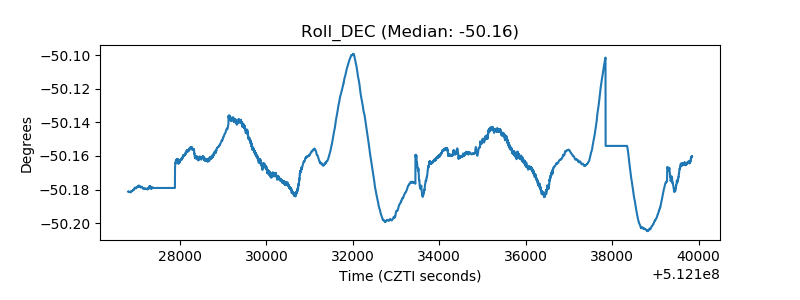 |
| _Roll_RA | 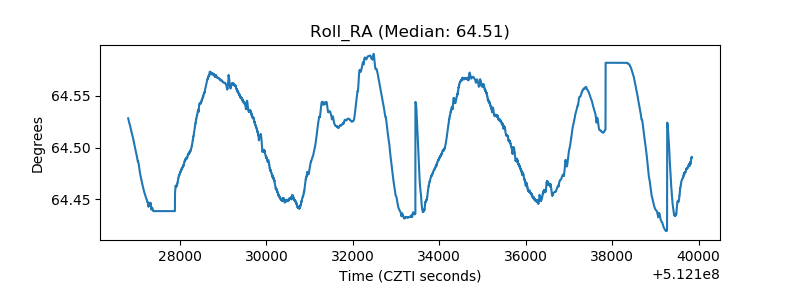 |
| Veto Counter | 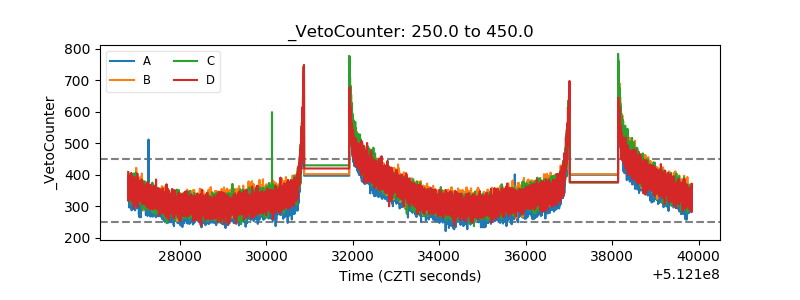 |