| Param | Original file | Final file |
|---|---|---|
| Filename | modeM0/AS1A14_083T05_9000006560_56754cztM0_level2.fits | modeM0/AS1A14_083T05_9000006560_56754cztM0_level2_quad_clean.evt |
| Size (bytes) | 433,725,120 | 95,662,080 |
| Size | 413.6 MB | 91.2 MB |
| Events in quadrant A | 3,884,340 | 629,723 |
| Events in quadrant B | 4,815,230 | 668,245 |
| Events in quadrant C | 3,316,467 | 593,522 |
| Events in quadrant D | 3,539,087 | 556,192 |
| Mode SS | |||
|---|---|---|---|
| Quadrant | BADHDUFLAG | Total packets | Discarded packets |
| A | 0 | 132 | 0 |
| B | 0 | 132 | 0 |
| C | 0 | 132 | 0 |
| D | 0 | 132 | 0 |
| Mode M0 | |||
|---|---|---|---|
| Quadrant | BADHDUFLAG | Total packets | Discarded packets |
| A | 0 | 15720 | 1 |
| B | 0 | 18703 | 1 |
| C | 0 | 14585 | 1 |
| D | 0 | 15119 | 1 |
| Mode M9 | |||
|---|---|---|---|
| Quadrant | BADHDUFLAG | Total packets | Discarded packets |
| A | 0 | 11 | 0 |
| B | 0 | 11 | 0 |
| C | 0 | 11 | 0 |
| D | 0 | 11 | 0 |
| Quadrant | Total seconds | Saturated seconds | Saturation percentage |
|---|---|---|---|
| A | 6430 | 156 | 2.426128% |
| B | 6430 | 340 | 5.287714% |
| C | 6431 | 159 | 2.472399% |
| D | 6431 | 210 | 3.265433% |
Noise dominated data is calculated using 1-second bins in cleaned event files. If a bin has >2000 counts, and if more than 50% of those come from <1% of pixels, then it is considered to be noise-dominated and hence unusable.
| Quadrant | # 1 sec bins | Bins with >0 counts | Bins with >2000 counts | High rate bins dominated by noise | Noise dominated (total time) | Noise dominated (detector-on time) | Marked lightcurve |
|---|---|---|---|---|---|---|---|
| A | 7580 | 6431 | 88 | 88 | 1.16% | 1.37% | 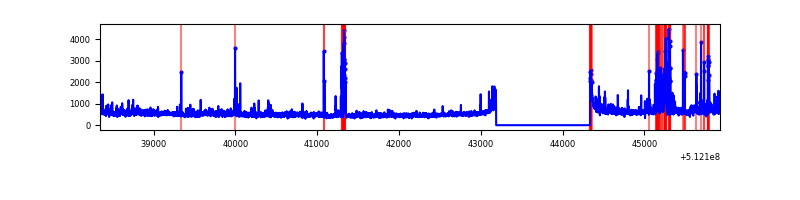 |
| B | 7580 | 6431 | 192 | 192 | 2.53% | 2.99% | 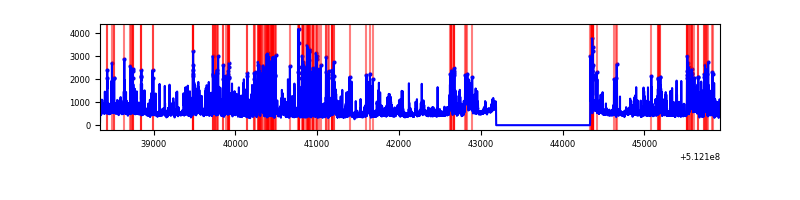 |
| C | 7581 | 6431 | 101 | 101 | 1.33% | 1.57% | 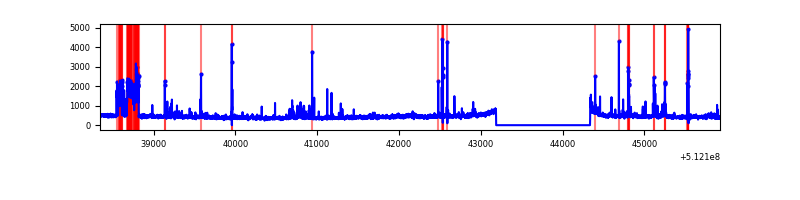 |
| D | 7581 | 6432 | 165 | 165 | 2.18% | 2.57% | 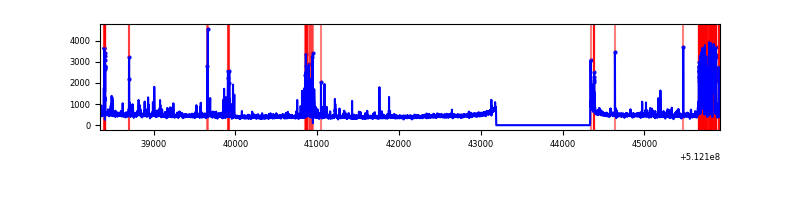 |
Top three noisy pixels from each quadrant. If the there are fewer than three noisy pixels in the level2.evt file, extra rows are filled as -1
| Pixel properties | Quadrant properties | ||||||
|---|---|---|---|---|---|---|---|
| Quadrant | DetID | PixID | Counts | Sigma | Mean | Median | Sigma |
| A | 3 | 14 | 673717 | 3928.83 | 697 | 679 | 171.3 |
| A | 10 | 251 | 310565 | 1808.94 | 697 | 679 | 171.3 |
| A | 3 | 62 | 190616 | 1108.75 | 697 | 679 | 171.3 |
| B | 5 | 185 | 855005 | 5837.84 | 680 | 657 | 146.3 |
| B | 4 | 206 | 827460 | 5649.62 | 680 | 657 | 146.3 |
| B | 8 | 128 | 142504 | 969.25 | 680 | 657 | 146.3 |
| C | 15 | 215 | 297504 | 1629.94 | 664 | 657 | 182.1 |
| C | 9 | 38 | 119873 | 654.59 | 664 | 657 | 182.1 |
| C | 6 | 223 | 103842 | 566.57 | 664 | 657 | 182.1 |
| D | 2 | 249 | 492049 | 2588.8 | 664 | 632 | 189.8 |
| D | 8 | 240 | 180389 | 946.96 | 664 | 632 | 189.8 |
| D | 5 | 173 | 53414 | 278.05 | 664 | 632 | 189.8 |
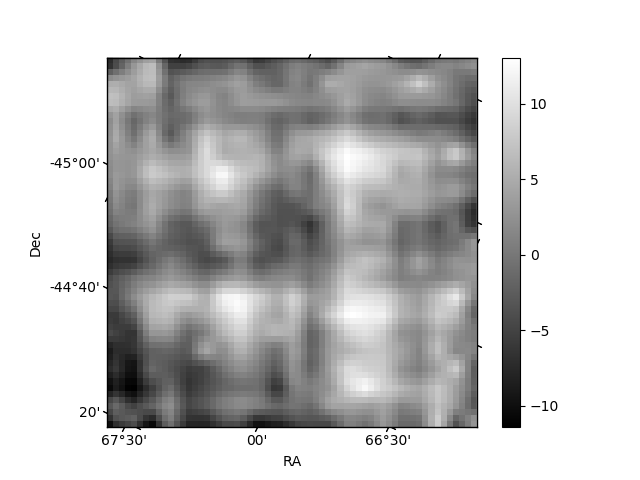
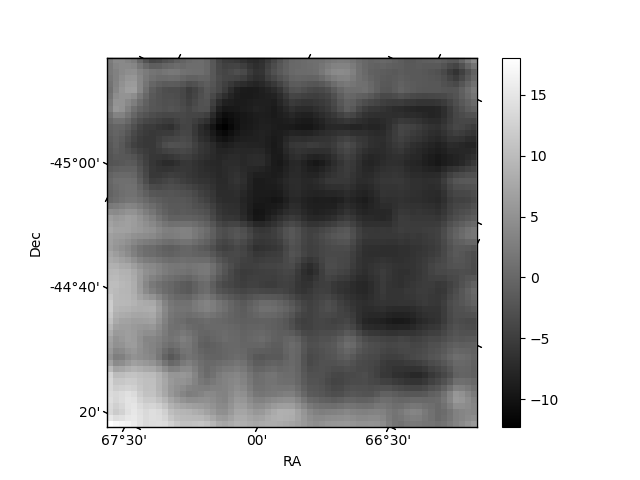
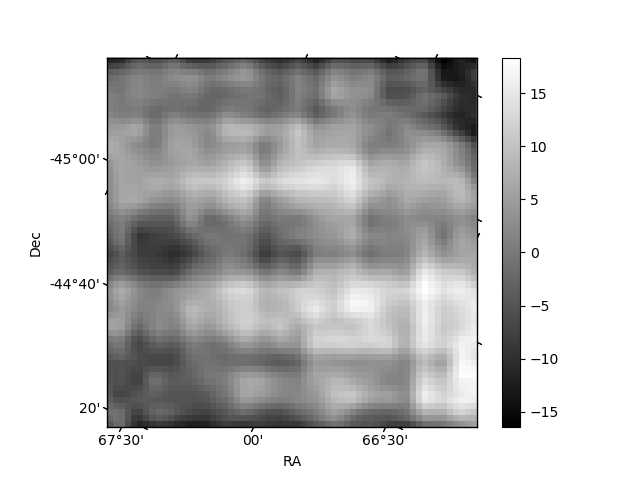
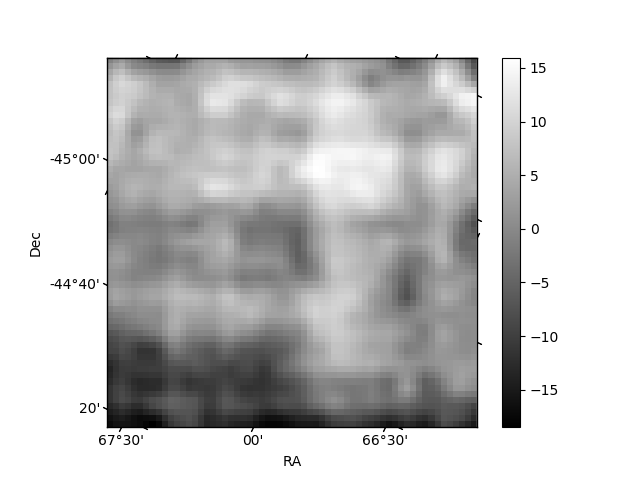
Histogram calculated using DETX and DETY for each event in the final _common_clean file
| Quadrant A | 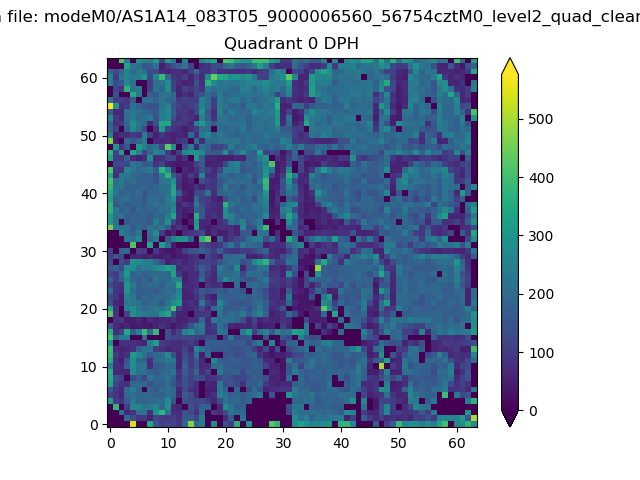 |
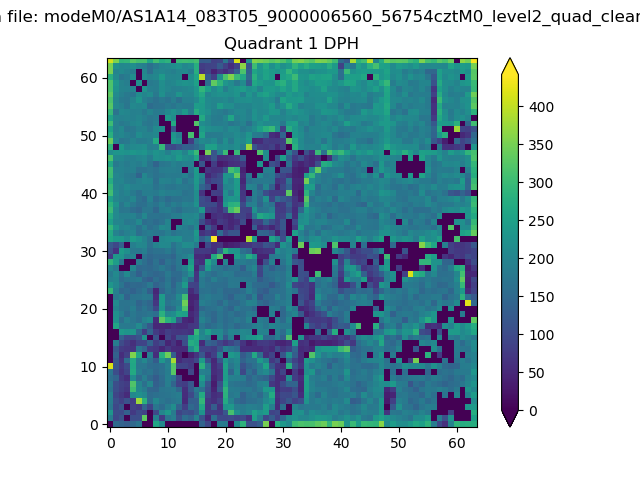 |
Quadrant B |
|---|---|---|---|
| Quadrant D | 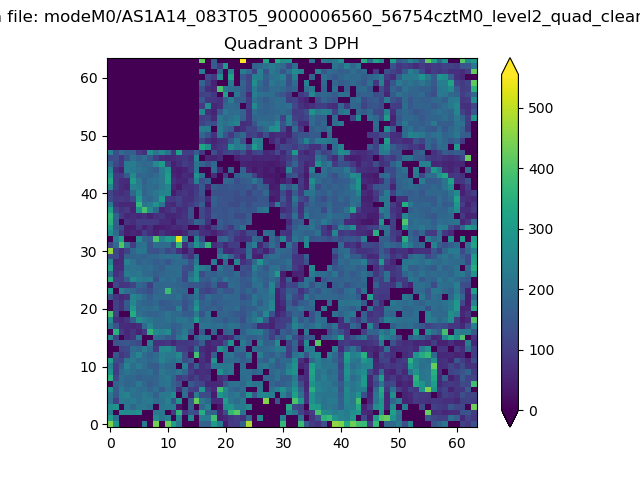 |
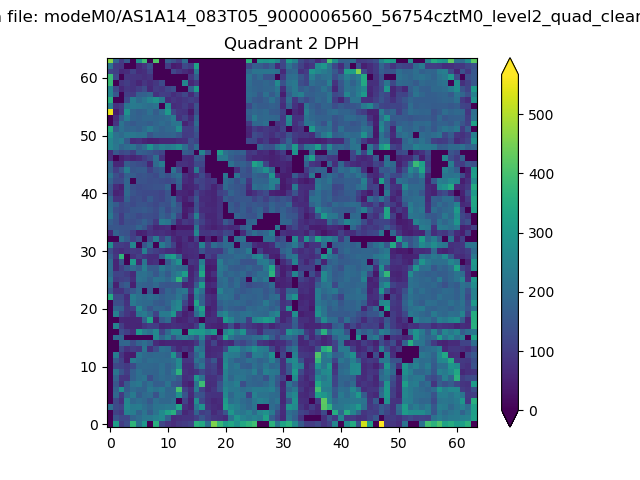 |
Quadrant C |
| Plot type | Count rate plots | Images |
|---|---|---|
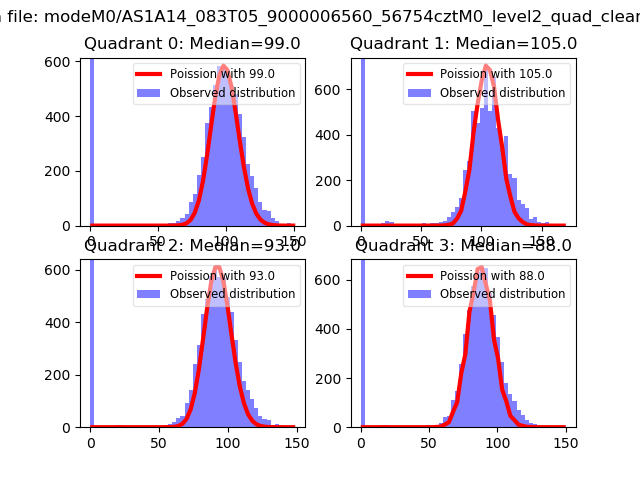
| Comparison with Poisson distribution Blue bars denote a histogram of data divided into 1 sec bins. Red curve is a Poisson curve with rate = median count rate of data. |
 |
 |
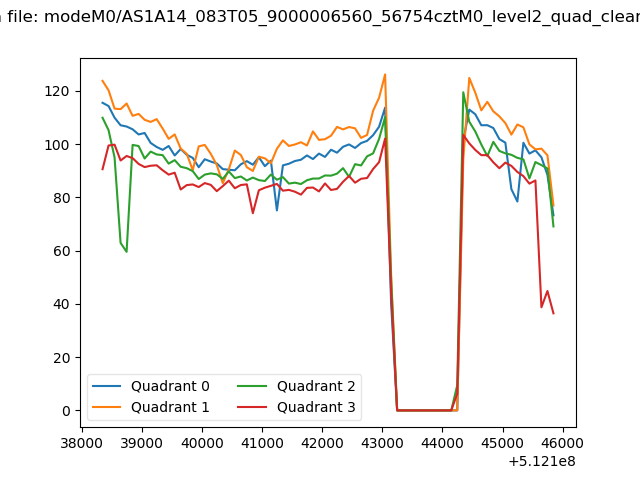
| Quadrant-wise count rates Data is divided into 100 sec bins |
 |
|
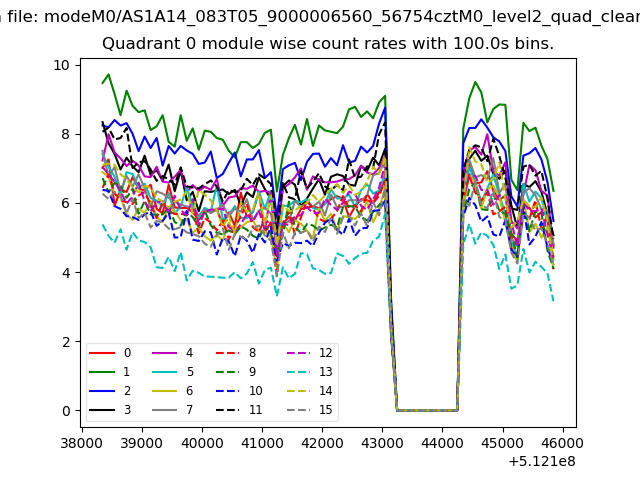
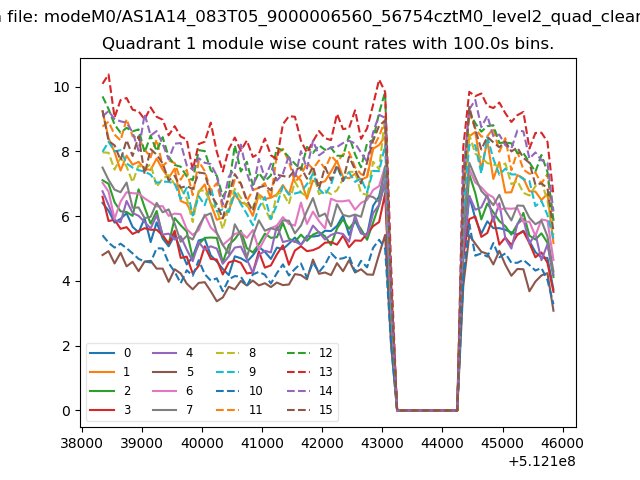
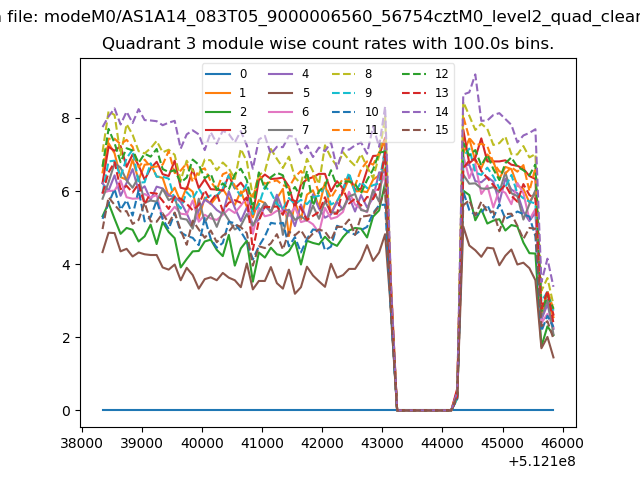
| Module-wise count rates for Quadrant A Data is divided into 100 sec bins |
 |
 |
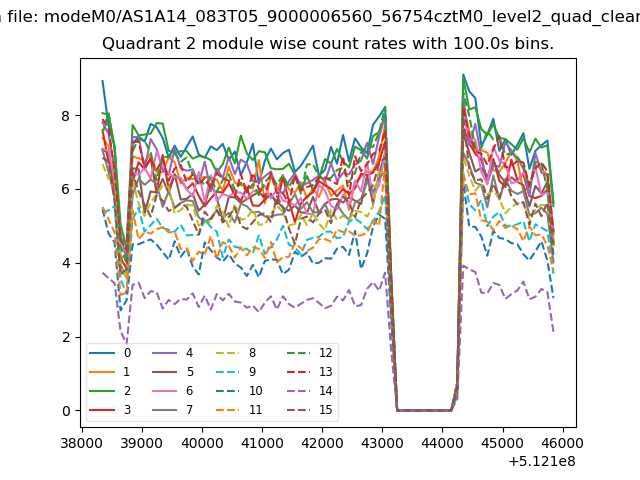
| Module-wise count rates for Quadrant B Data is divided into 100 sec bins |
 |
 |
| Module-wise count rates for Quadrant C Data is divided into 100 sec bins |
 |
 |
| Module-wise count rates for Quadrant D Data is divided into 100 sec bins |
 |
 |
| Parameter | Plot |
|---|---|
| CZT HV Monitor | 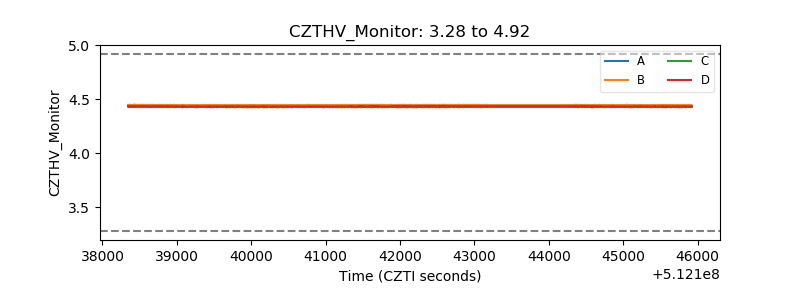 |
| D_VDD | 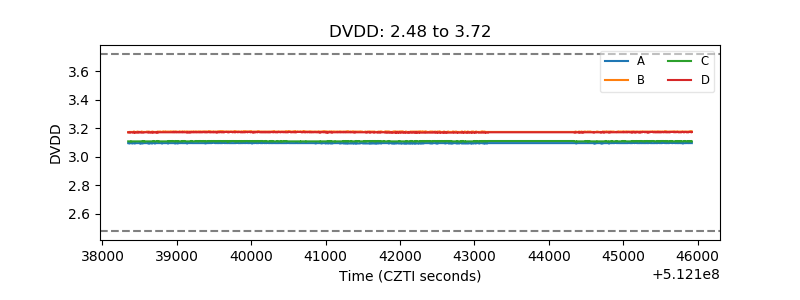 |
| Temperature 1 | 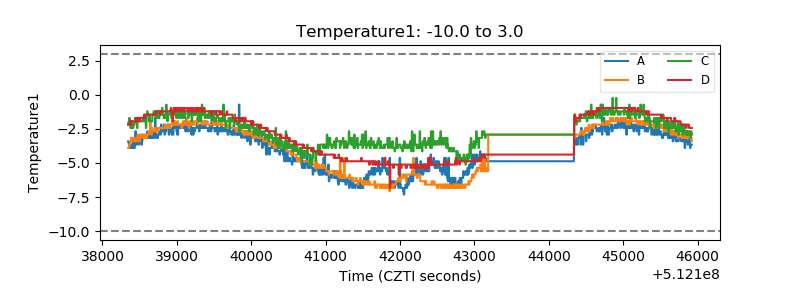 |
| Veto HV Monitor | 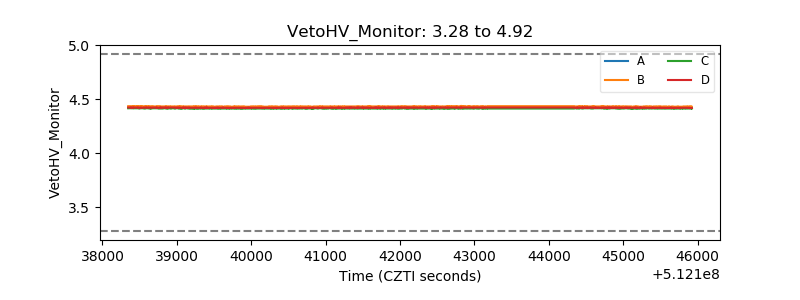 |
| Veto LLD | 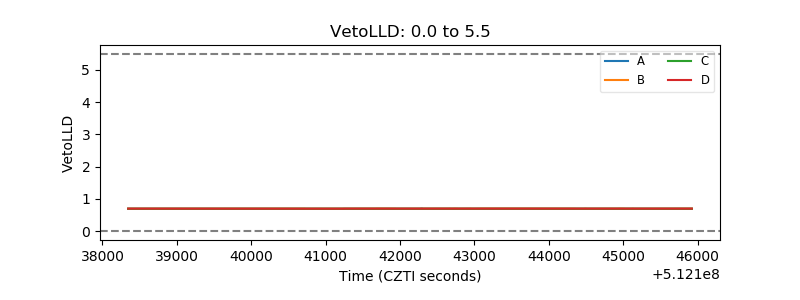 |
| Alpha Counter | 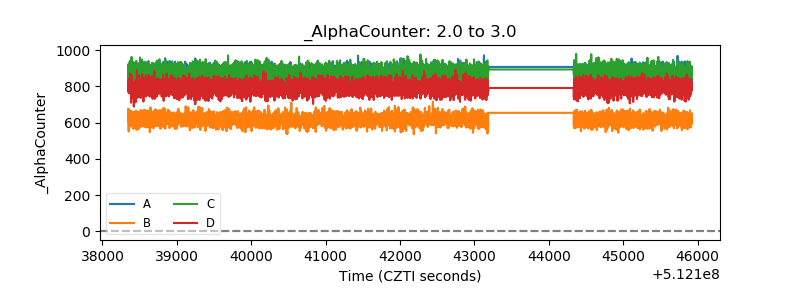 |
| _CPM_Rate | 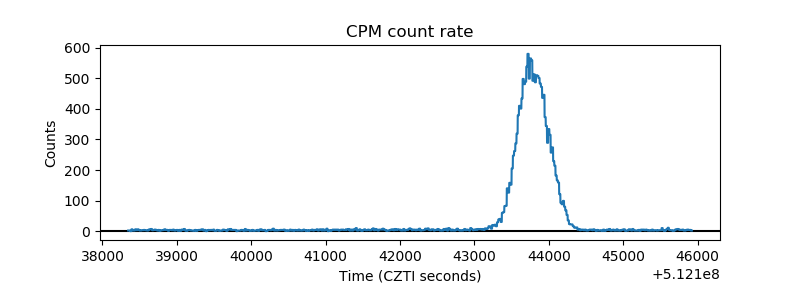 |
| CZT Counter | 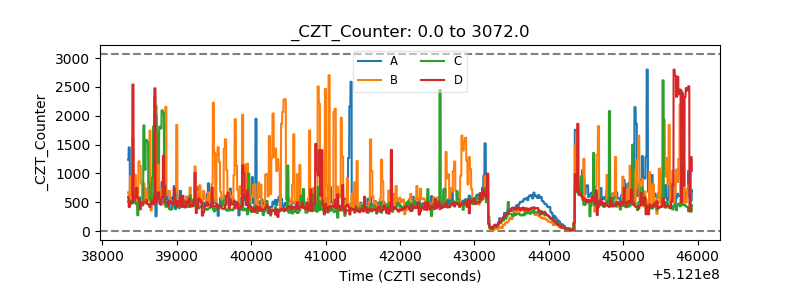 |
| +2.5 Volts monitor |  |
| +5 Volts monitor |  |
| _ROLL_ROT | 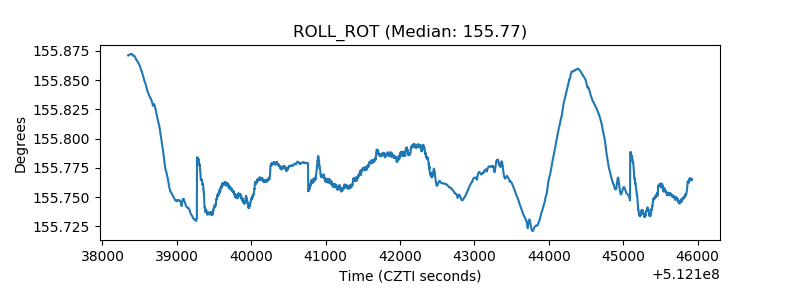 |
| _Roll_DEC | 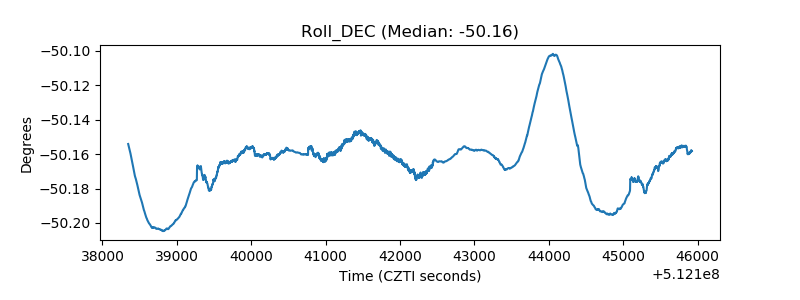 |
| _Roll_RA | 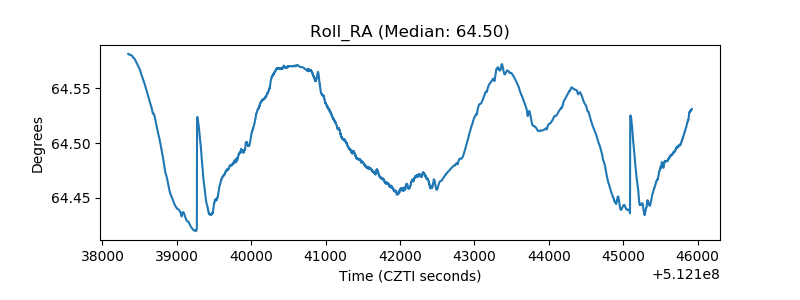 |
| Veto Counter | 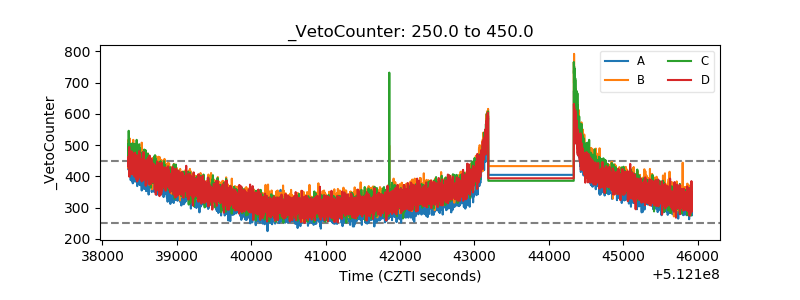 |