| Param | Original file | Final file |
|---|---|---|
| Filename | modeM0/AS1A14_083T05_9000006560_56755cztM0_level2.fits | modeM0/AS1A14_083T05_9000006560_56755cztM0_level2_quad_clean.evt |
| Size (bytes) | 475,822,080 | 88,476,480 |
| Size | 453.8 MB | 84.4 MB |
| Events in quadrant A | 3,612,022 | 596,675 |
| Events in quadrant B | 4,953,862 | 613,598 |
| Events in quadrant C | 3,793,962 | 550,325 |
| Events in quadrant D | 4,767,602 | 482,702 |
| Mode SS | |||
|---|---|---|---|
| Quadrant | BADHDUFLAG | Total packets | Discarded packets |
| A | 0 | 126 | 0 |
| B | 0 | 126 | 0 |
| C | 0 | 126 | 0 |
| D | 0 | 126 | 0 |
| Mode M0 | |||
|---|---|---|---|
| Quadrant | BADHDUFLAG | Total packets | Discarded packets |
| A | 0 | 15003 | 1 |
| B | 0 | 19124 | 1 |
| C | 0 | 15790 | 1 |
| D | 0 | 18709 | 3 |
| Mode M9 | |||
|---|---|---|---|
| Quadrant | BADHDUFLAG | Total packets | Discarded packets |
| A | 0 | 11 | 0 |
| B | 0 | 11 | 0 |
| C | 0 | 11 | 0 |
| D | 0 | 11 | 0 |
| Quadrant | Total seconds | Saturated seconds | Saturation percentage |
|---|---|---|---|
| A | 6247 | 165 | 2.641268% |
| B | 6247 | 569 | 9.108372% |
| C | 6248 | 329 | 5.265685% |
| D | 6247 | 763 | 12.213863% |
Noise dominated data is calculated using 1-second bins in cleaned event files. If a bin has >2000 counts, and if more than 50% of those come from <1% of pixels, then it is considered to be noise-dominated and hence unusable.
| Quadrant | # 1 sec bins | Bins with >0 counts | Bins with >2000 counts | High rate bins dominated by noise | Noise dominated (total time) | Noise dominated (detector-on time) | Marked lightcurve |
|---|---|---|---|---|---|---|---|
| A | 7317 | 6248 | 76 | 76 | 1.04% | 1.22% | 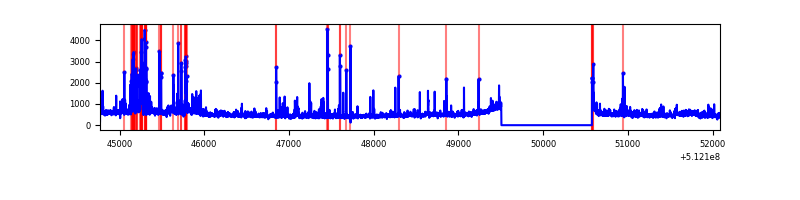 |
| B | 7317 | 6248 | 238 | 238 | 3.25% | 3.81% | 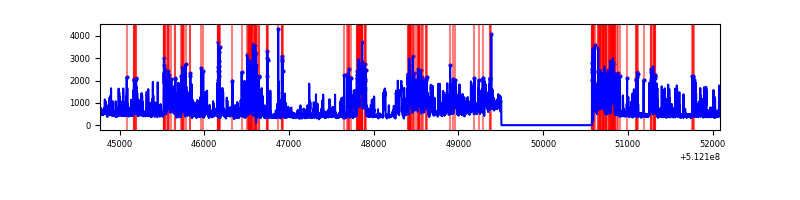 |
| C | 7318 | 6249 | 207 | 207 | 2.83% | 3.31% | 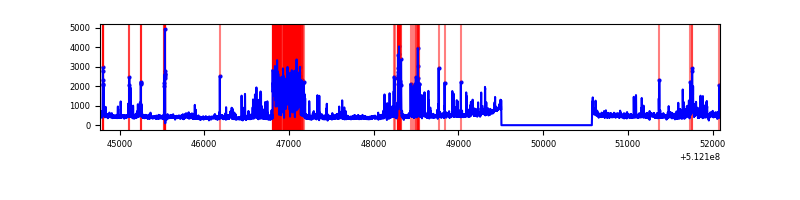 |
| D | 7317 | 6248 | 729 | 729 | 9.96% | 11.67% | 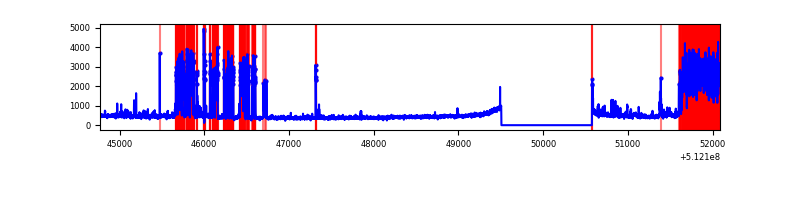 |
Top three noisy pixels from each quadrant. If the there are fewer than three noisy pixels in the level2.evt file, extra rows are filled as -1
| Pixel properties | Quadrant properties | ||||||
|---|---|---|---|---|---|---|---|
| Quadrant | DetID | PixID | Counts | Sigma | Mean | Median | Sigma |
| A | 3 | 14 | 547344 | 3328.19 | 667 | 650 | 164.3 |
| A | 10 | 251 | 351913 | 2138.44 | 667 | 650 | 164.3 |
| A | 3 | 62 | 100474 | 607.71 | 667 | 650 | 164.3 |
| B | 4 | 206 | 1376178 | 9839.77 | 647 | 624 | 139.8 |
| B | 5 | 185 | 607356 | 4340.14 | 647 | 624 | 139.8 |
| B | 8 | 128 | 243497 | 1737.35 | 647 | 624 | 139.8 |
| C | 9 | 38 | 204171 | 1179.05 | 631 | 624 | 172.6 |
| C | 12 | 252 | 168100 | 970.11 | 631 | 624 | 172.6 |
| C | 15 | 199 | 148463 | 856.36 | 631 | 624 | 172.6 |
| D | 2 | 249 | 2040166 | 11634.6 | 612 | 584 | 175.3 |
| D | 8 | 160 | 73145 | 413.92 | 612 | 584 | 175.3 |
| D | 5 | 173 | 50971 | 287.43 | 612 | 584 | 175.3 |
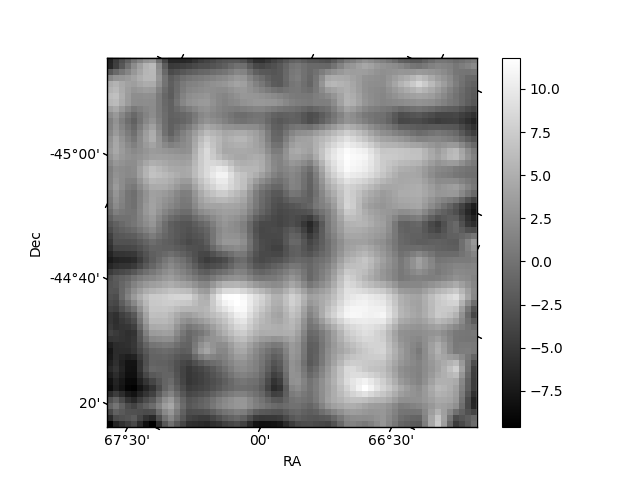
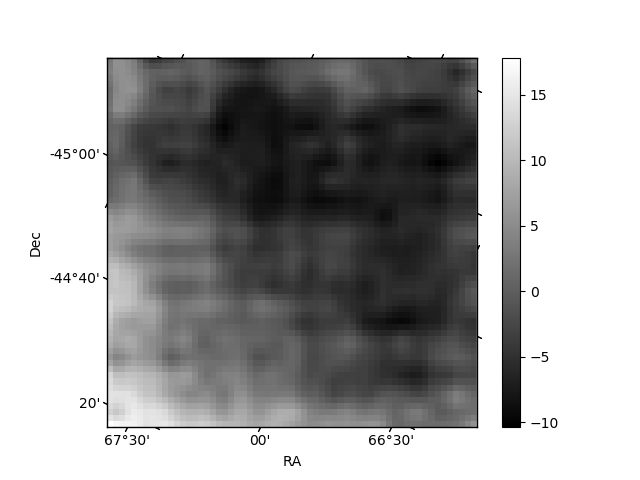
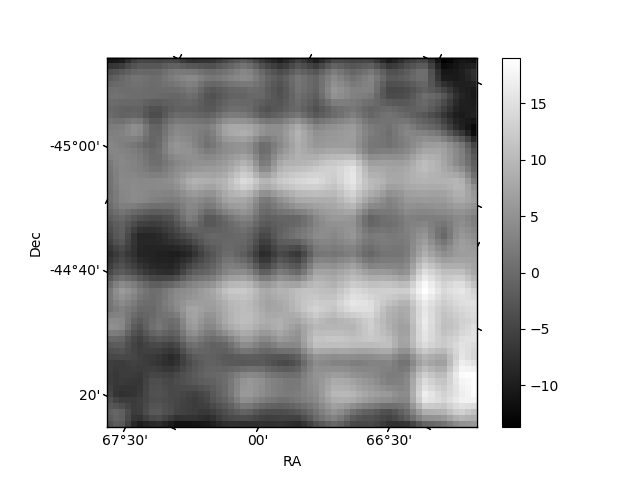
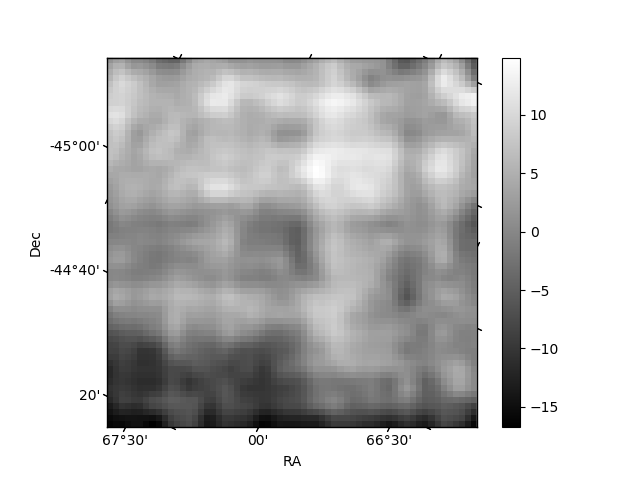
Histogram calculated using DETX and DETY for each event in the final _common_clean file
| Quadrant A | 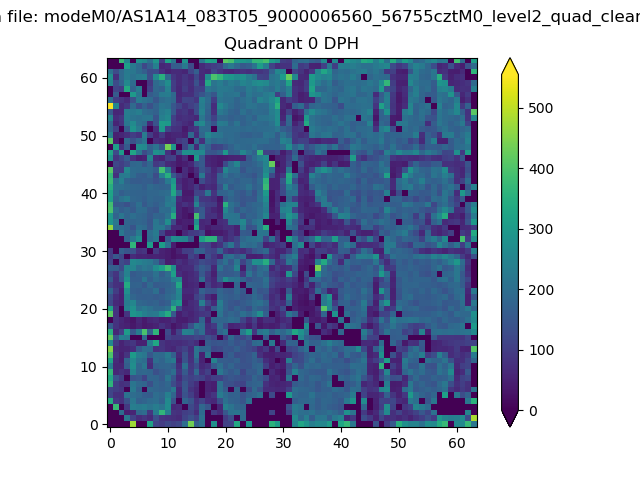 |
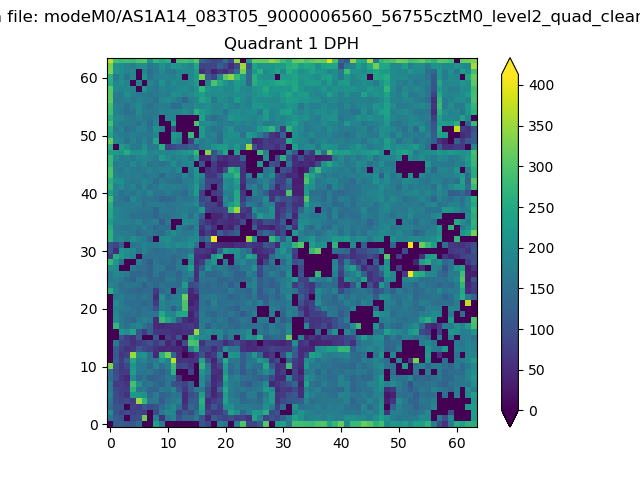 |
Quadrant B |
|---|---|---|---|
| Quadrant D | 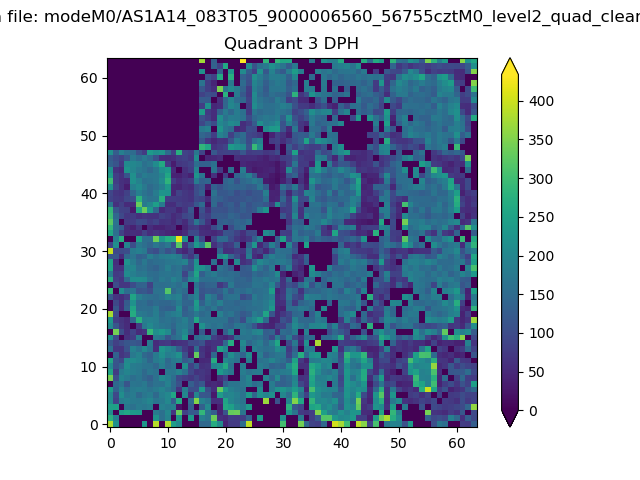 |
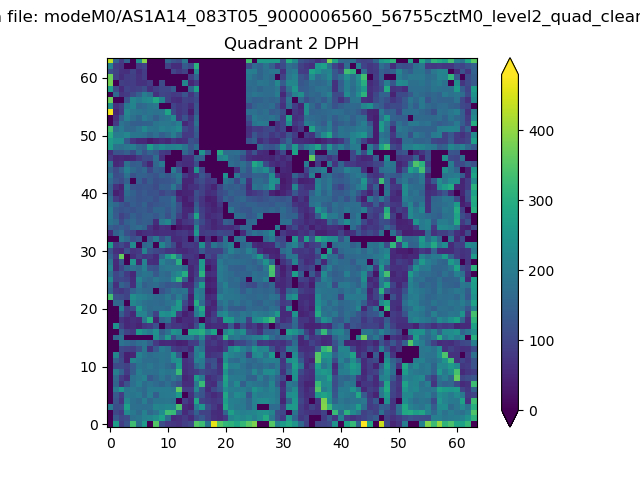 |
Quadrant C |
| Plot type | Count rate plots | Images |
|---|---|---|
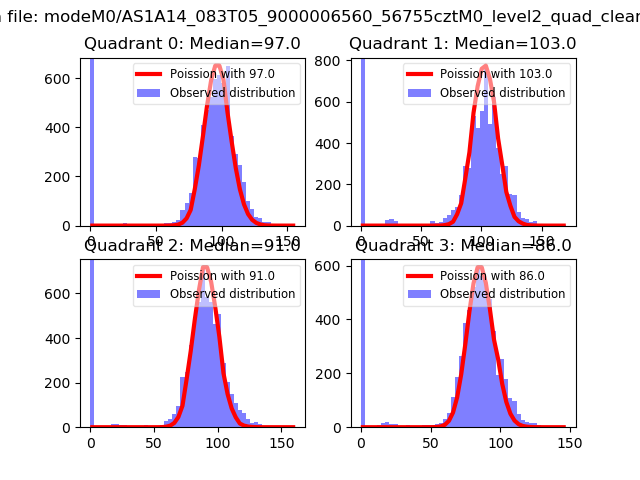
| Comparison with Poisson distribution Blue bars denote a histogram of data divided into 1 sec bins. Red curve is a Poisson curve with rate = median count rate of data. |
 |
 |
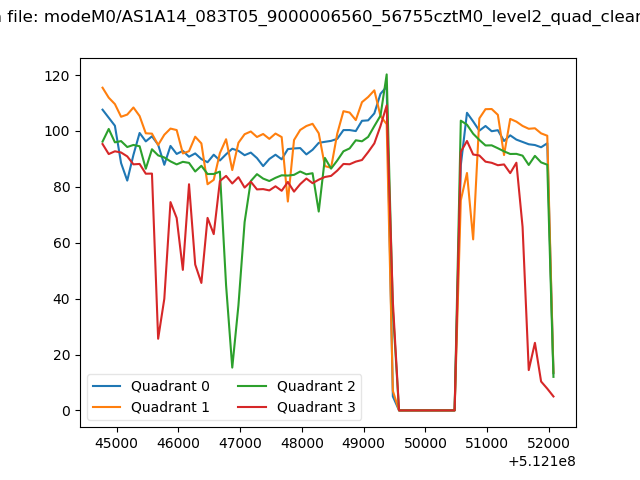
| Quadrant-wise count rates Data is divided into 100 sec bins |
 |
|
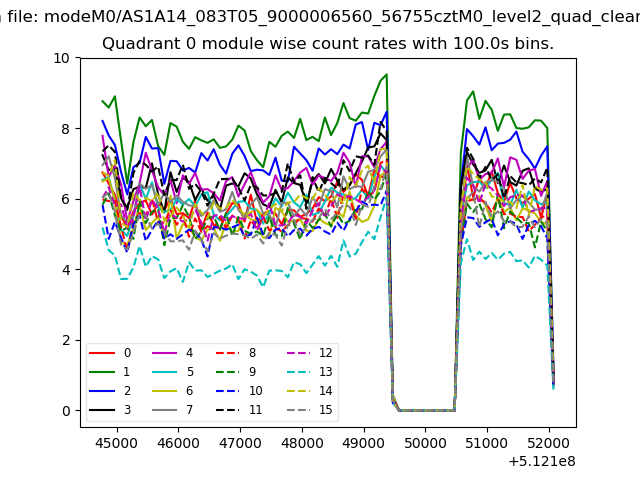
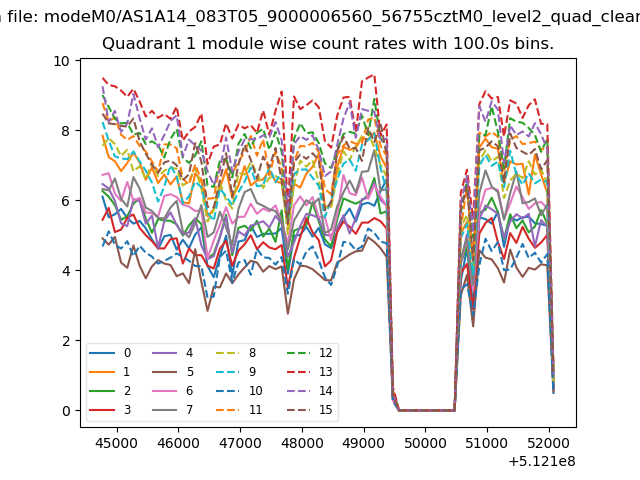
| Module-wise count rates for Quadrant A Data is divided into 100 sec bins |
 |
 |
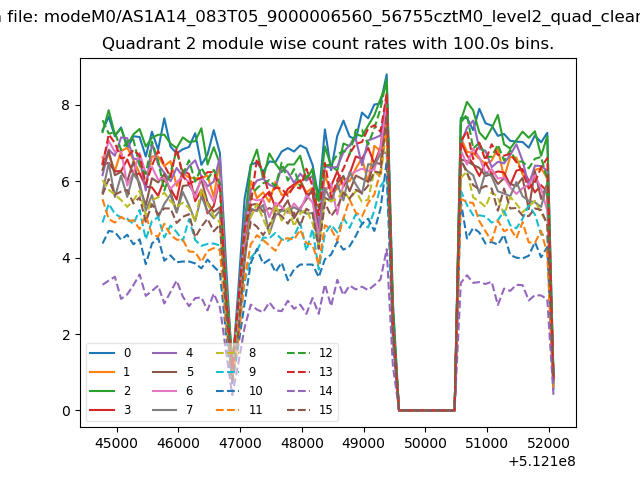
| Module-wise count rates for Quadrant B Data is divided into 100 sec bins |
 |
 |
| Module-wise count rates for Quadrant C Data is divided into 100 sec bins |
 |
 |
| Module-wise count rates for Quadrant D Data is divided into 100 sec bins |
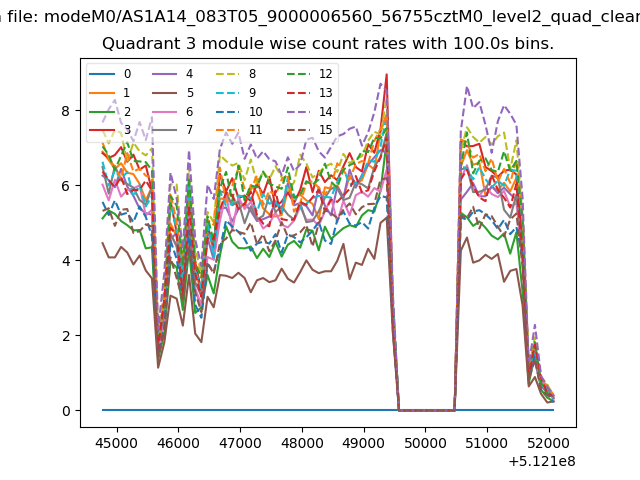 |
 |
| Parameter | Plot |
|---|---|
| CZT HV Monitor | 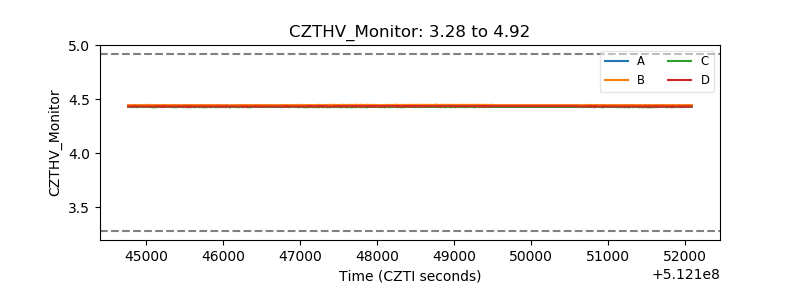 |
| D_VDD | 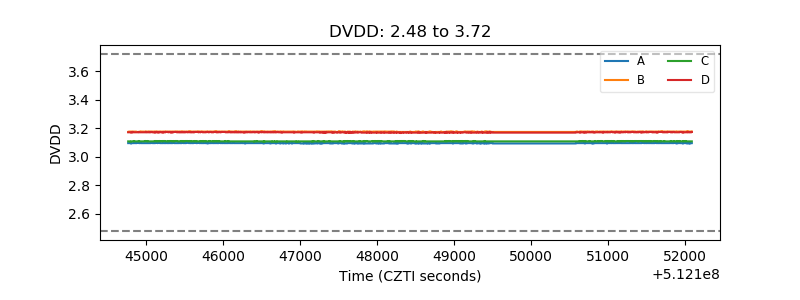 |
| Temperature 1 | 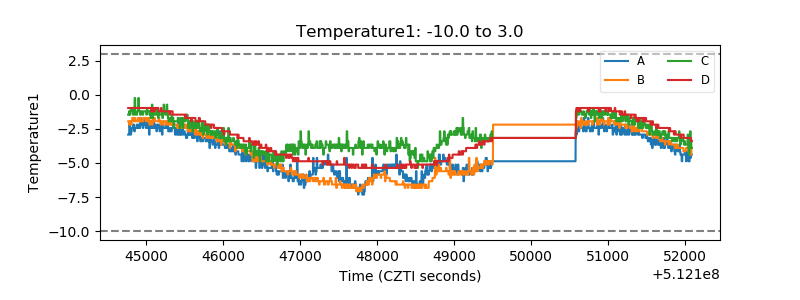 |
| Veto HV Monitor | 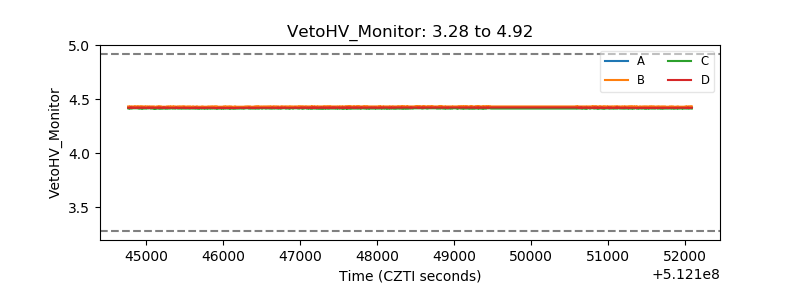 |
| Veto LLD | 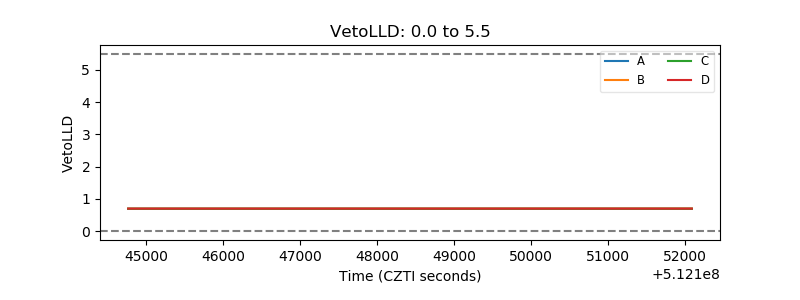 |
| Alpha Counter | 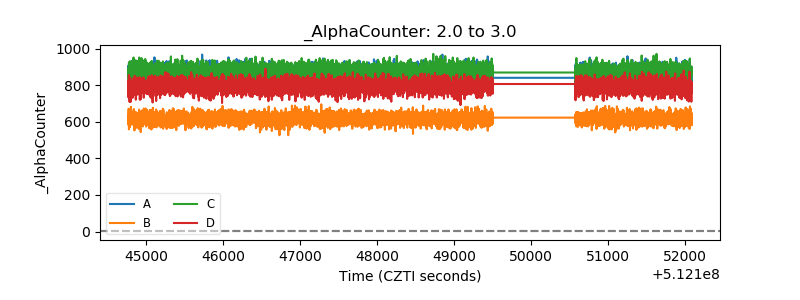 |
| _CPM_Rate | 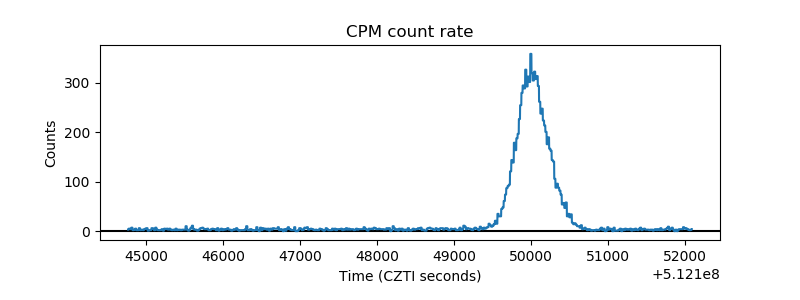 |
| CZT Counter | 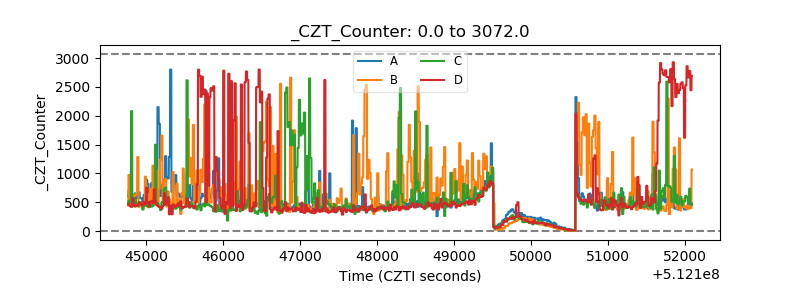 |
| +2.5 Volts monitor |  |
| +5 Volts monitor | 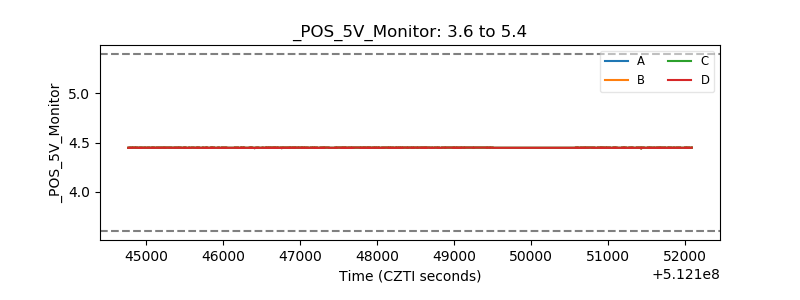 |
| _ROLL_ROT | 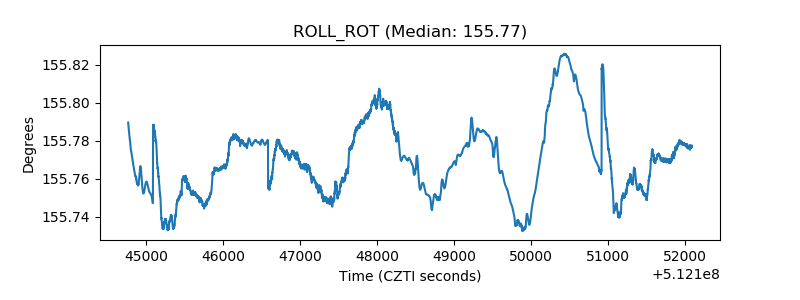 |
| _Roll_DEC | 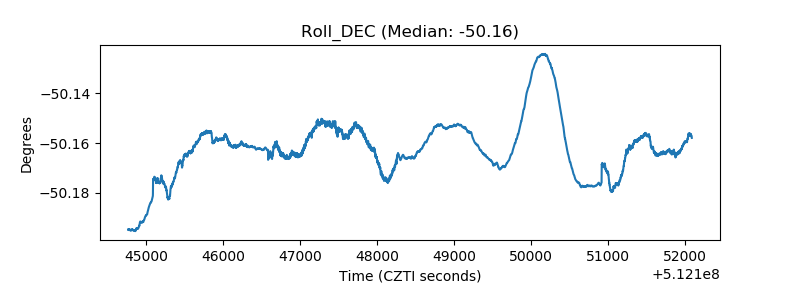 |
| _Roll_RA | 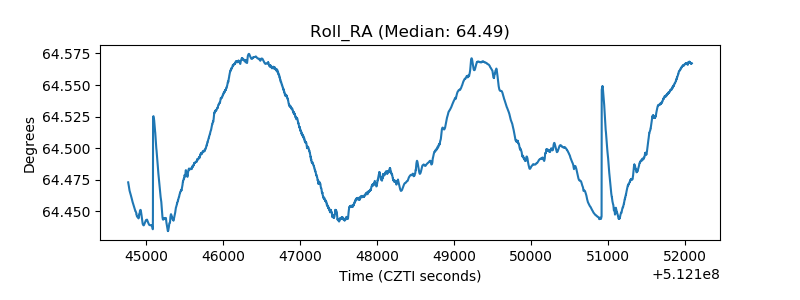 |
| Veto Counter | 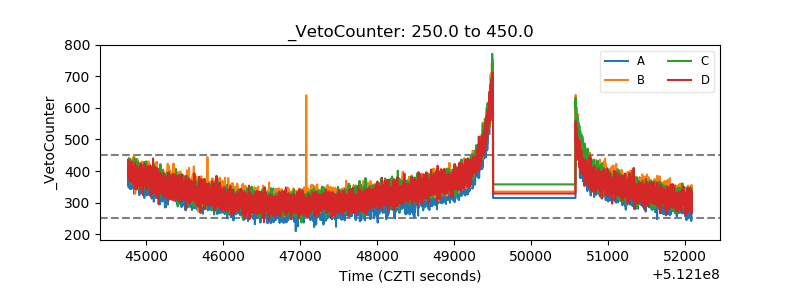 |