| Param | Original file | Final file |
|---|---|---|
| Filename | modeM0/AS1A14_083T05_9000006560_56757cztM0_level2.fits | modeM0/AS1A14_083T05_9000006560_56757cztM0_level2_quad_clean.evt |
| Size (bytes) | 567,803,520 | 91,650,240 |
| Size | 541.5 MB | 87.4 MB |
| Events in quadrant A | 4,290,590 | 609,050 |
| Events in quadrant B | 6,852,104 | 584,221 |
| Events in quadrant C | 4,666,781 | 575,353 |
| Events in quadrant D | 4,685,826 | 536,599 |
| Mode SS | |||
|---|---|---|---|
| Quadrant | BADHDUFLAG | Total packets | Discarded packets |
| A | 0 | 138 | 0 |
| B | 0 | 138 | 0 |
| C | 0 | 138 | 0 |
| D | 0 | 138 | 0 |
| Mode M0 | |||
|---|---|---|---|
| Quadrant | BADHDUFLAG | Total packets | Discarded packets |
| A | 0 | 17498 | 1 |
| B | 0 | 25054 | 1 |
| C | 0 | 18951 | 1 |
| D | 0 | 18938 | 1 |
| Mode M9 | |||
|---|---|---|---|
| Quadrant | BADHDUFLAG | Total packets | Discarded packets |
| A | 0 | 5 | 0 |
| B | 0 | 5 | 0 |
| C | 0 | 5 | 0 |
| D | 0 | 5 | 0 |
| Quadrant | Total seconds | Saturated seconds | Saturation percentage |
|---|---|---|---|
| A | 6735 | 344 | 5.107647% |
| B | 6734 | 1196 | 17.760618% |
| C | 6735 | 383 | 5.686711% |
| D | 6735 | 496 | 7.364514% |
Noise dominated data is calculated using 1-second bins in cleaned event files. If a bin has >2000 counts, and if more than 50% of those come from <1% of pixels, then it is considered to be noise-dominated and hence unusable.
| Quadrant | # 1 sec bins | Bins with >0 counts | Bins with >2000 counts | High rate bins dominated by noise | Noise dominated (total time) | Noise dominated (detector-on time) | Marked lightcurve |
|---|---|---|---|---|---|---|---|
| A | 7295 | 6736 | 295 | 295 | 4.04% | 4.38% | 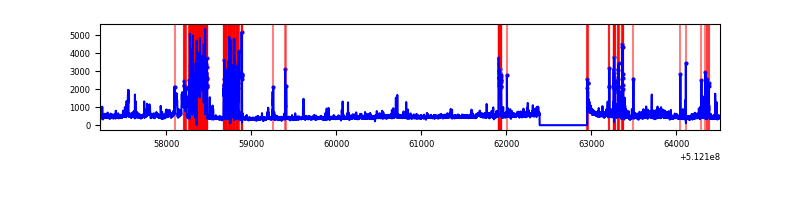 |
| B | 7294 | 6735 | 658 | 658 | 9.02% | 9.77% | 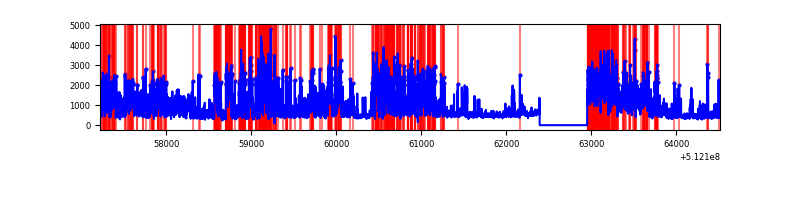 |
| C | 7295 | 6736 | 364 | 364 | 4.99% | 5.40% | 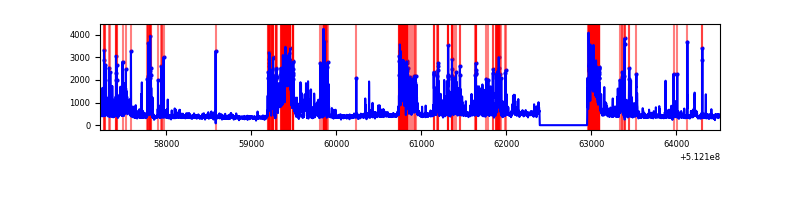 |
| D | 7295 | 6736 | 500 | 500 | 6.85% | 7.42% | 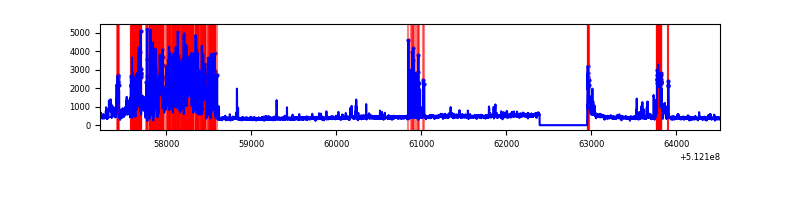 |
Top three noisy pixels from each quadrant. If the there are fewer than three noisy pixels in the level2.evt file, extra rows are filled as -1
| Pixel properties | Quadrant properties | ||||||
|---|---|---|---|---|---|---|---|
| Quadrant | DetID | PixID | Counts | Sigma | Mean | Median | Sigma |
| A | 3 | 62 | 1045157 | 6096.09 | 684 | 668 | 171.3 |
| A | 3 | 14 | 317703 | 1850.35 | 684 | 668 | 171.3 |
| A | 10 | 251 | 161881 | 940.91 | 684 | 668 | 171.3 |
| B | 4 | 206 | 2995342 | 21537.12 | 648 | 624 | 139.0 |
| B | 5 | 185 | 602116 | 4325.75 | 648 | 624 | 139.0 |
| B | 8 | 128 | 286134 | 2053.3 | 648 | 624 | 139.0 |
| C | 15 | 230 | 1525674 | 8425.47 | 658 | 651 | 181.0 |
| C | 12 | 252 | 265734 | 1464.53 | 658 | 651 | 181.0 |
| C | 13 | 3 | 76052 | 416.58 | 658 | 651 | 181.0 |
| D | 2 | 249 | 1726671 | 9202.06 | 656 | 625 | 187.6 |
| D | 2 | 252 | 193918 | 1030.5 | 656 | 625 | 187.6 |
| D | 2 | 236 | 65632 | 346.57 | 656 | 625 | 187.6 |
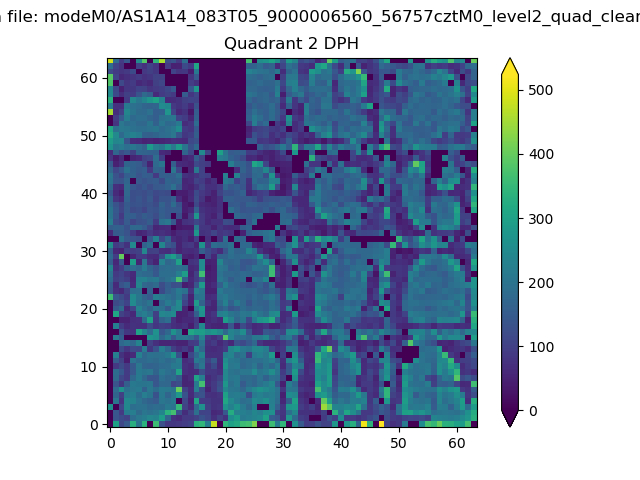
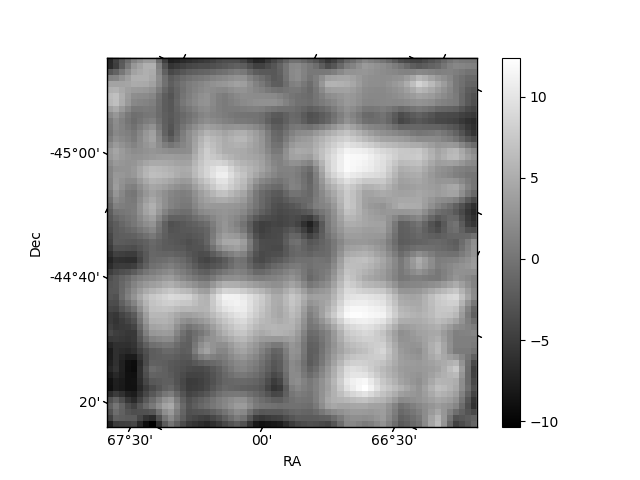
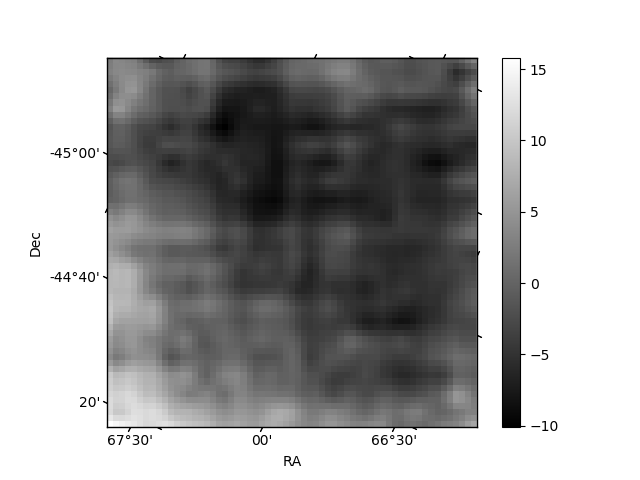
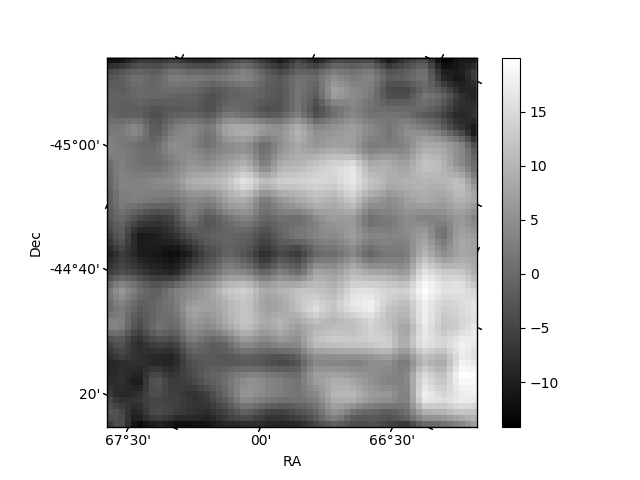
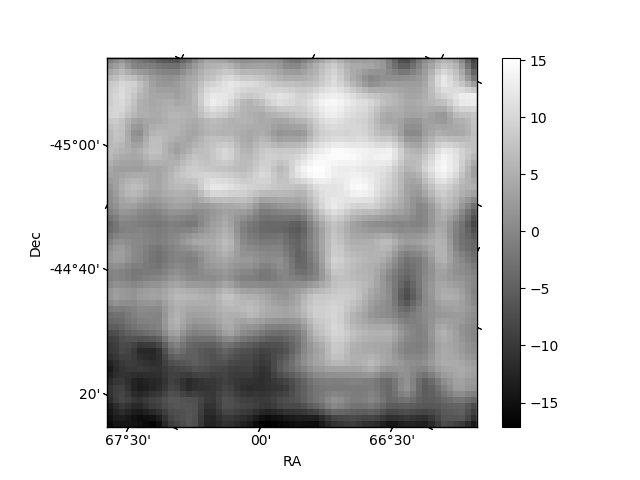
Histogram calculated using DETX and DETY for each event in the final _common_clean file
| Quadrant A | 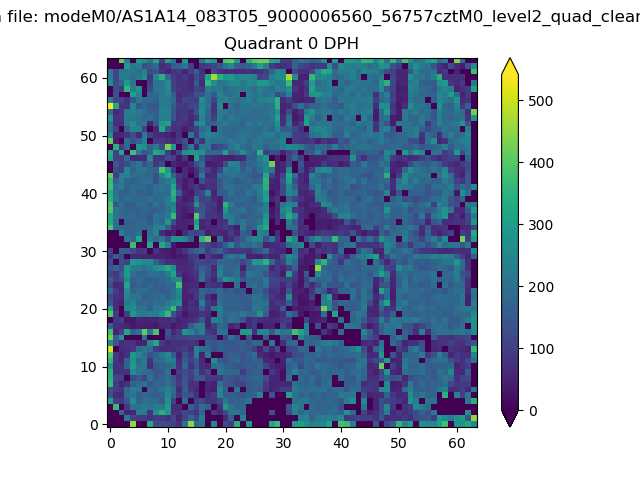 |
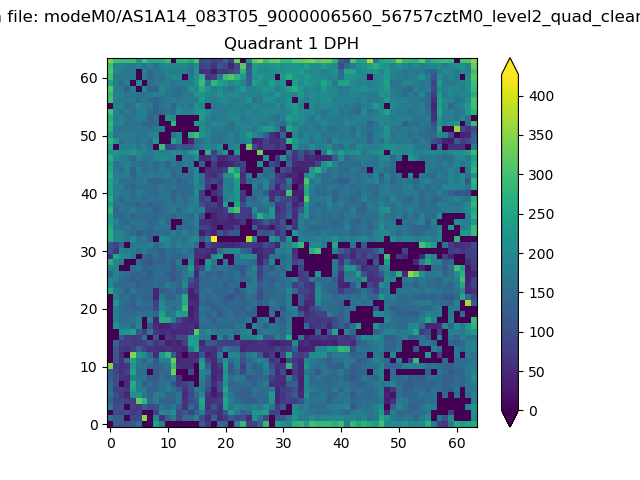 |
Quadrant B |
|---|---|---|---|
| Quadrant D | 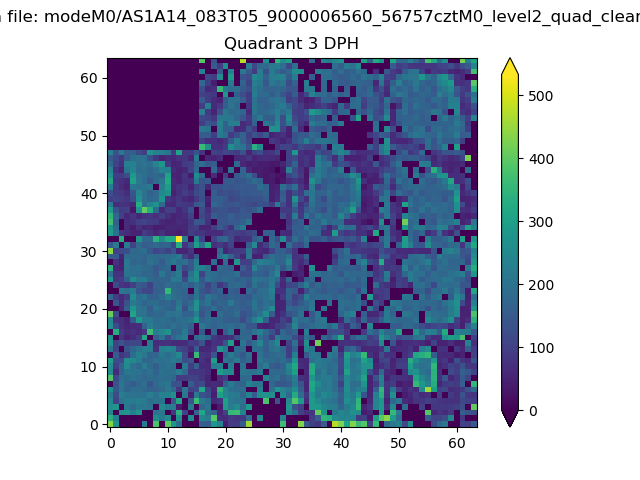 |
 |
Quadrant C |
| Plot type | Count rate plots | Images |
|---|---|---|
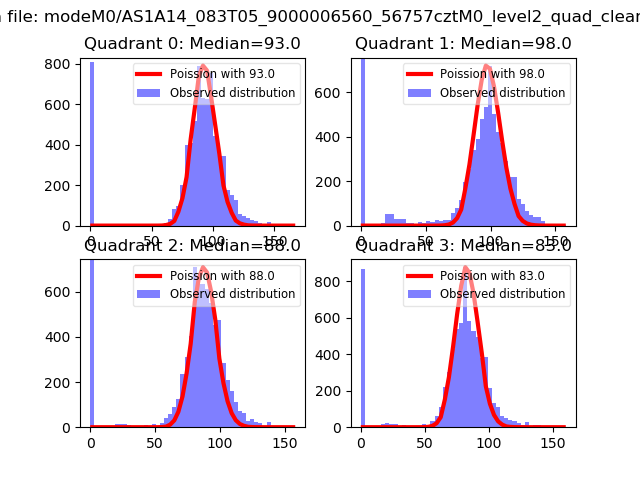
| Comparison with Poisson distribution Blue bars denote a histogram of data divided into 1 sec bins. Red curve is a Poisson curve with rate = median count rate of data. |
 |
 |
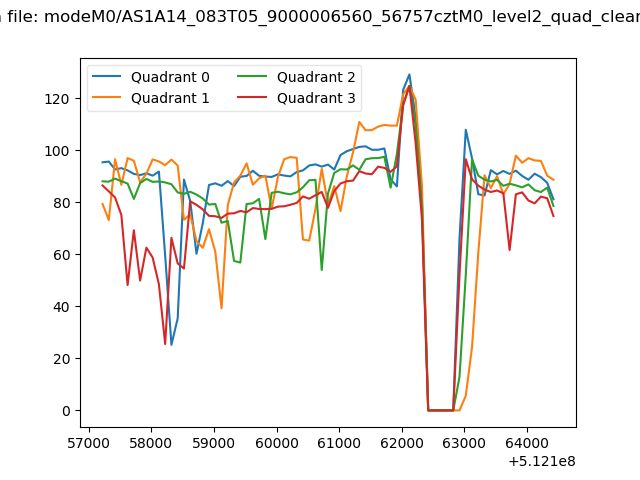
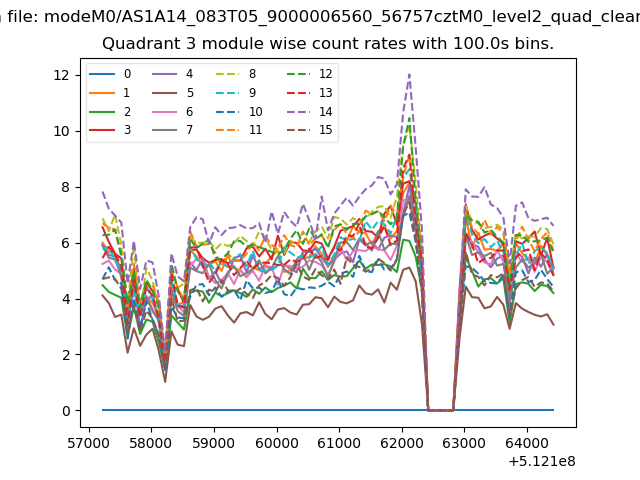
| Quadrant-wise count rates Data is divided into 100 sec bins |
 |
|
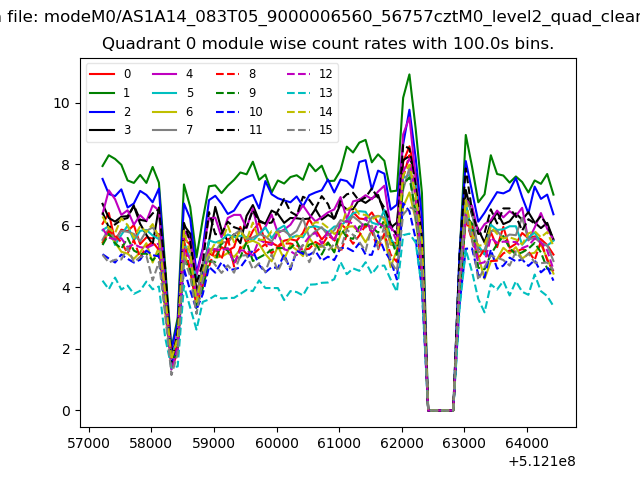
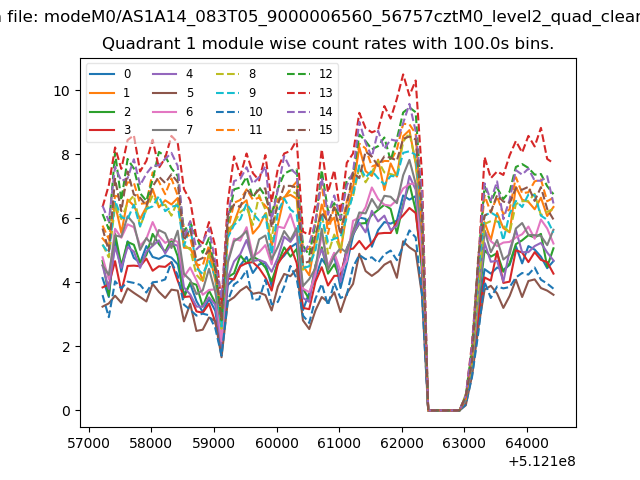
| Module-wise count rates for Quadrant A Data is divided into 100 sec bins |
 |
 |
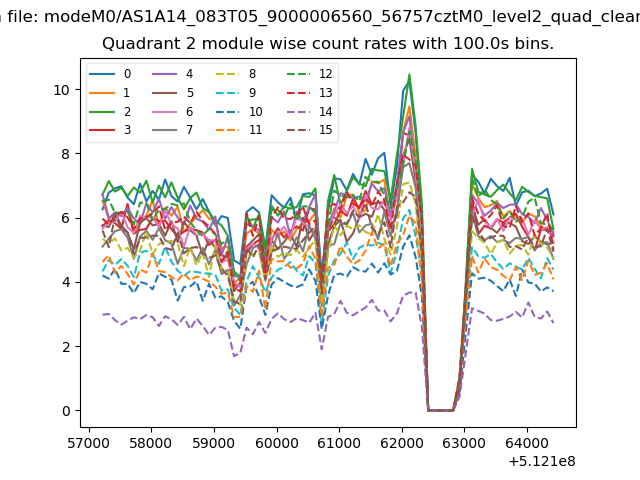
| Module-wise count rates for Quadrant B Data is divided into 100 sec bins |
 |
 |
| Module-wise count rates for Quadrant C Data is divided into 100 sec bins |
 |
 |
| Module-wise count rates for Quadrant D Data is divided into 100 sec bins |
 |
 |
| Parameter | Plot |
|---|---|
| CZT HV Monitor | 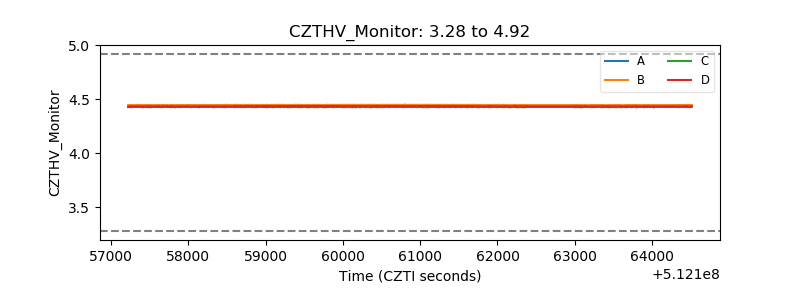 |
| D_VDD | 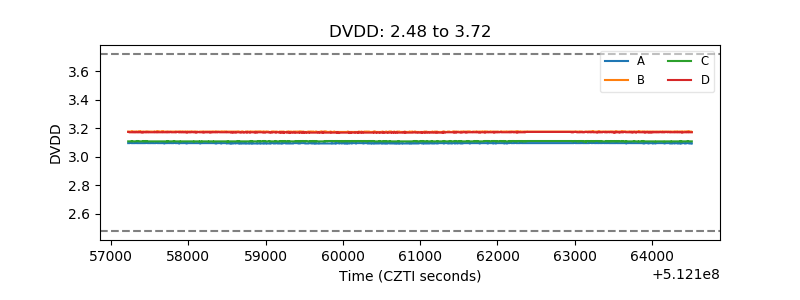 |
| Temperature 1 | 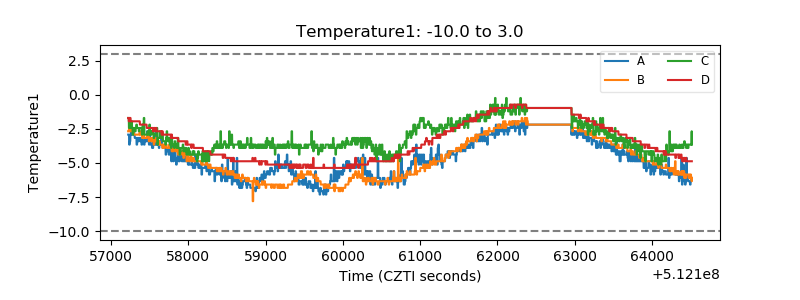 |
| Veto HV Monitor | 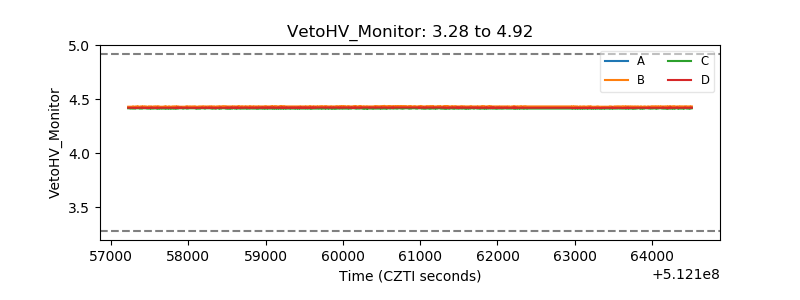 |
| Veto LLD | 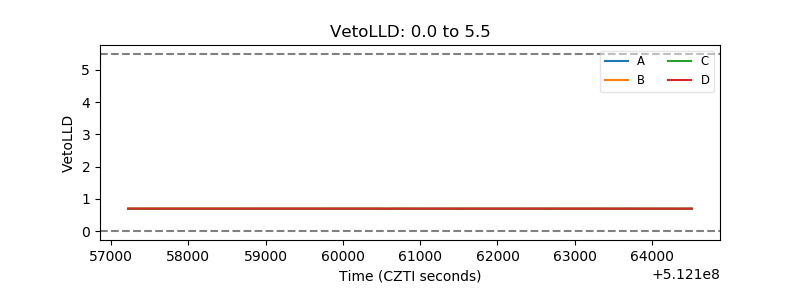 |
| Alpha Counter | 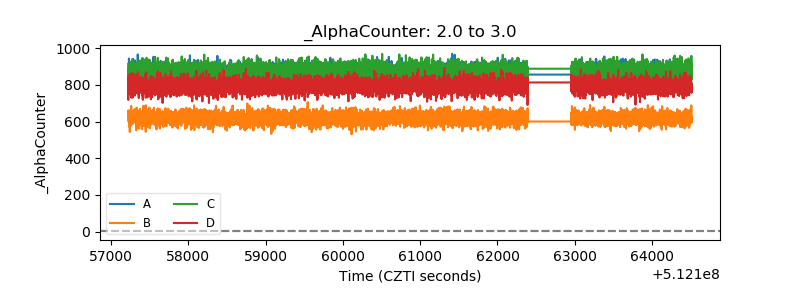 |
| _CPM_Rate | 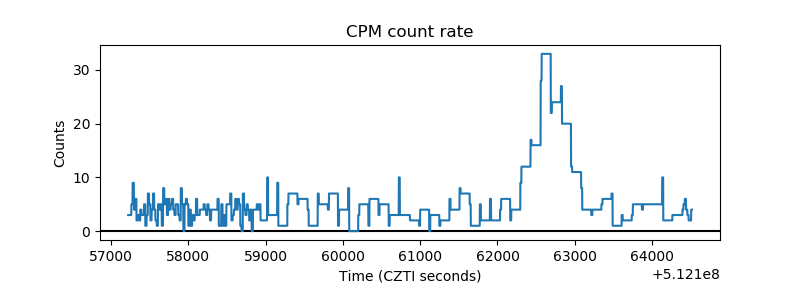 |
| CZT Counter | 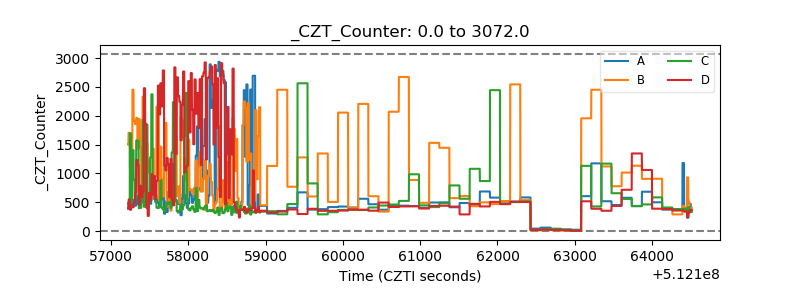 |
| +2.5 Volts monitor |  |
| +5 Volts monitor |  |
| _ROLL_ROT | 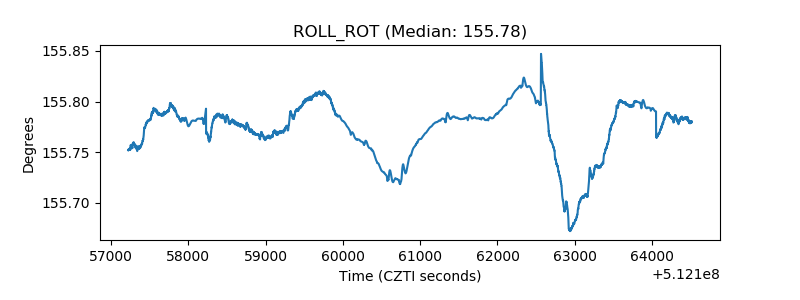 |
| _Roll_DEC | 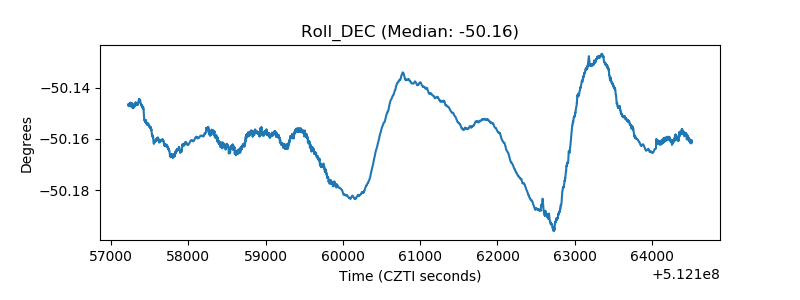 |
| _Roll_RA | 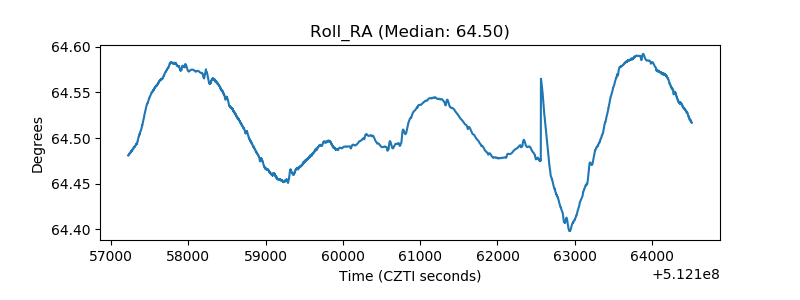 |
| Veto Counter | 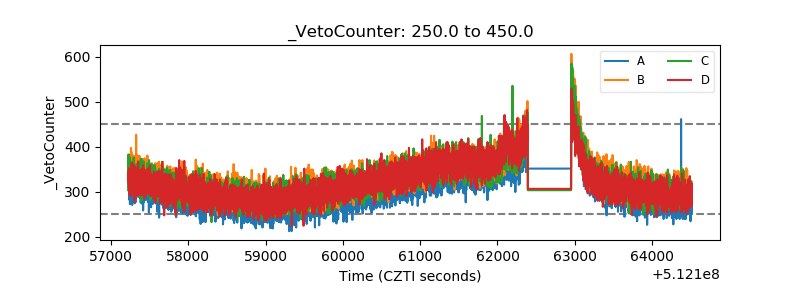 |