| Param | Original file | Final file |
|---|---|---|
| Filename | modeM0/AS1A14_083T05_9000006560_56758cztM0_level2.fits | modeM0/AS1A14_083T05_9000006560_56758cztM0_level2_quad_clean.evt |
| Size (bytes) | 567,097,920 | 105,105,600 |
| Size | 540.8 MB | 100.2 MB |
| Events in quadrant A | 4,426,949 | 698,663 |
| Events in quadrant B | 6,347,207 | 708,344 |
| Events in quadrant C | 5,978,623 | 612,488 |
| Events in quadrant D | 3,652,453 | 636,594 |
| Mode SS | |||
|---|---|---|---|
| Quadrant | BADHDUFLAG | Total packets | Discarded packets |
| A | 0 | 152 | 0 |
| B | 0 | 152 | 0 |
| C | 0 | 152 | 0 |
| D | 0 | 152 | 0 |
| Mode M0 | |||
|---|---|---|---|
| Quadrant | BADHDUFLAG | Total packets | Discarded packets |
| A | 0 | 18490 | 0 |
| B | 0 | 24070 | 0 |
| C | 0 | 23268 | 0 |
| D | 0 | 16667 | 0 |
| Quadrant | Total seconds | Saturated seconds | Saturation percentage |
|---|---|---|---|
| A | 7560 | 195 | 2.579365% |
| B | 7560 | 735 | 9.722222% |
| C | 7560 | 795 | 10.515873% |
| D | 7560 | 44 | 0.582011% |
Noise dominated data is calculated using 1-second bins in cleaned event files. If a bin has >2000 counts, and if more than 50% of those come from <1% of pixels, then it is considered to be noise-dominated and hence unusable.
| Quadrant | # 1 sec bins | Bins with >0 counts | Bins with >2000 counts | High rate bins dominated by noise | Noise dominated (total time) | Noise dominated (detector-on time) | Marked lightcurve |
|---|---|---|---|---|---|---|---|
| A | 7560 | 7560 | 129 | 129 | 1.71% | 1.71% | 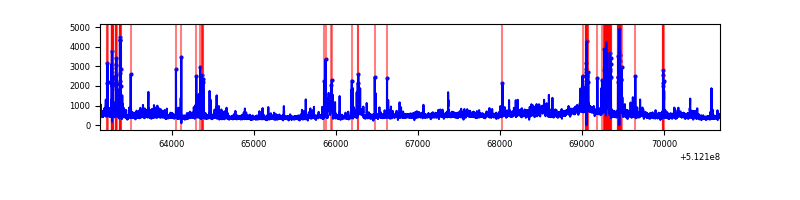 |
| B | 7560 | 7560 | 364 | 364 | 4.81% | 4.81% | 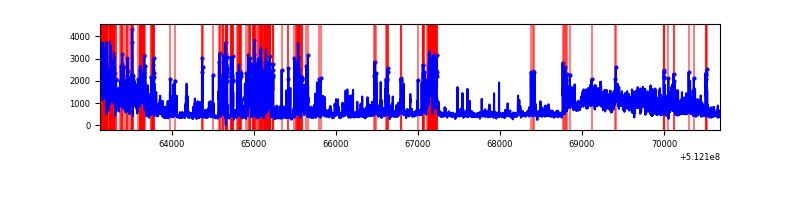 |
| C | 7560 | 7560 | 642 | 642 | 8.49% | 8.49% | 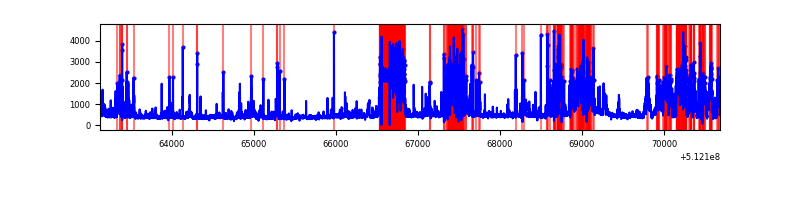 |
| D | 7560 | 7560 | 64 | 64 | 0.85% | 0.85% | 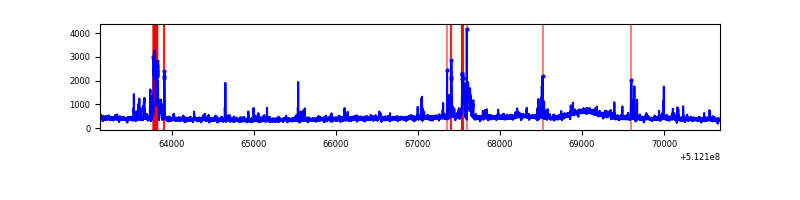 |
Top three noisy pixels from each quadrant. If the there are fewer than three noisy pixels in the level2.evt file, extra rows are filled as -1
| Pixel properties | Quadrant properties | ||||||
|---|---|---|---|---|---|---|---|
| Quadrant | DetID | PixID | Counts | Sigma | Mean | Median | Sigma |
| A | 3 | 14 | 551855 | 2797.58 | 794 | 774 | 197.0 |
| A | 3 | 62 | 399724 | 2025.28 | 794 | 774 | 197.0 |
| A | 10 | 251 | 209524 | 1059.73 | 794 | 774 | 197.0 |
| B | 4 | 206 | 1190399 | 7050.2 | 774 | 743 | 168.7 |
| B | 5 | 185 | 1186064 | 7024.51 | 774 | 743 | 168.7 |
| B | 8 | 128 | 530750 | 3140.96 | 774 | 743 | 168.7 |
| C | 14 | 96 | 942156 | 4750.97 | 730 | 724 | 198.2 |
| C | 15 | 230 | 938937 | 4734.73 | 730 | 724 | 198.2 |
| C | 13 | 3 | 903370 | 4555.24 | 730 | 724 | 198.2 |
| D | 2 | 252 | 301257 | 1369.54 | 773 | 736 | 219.4 |
| D | 5 | 173 | 78853 | 356.0 | 773 | 736 | 219.4 |
| D | 2 | 236 | 64811 | 292.0 | 773 | 736 | 219.4 |
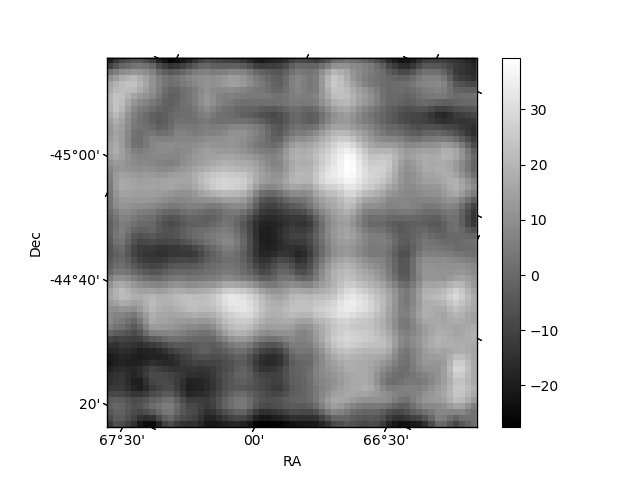
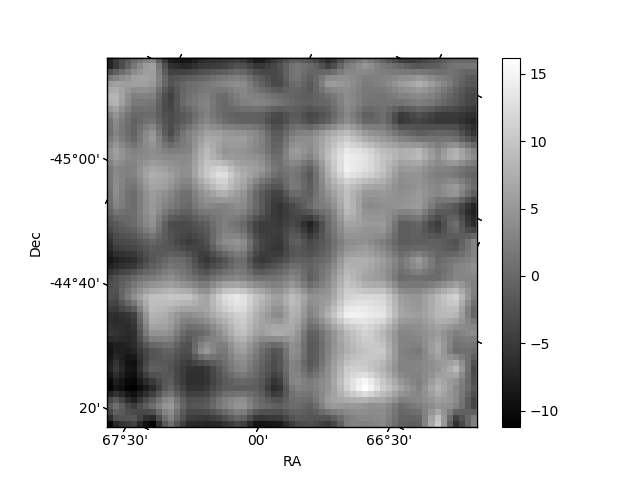
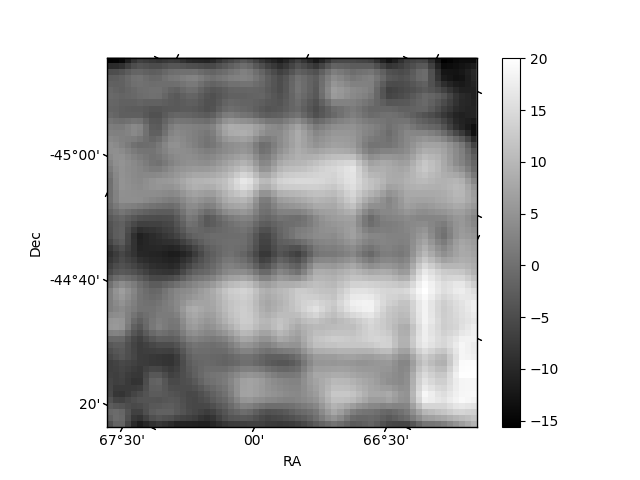
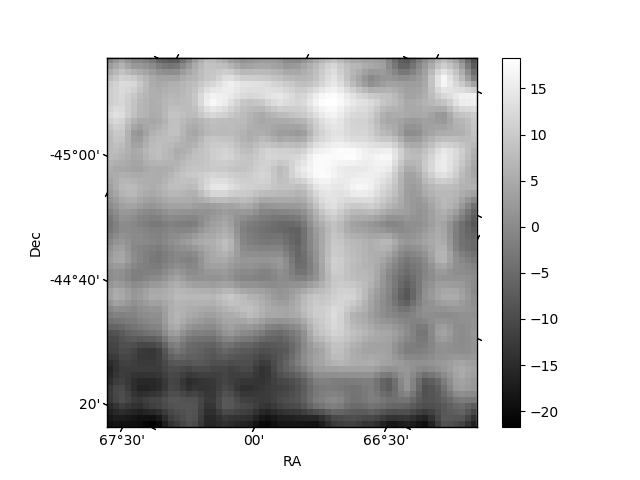
Histogram calculated using DETX and DETY for each event in the final _common_clean file
| Quadrant A | 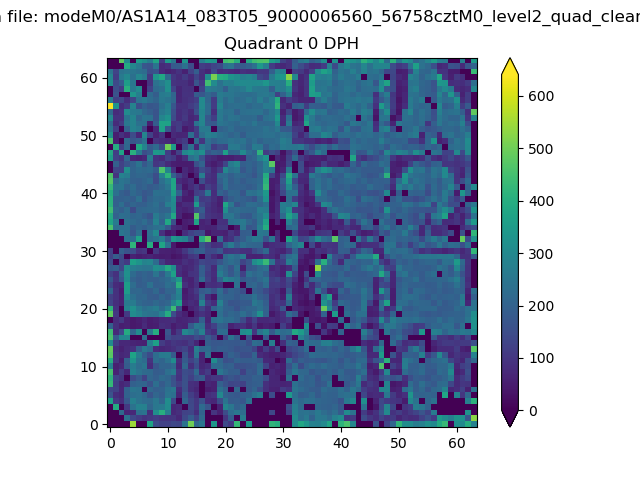 |
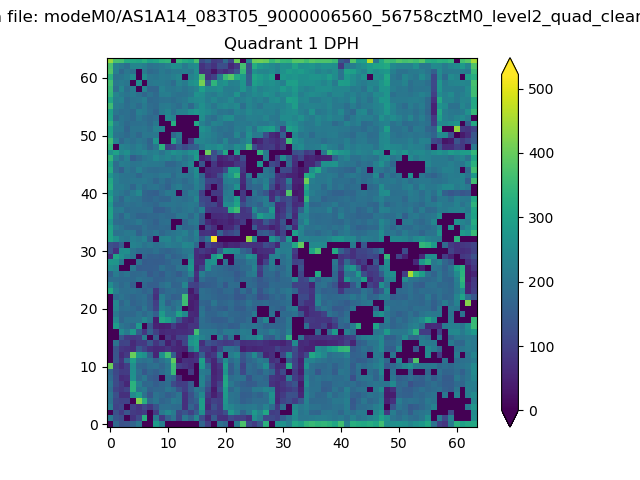 |
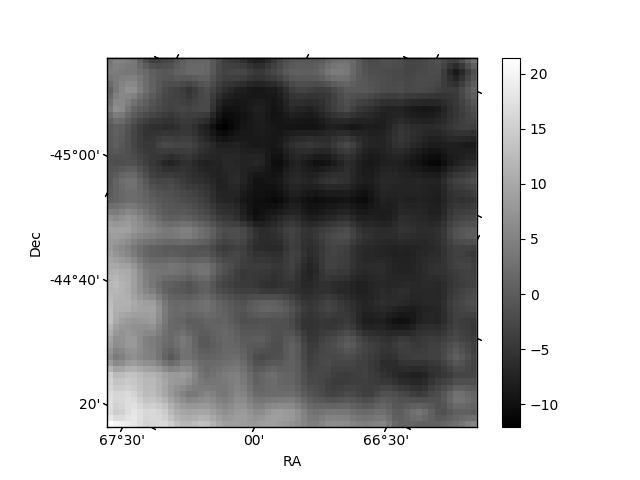
Quadrant B |
|---|---|---|---|
| Quadrant D | 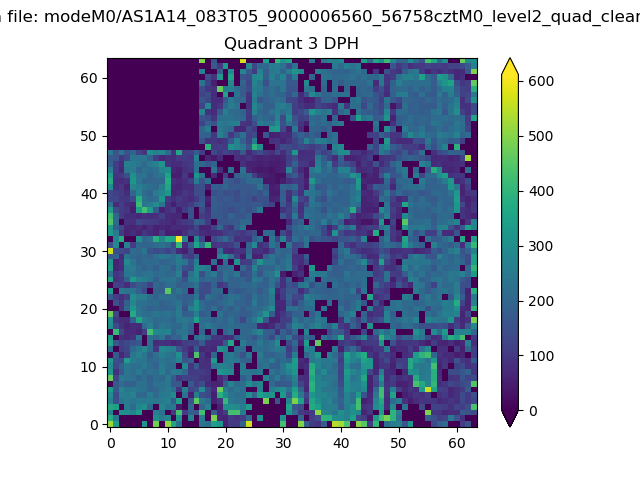 |
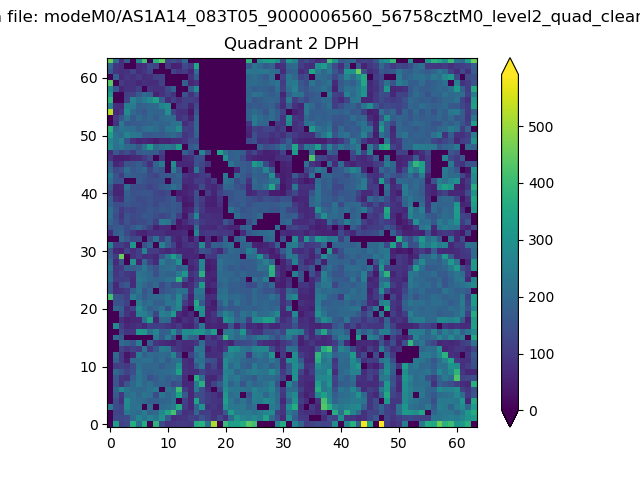 |
Quadrant C |
| Plot type | Count rate plots | Images |
|---|---|---|
| Comparison with Poisson distribution Blue bars denote a histogram of data divided into 1 sec bins. Red curve is a Poisson curve with rate = median count rate of data. |
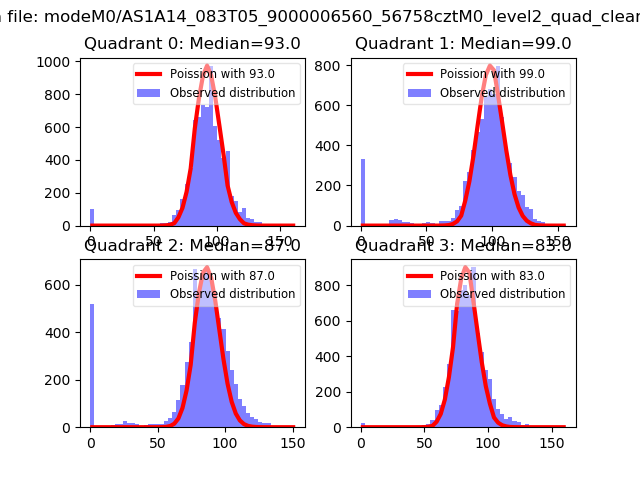 |
 |
| Quadrant-wise count rates Data is divided into 100 sec bins |
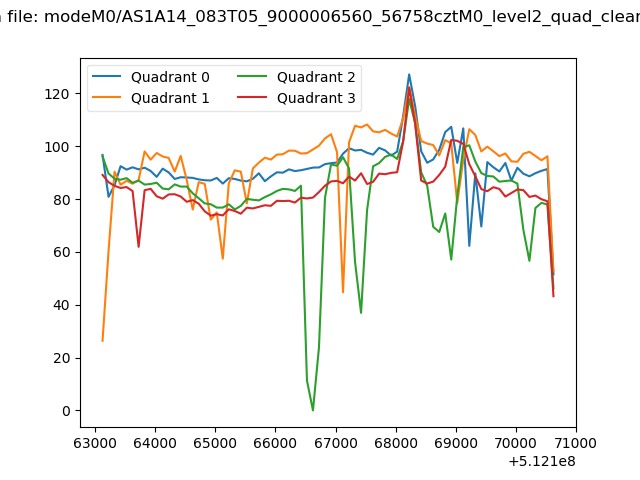 |
|
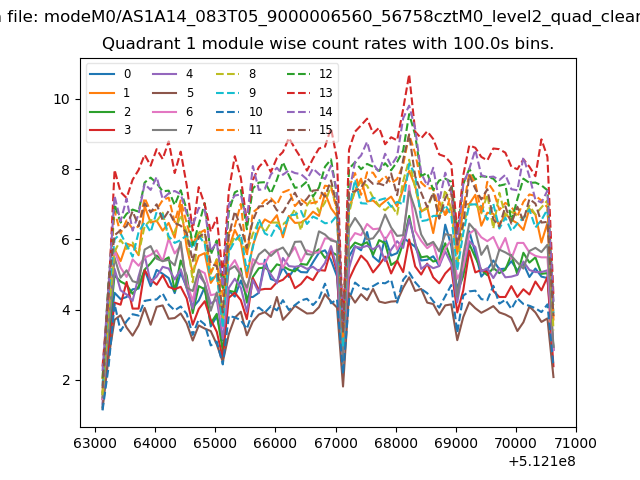
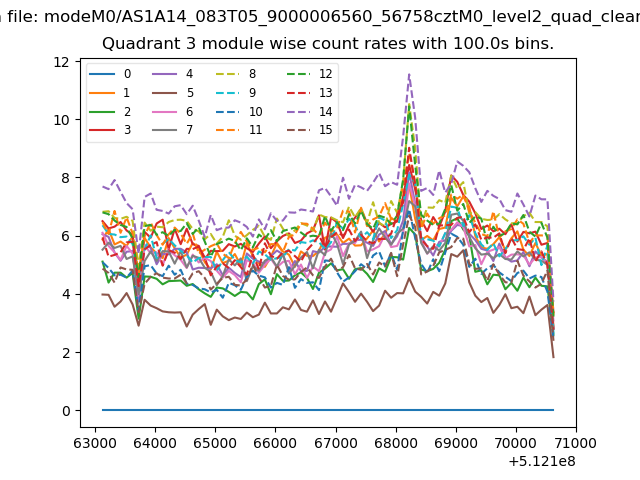
| Module-wise count rates for Quadrant A Data is divided into 100 sec bins |
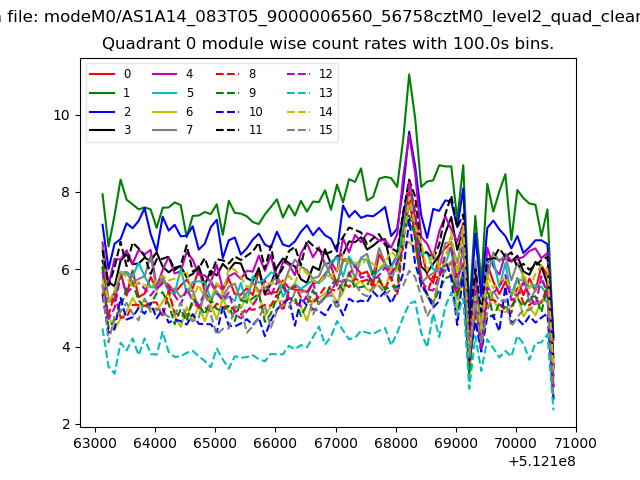 |
 |
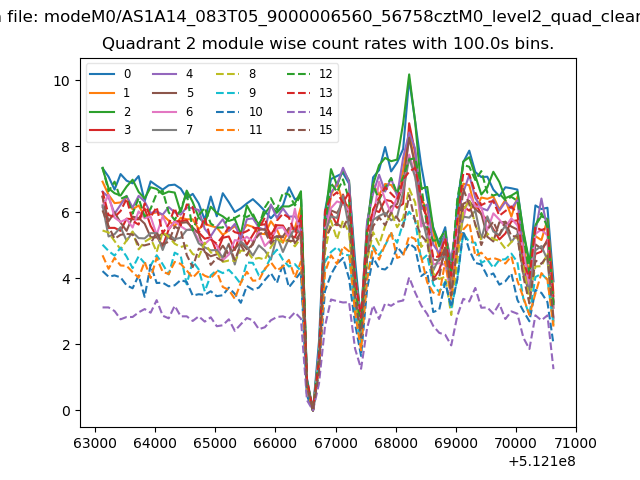
| Module-wise count rates for Quadrant B Data is divided into 100 sec bins |
 |
 |
| Module-wise count rates for Quadrant C Data is divided into 100 sec bins |
 |
 |
| Module-wise count rates for Quadrant D Data is divided into 100 sec bins |
 |
 |
| Parameter | Plot |
|---|---|
| CZT HV Monitor | 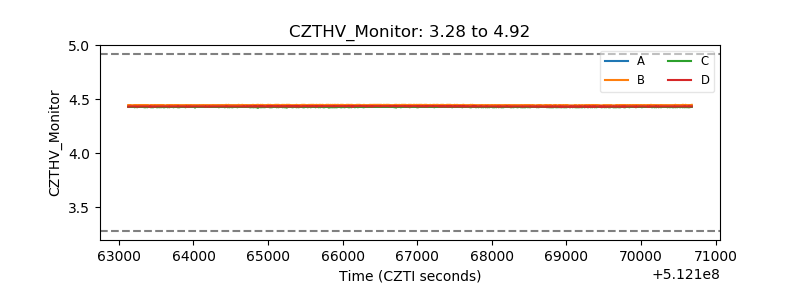 |
| D_VDD | 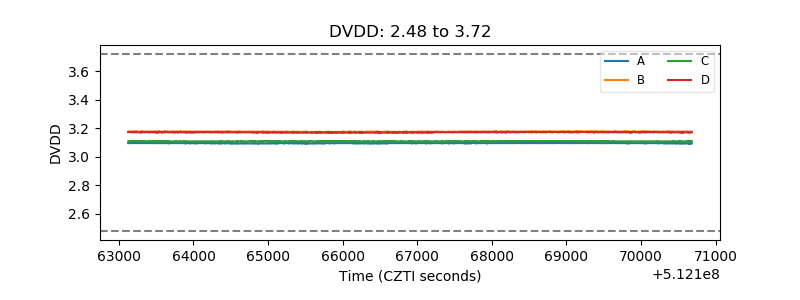 |
| Temperature 1 | 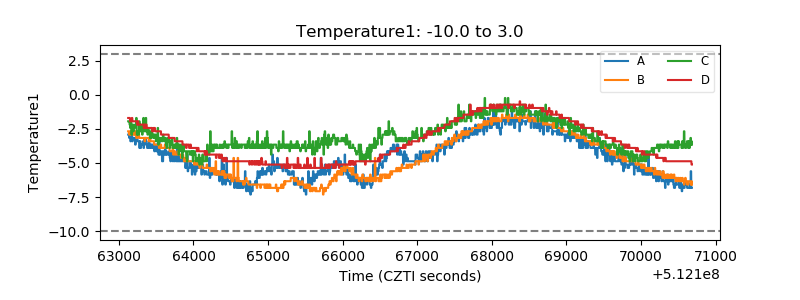 |
| Veto HV Monitor | 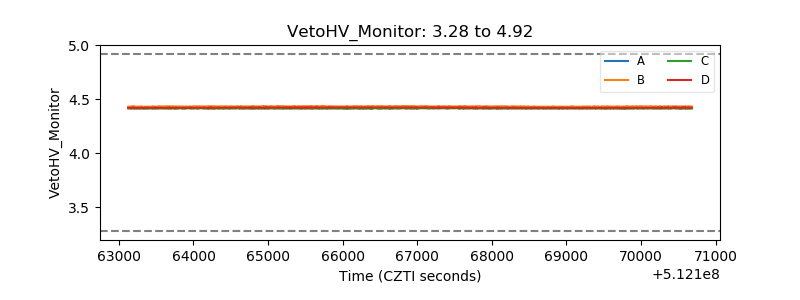 |
| Veto LLD | 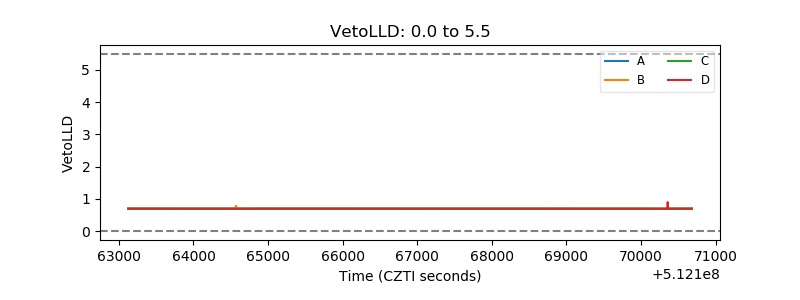 |
| Alpha Counter | 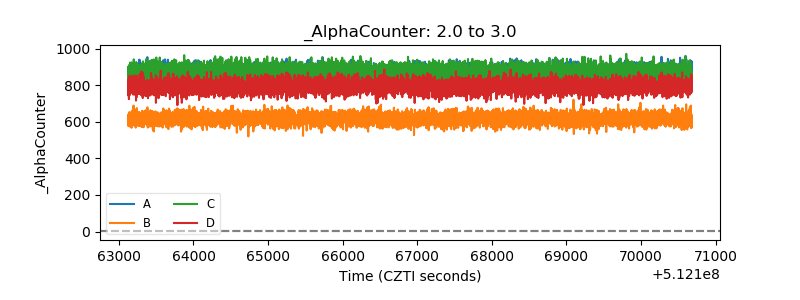 |
| _CPM_Rate | 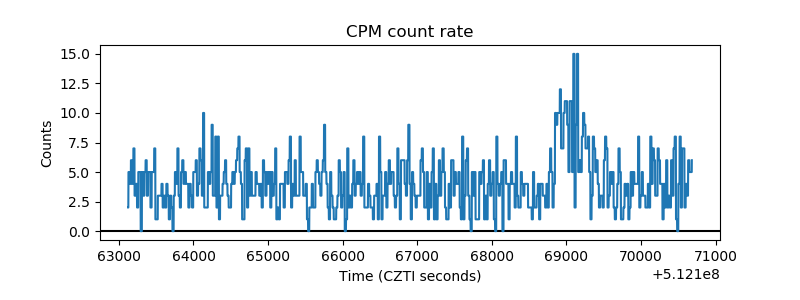 |
| CZT Counter | 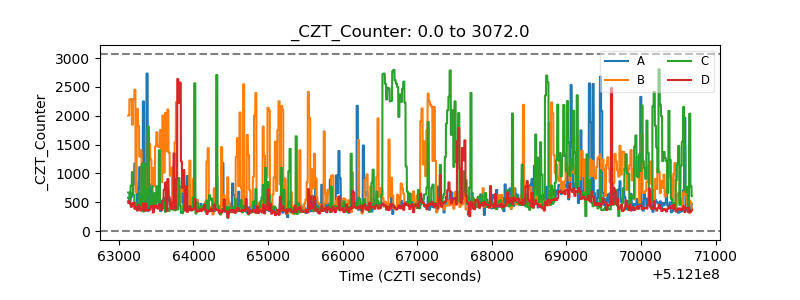 |
| +2.5 Volts monitor | 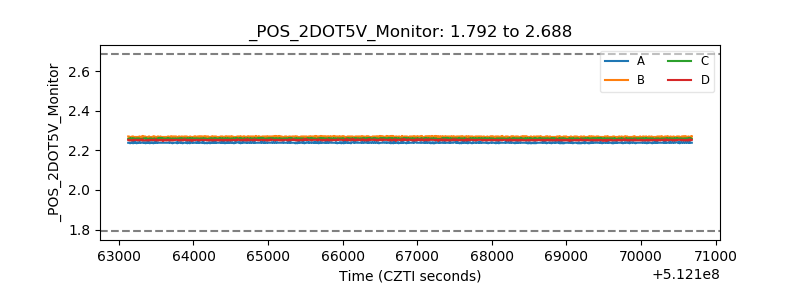 |
| +5 Volts monitor | 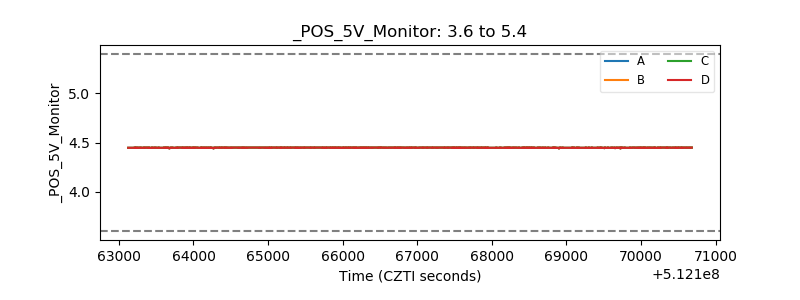 |
| _ROLL_ROT | 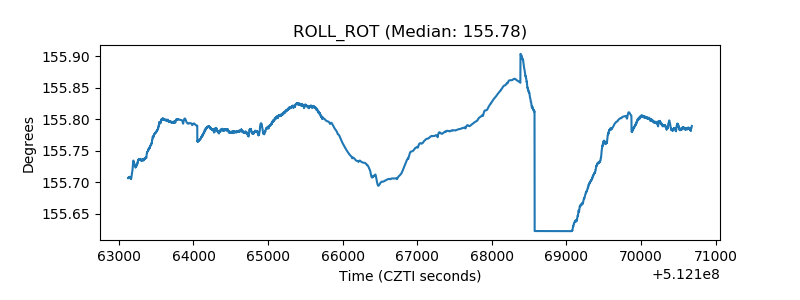 |
| _Roll_DEC | 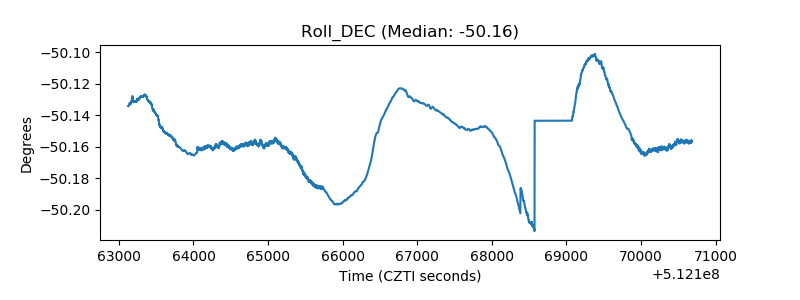 |
| _Roll_RA | 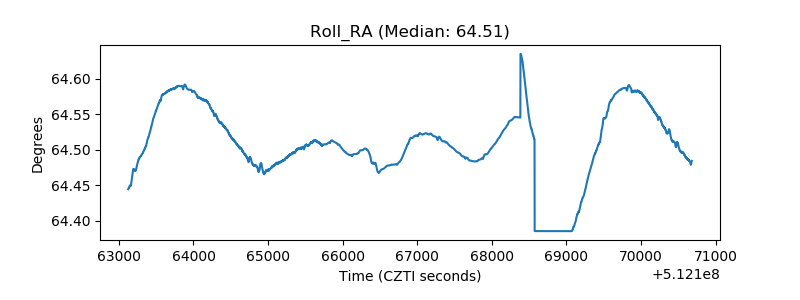 |
| Veto Counter | 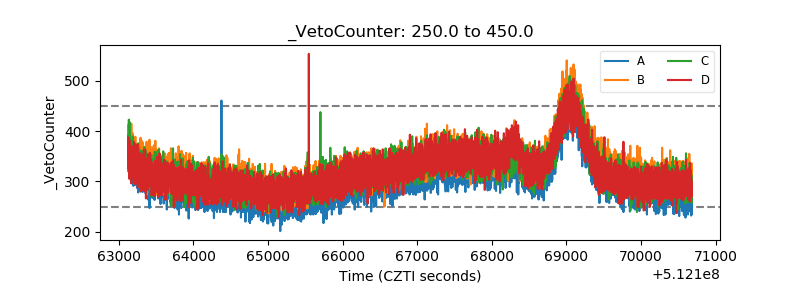 |