| Param | Original file | Final file |
|---|---|---|
| Filename | modeM0/AS1A14_083T05_9000006560_56759cztM0_level2.fits | modeM0/AS1A14_083T05_9000006560_56759cztM0_level2_quad_clean.evt |
| Size (bytes) | 541,431,360 | 111,294,720 |
| Size | 516.3 MB | 106.1 MB |
| Events in quadrant A | 4,805,024 | 728,157 |
| Events in quadrant B | 5,929,275 | 744,200 |
| Events in quadrant C | 5,098,843 | 685,320 |
| Events in quadrant D | 3,594,118 | 661,639 |
| Mode SS | |||
|---|---|---|---|
| Quadrant | BADHDUFLAG | Total packets | Discarded packets |
| A | 0 | 158 | 0 |
| B | 0 | 158 | 0 |
| C | 0 | 158 | 0 |
| D | 0 | 158 | 0 |
| Mode M0 | |||
|---|---|---|---|
| Quadrant | BADHDUFLAG | Total packets | Discarded packets |
| A | 0 | 19971 | 0 |
| B | 0 | 23290 | 0 |
| C | 0 | 21021 | 0 |
| D | 0 | 16814 | 0 |
| Quadrant | Total seconds | Saturated seconds | Saturation percentage |
|---|---|---|---|
| A | 7919 | 195 | 2.462432% |
| B | 7920 | 641 | 8.093434% |
| C | 7920 | 278 | 3.510101% |
| D | 7920 | 13 | 0.164141% |
Noise dominated data is calculated using 1-second bins in cleaned event files. If a bin has >2000 counts, and if more than 50% of those come from <1% of pixels, then it is considered to be noise-dominated and hence unusable.
| Quadrant | # 1 sec bins | Bins with >0 counts | Bins with >2000 counts | High rate bins dominated by noise | Noise dominated (total time) | Noise dominated (detector-on time) | Marked lightcurve |
|---|---|---|---|---|---|---|---|
| A | 7919 | 7919 | 144 | 144 | 1.82% | 1.82% | 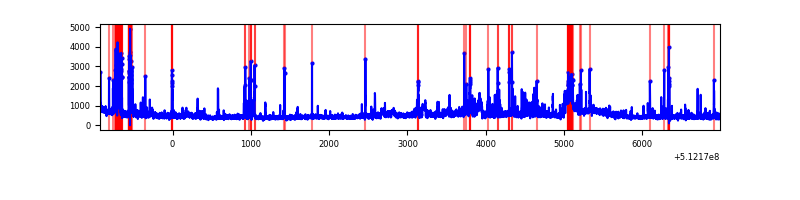 |
| B | 7920 | 7920 | 397 | 397 | 5.01% | 5.01% | 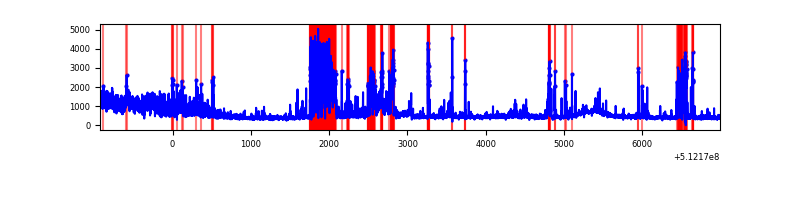 |
| C | 7920 | 7920 | 273 | 273 | 3.45% | 3.45% | 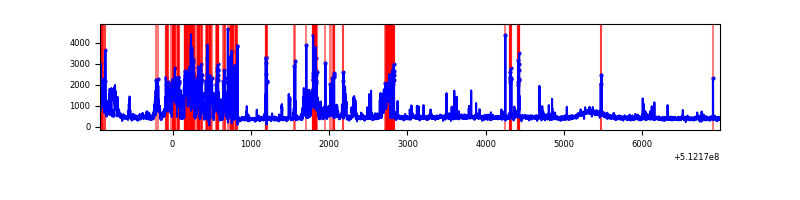 |
| D | 7920 | 7920 | 15 | 15 | 0.19% | 0.19% | 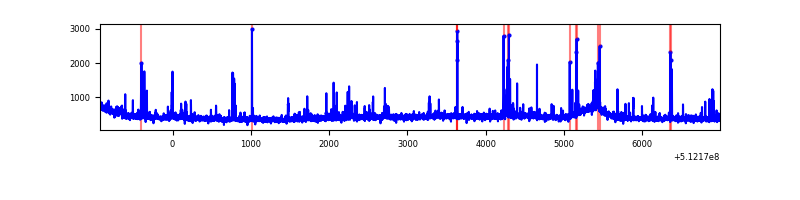 |
Top three noisy pixels from each quadrant. If the there are fewer than three noisy pixels in the level2.evt file, extra rows are filled as -1
| Pixel properties | Quadrant properties | ||||||
|---|---|---|---|---|---|---|---|
| Quadrant | DetID | PixID | Counts | Sigma | Mean | Median | Sigma |
| A | 3 | 14 | 573472 | 2778.72 | 834 | 814 | 206.1 |
| A | 3 | 62 | 347130 | 1680.44 | 834 | 814 | 206.1 |
| A | 8 | 249 | 312057 | 1510.25 | 834 | 814 | 206.1 |
| B | 8 | 128 | 1248689 | 7045.87 | 812 | 782 | 177.1 |
| B | 5 | 185 | 850658 | 4798.53 | 812 | 782 | 177.1 |
| B | 4 | 206 | 282557 | 1590.94 | 812 | 782 | 177.1 |
| C | 14 | 96 | 1269513 | 5768.66 | 805 | 797 | 219.9 |
| C | 13 | 3 | 405510 | 1840.17 | 805 | 797 | 219.9 |
| C | 6 | 223 | 62766 | 281.76 | 805 | 797 | 219.9 |
| D | 2 | 249 | 95110 | 412.1 | 810 | 774 | 228.9 |
| D | 5 | 173 | 82362 | 356.41 | 810 | 774 | 228.9 |
| D | 11 | 129 | 61133 | 263.67 | 810 | 774 | 228.9 |
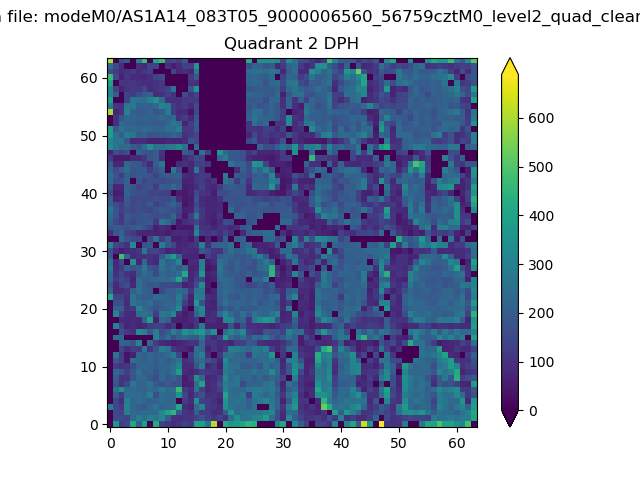
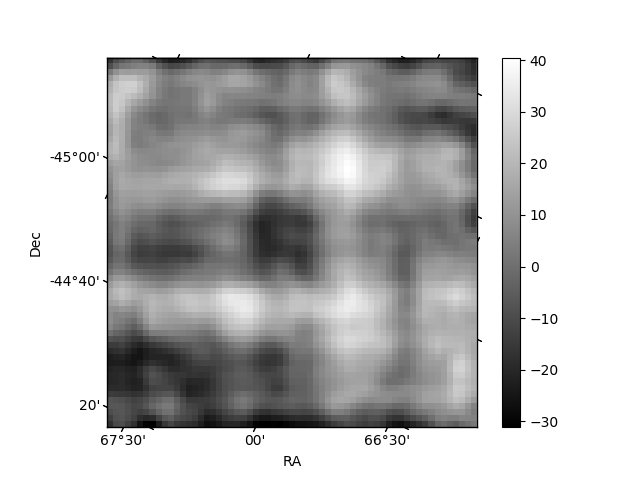
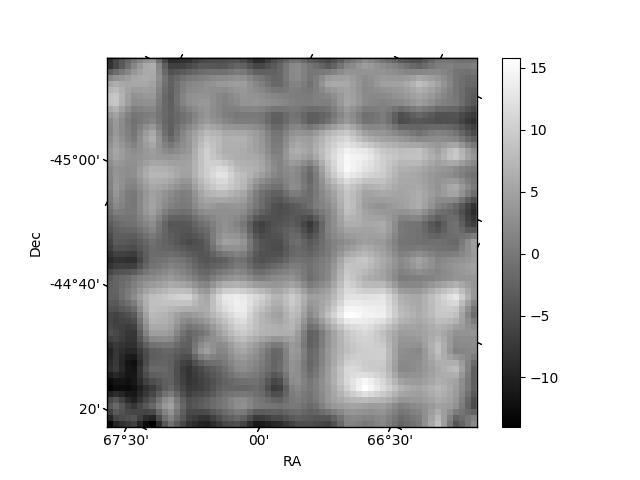
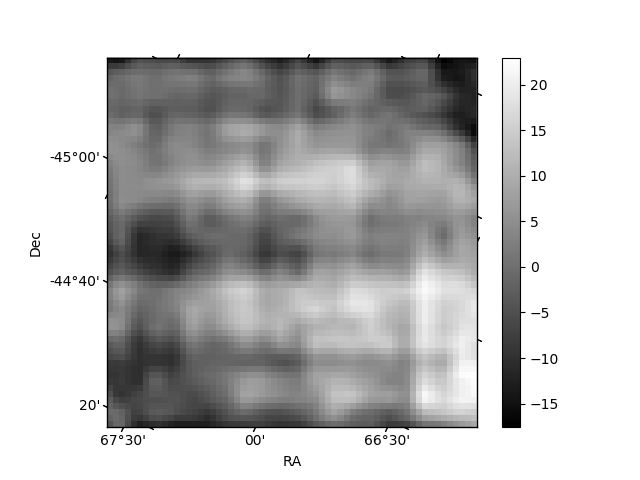
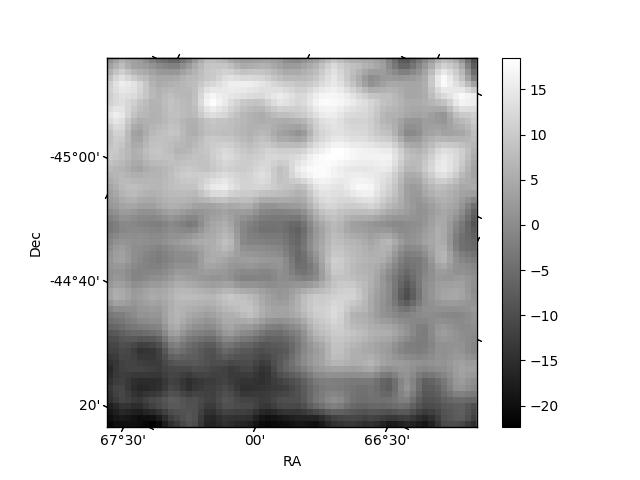
Histogram calculated using DETX and DETY for each event in the final _common_clean file
| Quadrant A | 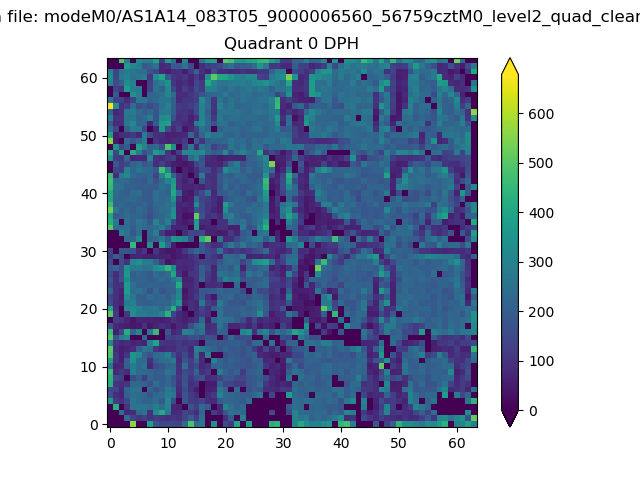 |
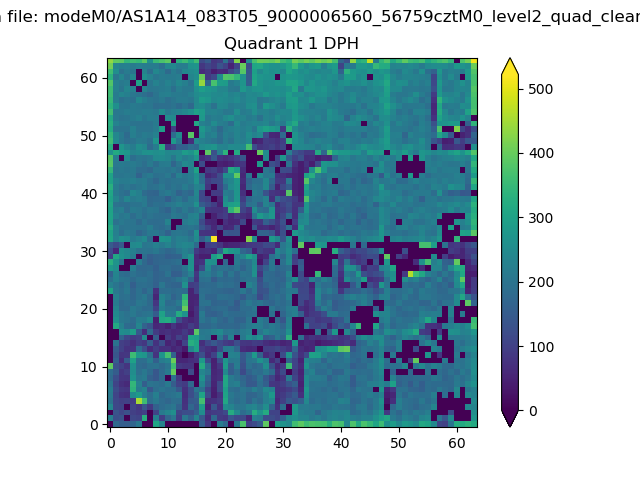 |
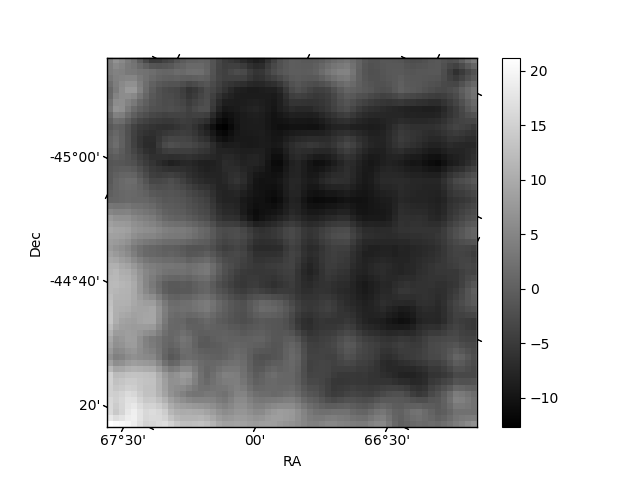
Quadrant B |
|---|---|---|---|
| Quadrant D | 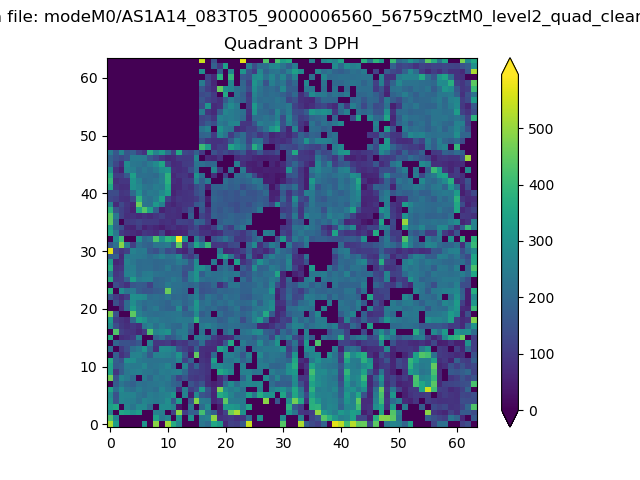 |
 |
Quadrant C |
| Plot type | Count rate plots | Images |
|---|---|---|
| Comparison with Poisson distribution Blue bars denote a histogram of data divided into 1 sec bins. Red curve is a Poisson curve with rate = median count rate of data. |
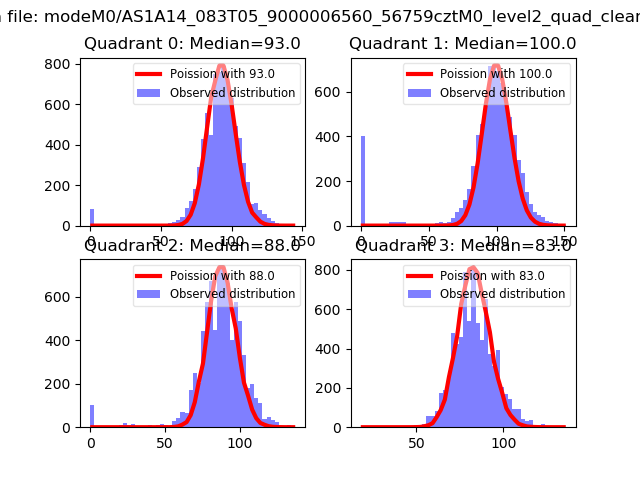 |
 |
| Quadrant-wise count rates Data is divided into 100 sec bins |
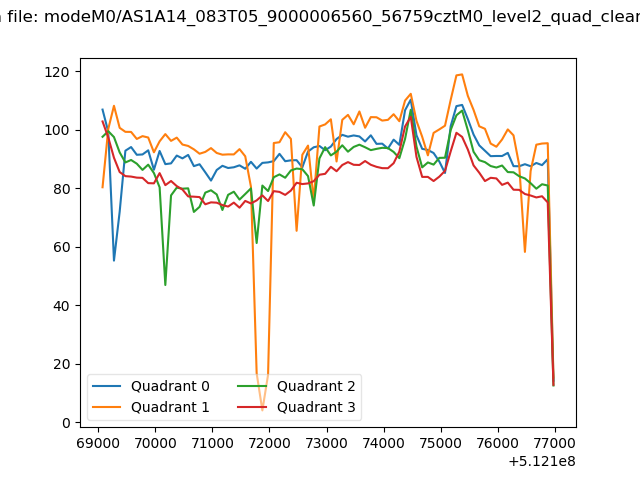 |
|
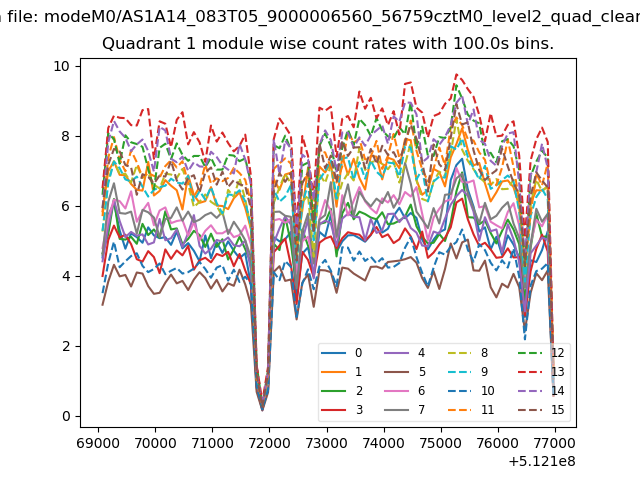
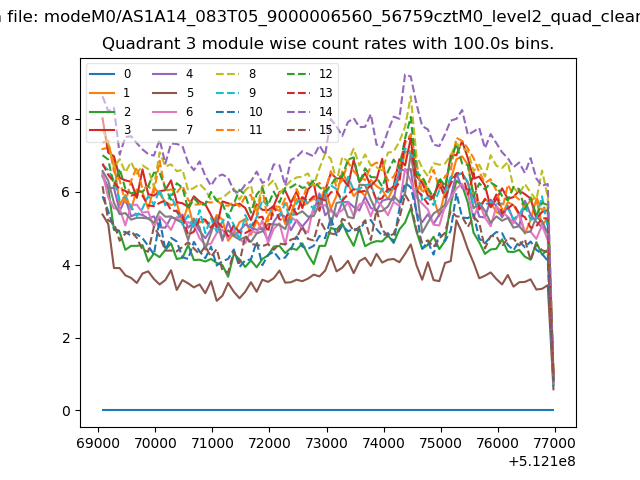
| Module-wise count rates for Quadrant A Data is divided into 100 sec bins |
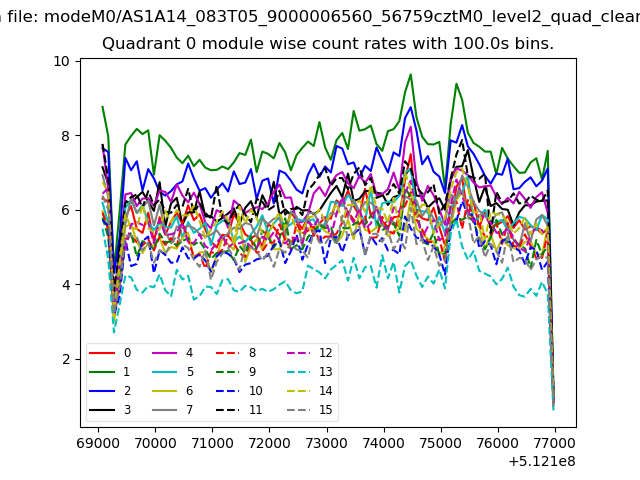 |
 |
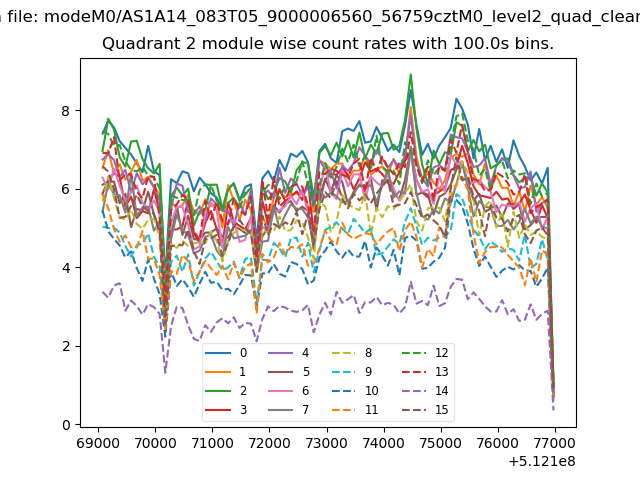
| Module-wise count rates for Quadrant B Data is divided into 100 sec bins |
 |
 |
| Module-wise count rates for Quadrant C Data is divided into 100 sec bins |
 |
 |
| Module-wise count rates for Quadrant D Data is divided into 100 sec bins |
 |
 |
| Parameter | Plot |
|---|---|
| CZT HV Monitor | 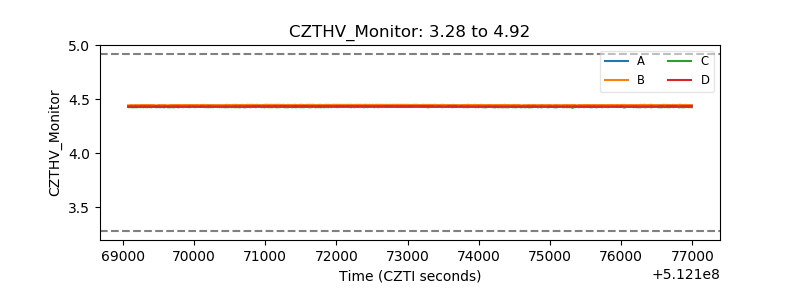 |
| D_VDD | 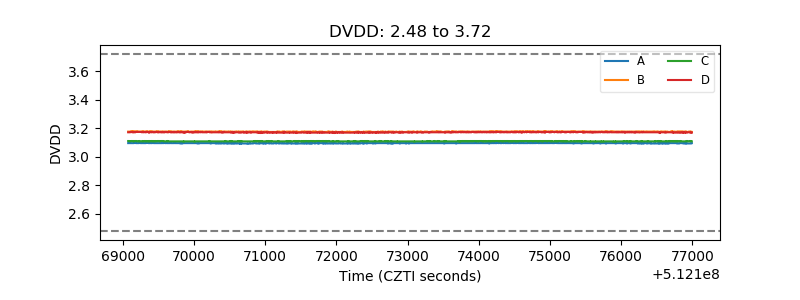 |
| Temperature 1 | 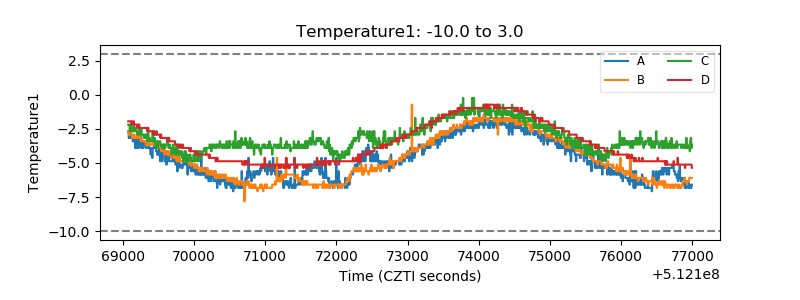 |
| Veto HV Monitor | 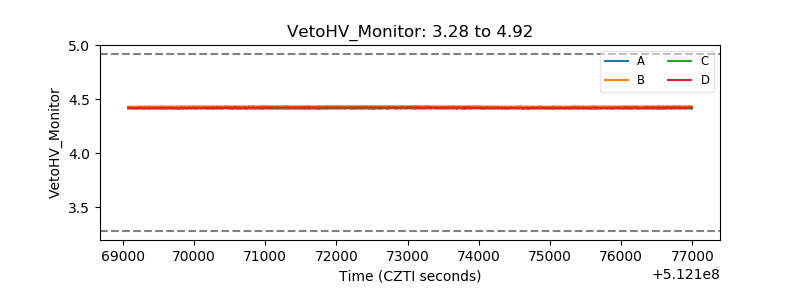 |
| Veto LLD | 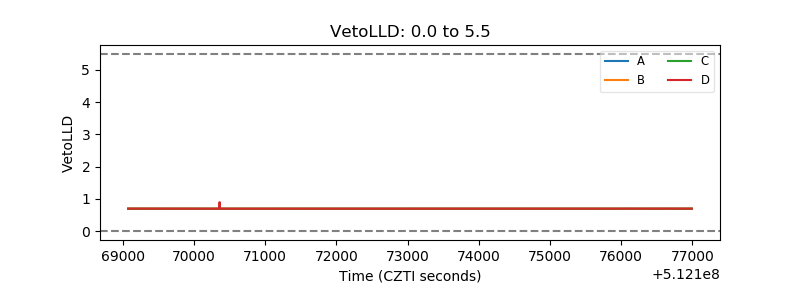 |
| Alpha Counter | 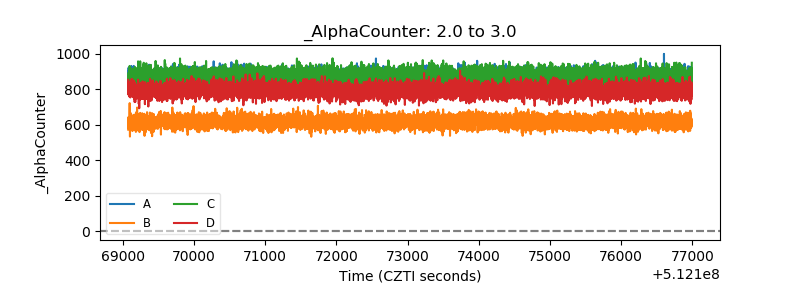 |
| _CPM_Rate | 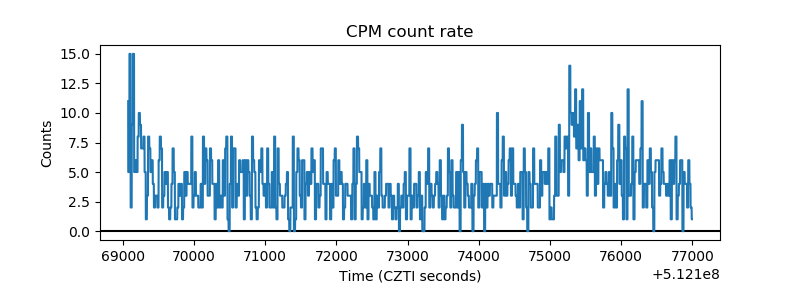 |
| CZT Counter | 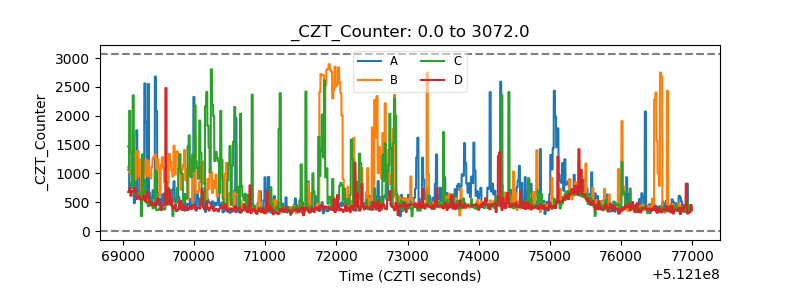 |
| +2.5 Volts monitor | 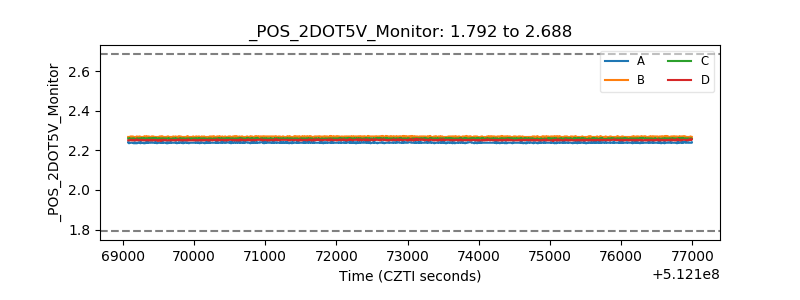 |
| +5 Volts monitor | 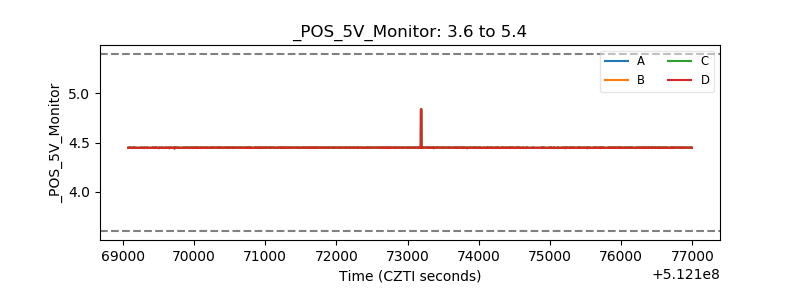 |
| _ROLL_ROT | 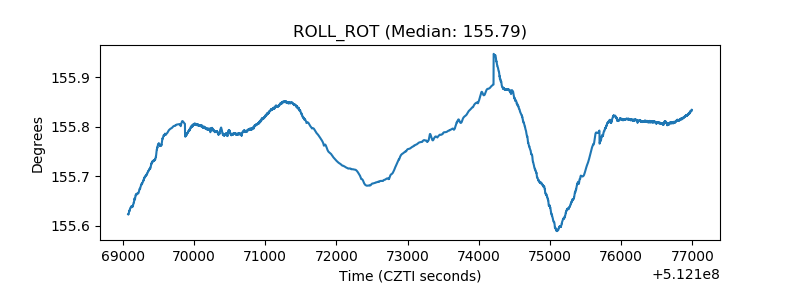 |
| _Roll_DEC | 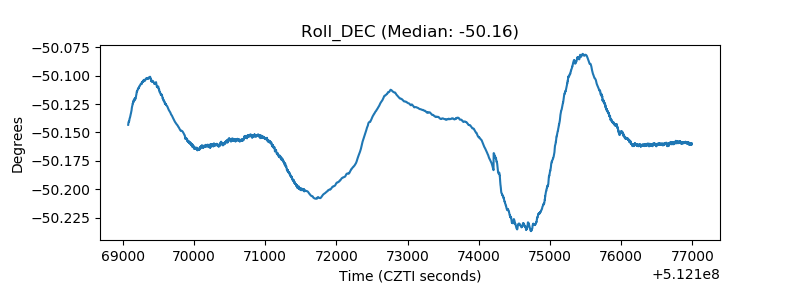 |
| _Roll_RA | 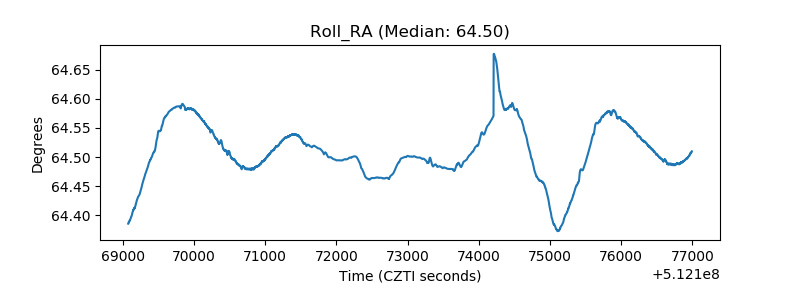 |
| Veto Counter | 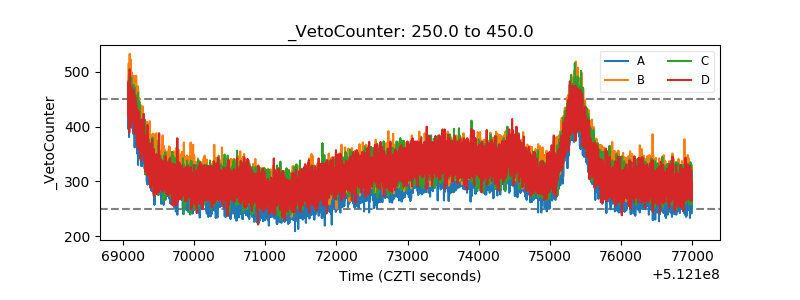 |