| Param | Original file | Final file |
|---|---|---|
| Filename | modeM0/AS1A14_083T05_9000006560_56763cztM0_level2.fits | modeM0/AS1A14_083T05_9000006560_56763cztM0_level2_quad_clean.evt |
| Size (bytes) | 1,550,534,400 | 358,879,680 |
| Size | 1.4 GB | 342.3 MB |
| Events in quadrant A | 14,552,996 | 2,341,459 |
| Events in quadrant B | 15,623,318 | 2,436,200 |
| Events in quadrant C | 12,568,209 | 2,225,334 |
| Events in quadrant D | 12,676,131 | 2,108,475 |
| Mode SS | |||
|---|---|---|---|
| Quadrant | BADHDUFLAG | Total packets | Discarded packets |
| A | 0 | 516 | 0 |
| B | 0 | 516 | 0 |
| C | 0 | 516 | 0 |
| D | 0 | 516 | 0 |
| Mode M0 | |||
|---|---|---|---|
| Quadrant | BADHDUFLAG | Total packets | Discarded packets |
| A | 0 | 60959 | 4 |
| B | 0 | 64399 | 4 |
| C | 0 | 56620 | 4 |
| D | 0 | 56887 | 4 |
| Mode M9 | |||
|---|---|---|---|
| Quadrant | BADHDUFLAG | Total packets | Discarded packets |
| A | 0 | 16 | 0 |
| B | 0 | 16 | 0 |
| C | 0 | 16 | 0 |
| D | 0 | 16 | 0 |
| Quadrant | Total seconds | Saturated seconds | Saturation percentage |
|---|---|---|---|
| A | 25504 | 659 | 2.583908% |
| B | 25504 | 1600 | 6.273526% |
| C | 25503 | 647 | 2.536956% |
| D | 25503 | 549 | 2.152688% |
Noise dominated data is calculated using 1-second bins in cleaned event files. If a bin has >2000 counts, and if more than 50% of those come from <1% of pixels, then it is considered to be noise-dominated and hence unusable.
| Quadrant | # 1 sec bins | Bins with >0 counts | Bins with >2000 counts | High rate bins dominated by noise | Noise dominated (total time) | Noise dominated (detector-on time) | Marked lightcurve |
|---|---|---|---|---|---|---|---|
| A | 27074 | 25507 | 246 | 246 | 0.91% | 0.96% | 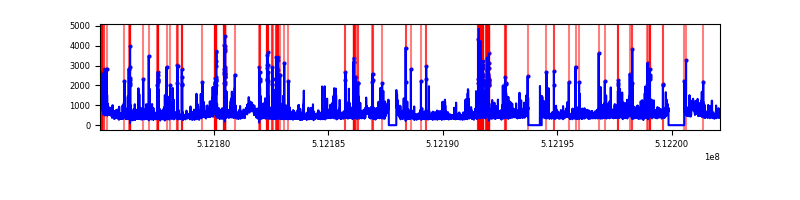 |
| B | 27074 | 25507 | 803 | 803 | 2.97% | 3.15% | 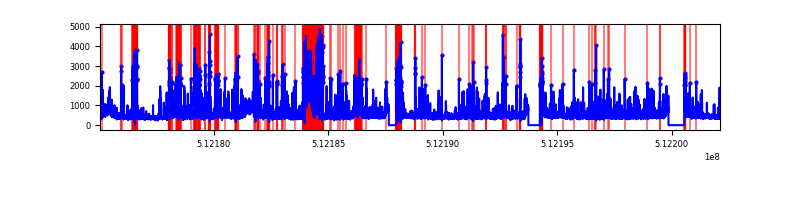 |
| C | 27073 | 25507 | 178 | 178 | 0.66% | 0.70% | 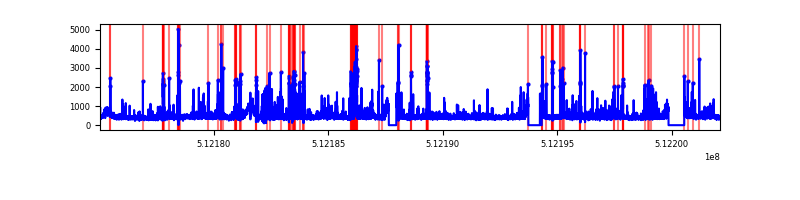 |
| D | 27073 | 25507 | 195 | 195 | 0.72% | 0.76% | 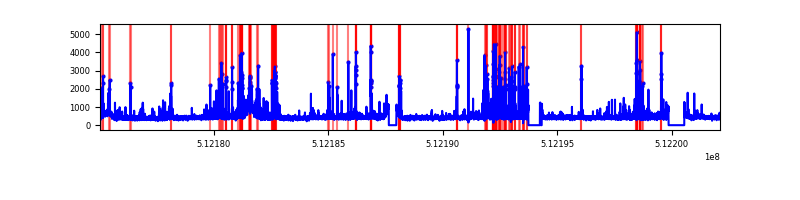 |
Top three noisy pixels from each quadrant. If the there are fewer than three noisy pixels in the level2.evt file, extra rows are filled as -1
| Pixel properties | Quadrant properties | ||||||
|---|---|---|---|---|---|---|---|
| Quadrant | DetID | PixID | Counts | Sigma | Mean | Median | Sigma |
| A | 3 | 14 | 1646605 | 2440.99 | 2743 | 2678 | 673.5 |
| A | 10 | 251 | 817012 | 1209.16 | 2743 | 2678 | 673.5 |
| A | 3 | 62 | 703569 | 1040.72 | 2743 | 2678 | 673.5 |
| B | 8 | 128 | 1708254 | 2979.4 | 2667 | 2566 | 572.5 |
| B | 5 | 185 | 850818 | 1481.68 | 2667 | 2566 | 572.5 |
| B | 4 | 206 | 821722 | 1430.86 | 2667 | 2566 | 572.5 |
| C | 13 | 3 | 469861 | 640.63 | 2675 | 2652 | 729.3 |
| C | 14 | 254 | 289181 | 392.88 | 2675 | 2652 | 729.3 |
| C | 6 | 223 | 237415 | 321.9 | 2675 | 2652 | 729.3 |
| D | 2 | 120 | 904270 | 1210.24 | 2668 | 2546 | 745.1 |
| D | 2 | 249 | 447026 | 596.55 | 2668 | 2546 | 745.1 |
| D | 5 | 173 | 262194 | 348.48 | 2668 | 2546 | 745.1 |
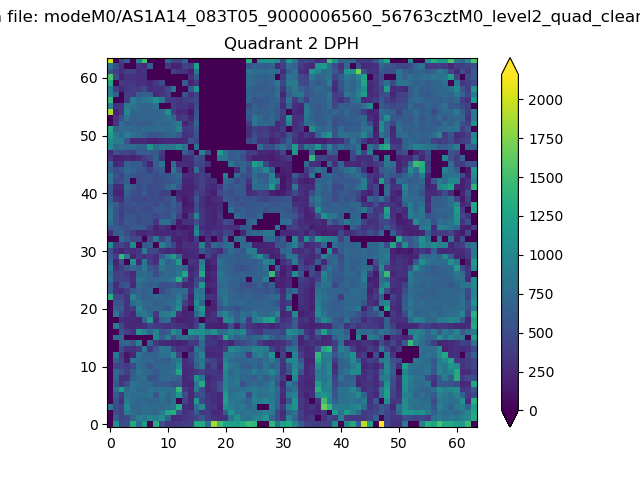
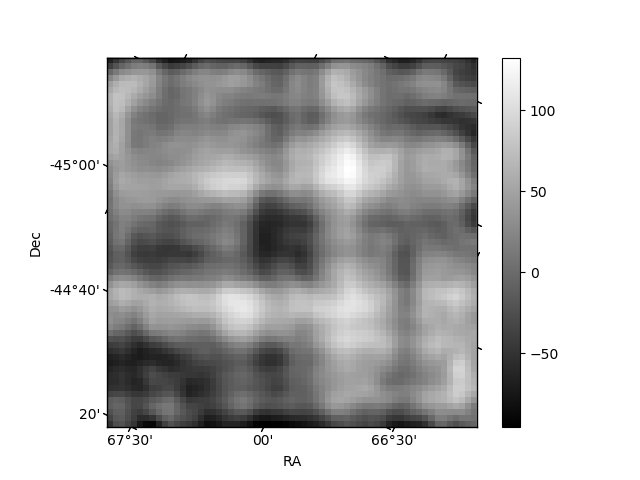
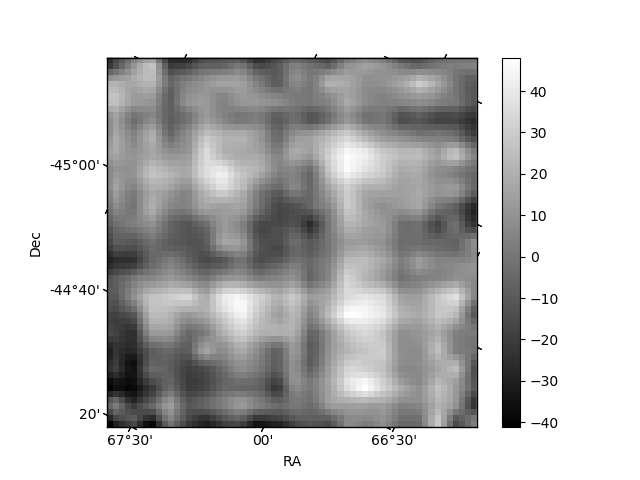
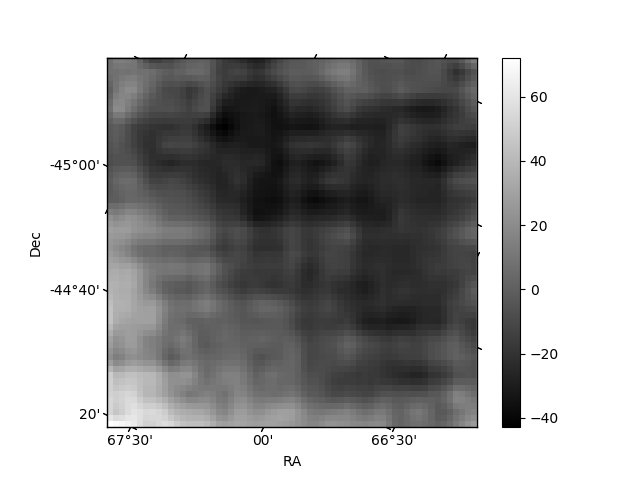
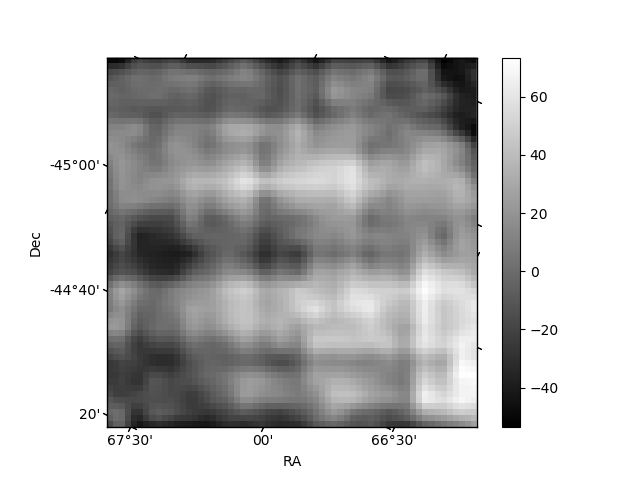
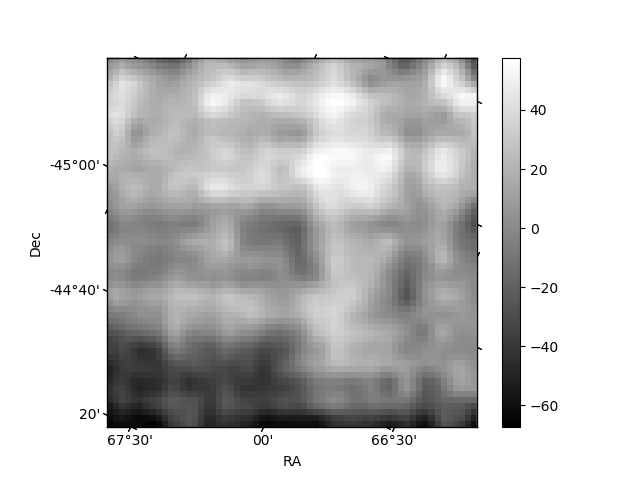
Histogram calculated using DETX and DETY for each event in the final _common_clean file
| Quadrant A | 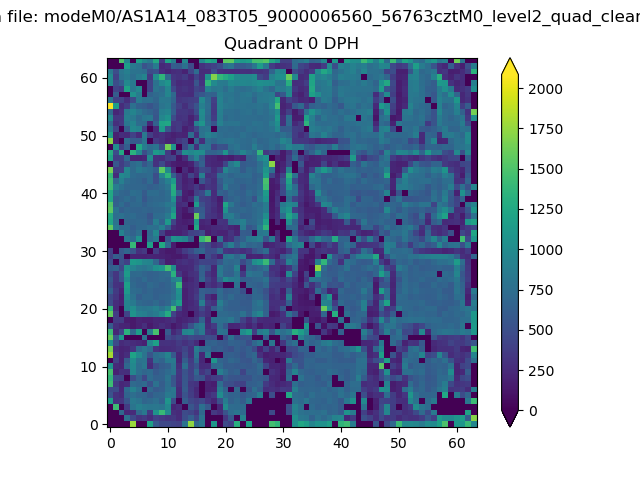 |
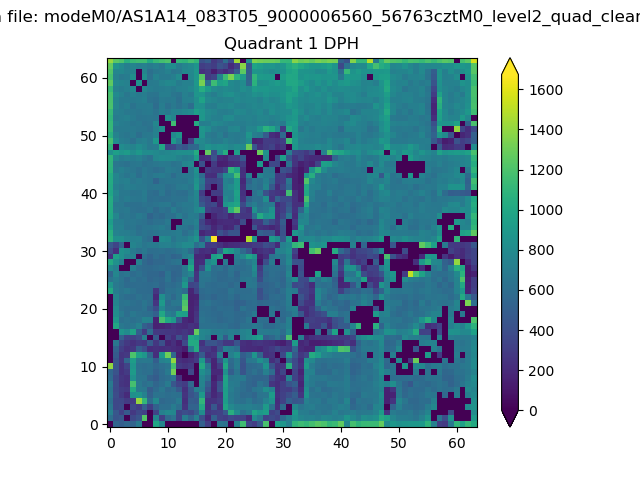 |
Quadrant B |
|---|---|---|---|
| Quadrant D | 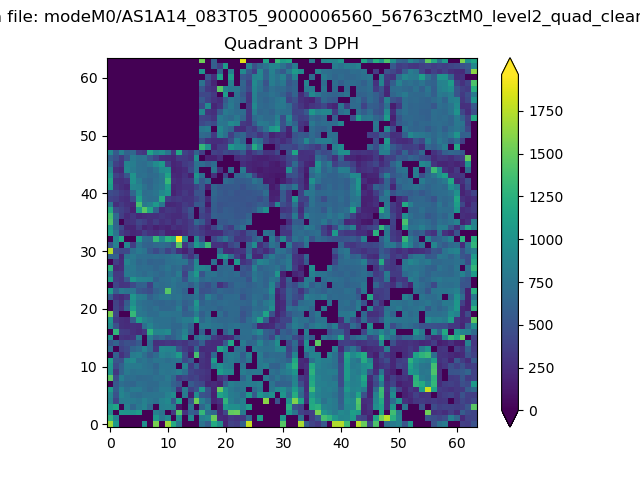 |
 |
Quadrant C |
| Plot type | Count rate plots | Images |
|---|---|---|
| Comparison with Poisson distribution Blue bars denote a histogram of data divided into 1 sec bins. Red curve is a Poisson curve with rate = median count rate of data. |
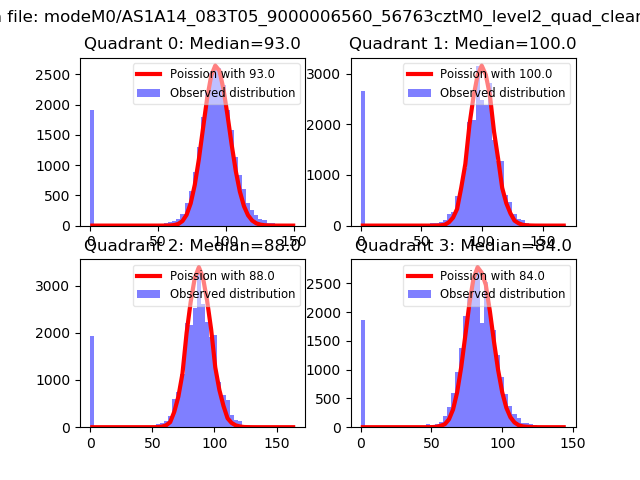 |
 |
| Quadrant-wise count rates Data is divided into 100 sec bins |
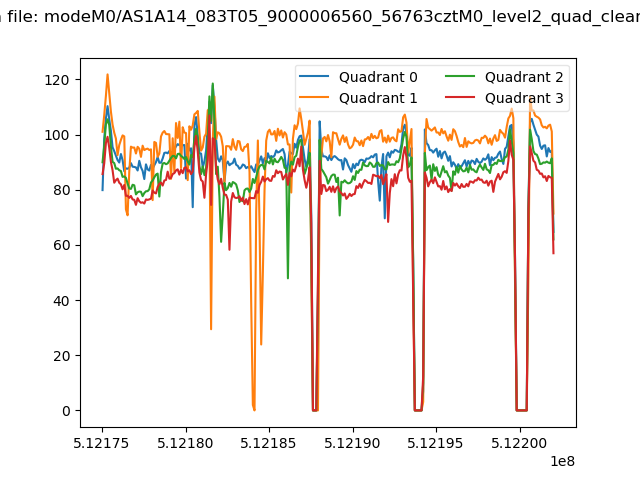 |
|
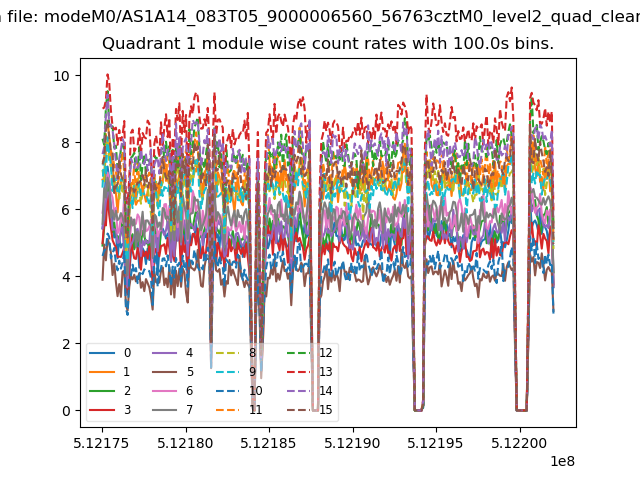
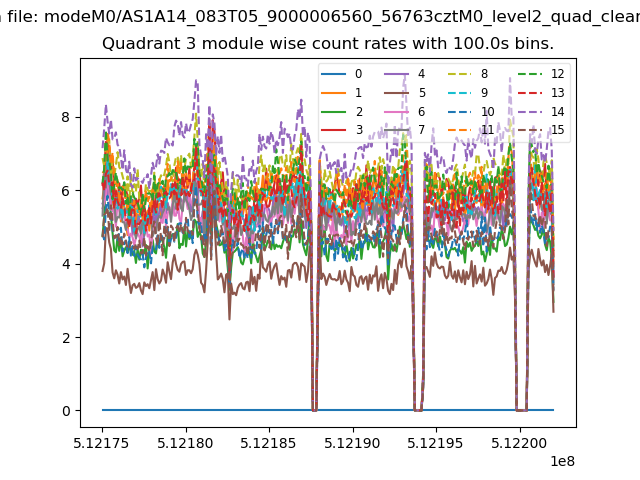
| Module-wise count rates for Quadrant A Data is divided into 100 sec bins |
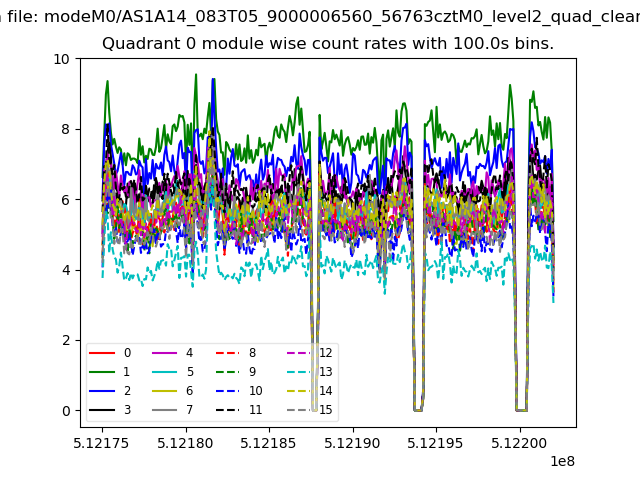 |
 |
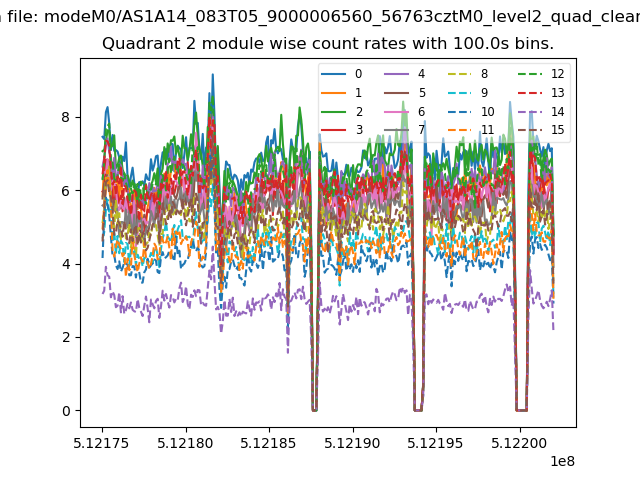
| Module-wise count rates for Quadrant B Data is divided into 100 sec bins |
 |
 |
| Module-wise count rates for Quadrant C Data is divided into 100 sec bins |
 |
 |
| Module-wise count rates for Quadrant D Data is divided into 100 sec bins |
 |
 |
| Parameter | Plot |
|---|---|
| CZT HV Monitor | 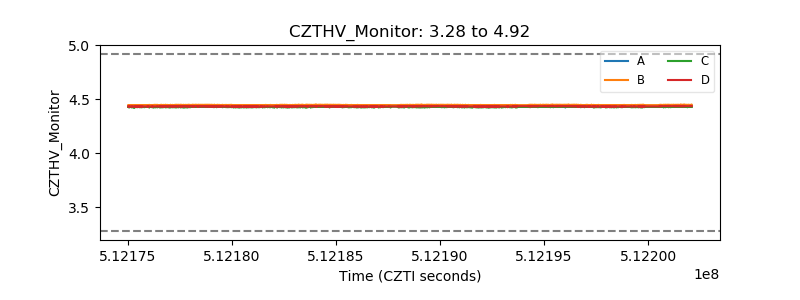 |
| D_VDD | 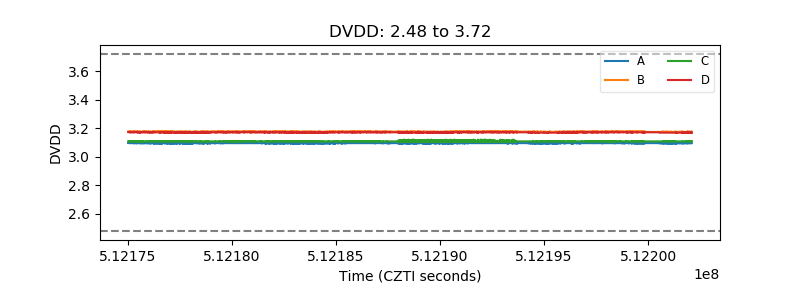 |
| Temperature 1 | 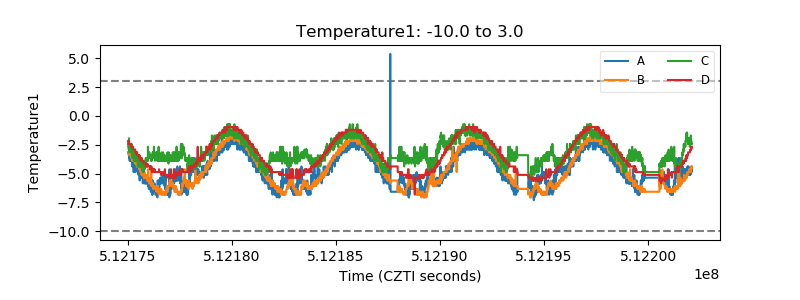 |
| Veto HV Monitor | 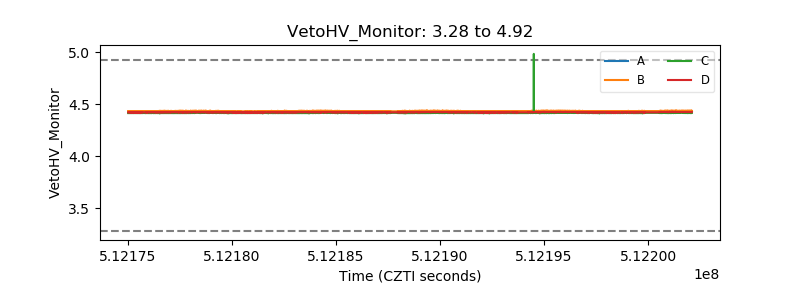 |
| Veto LLD | 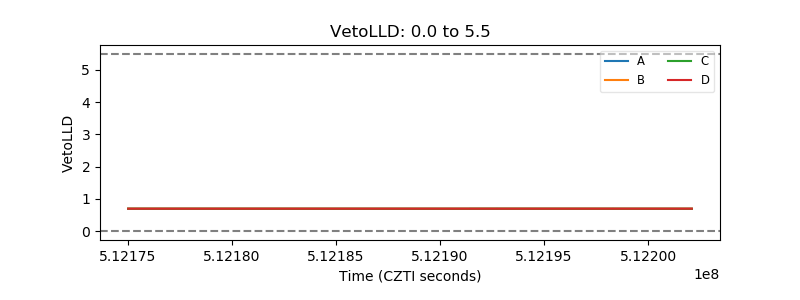 |
| Alpha Counter | 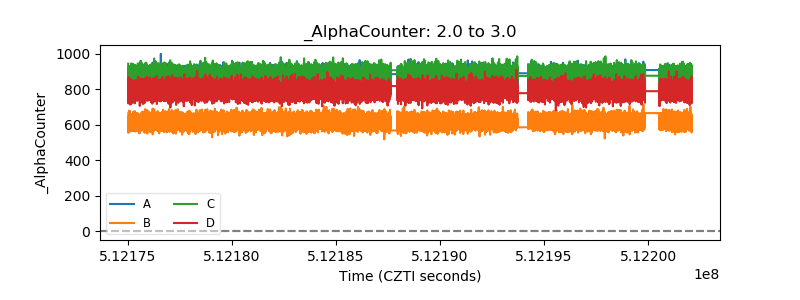 |
| _CPM_Rate | 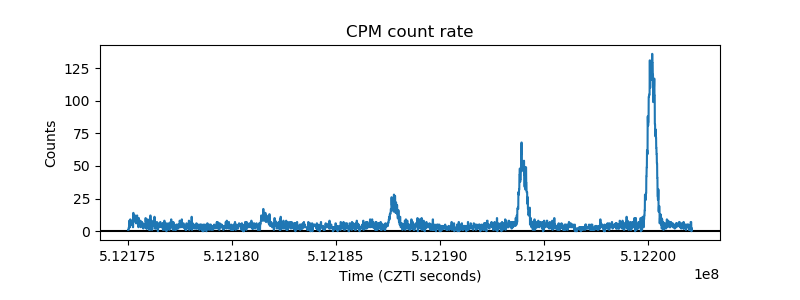 |
| CZT Counter | 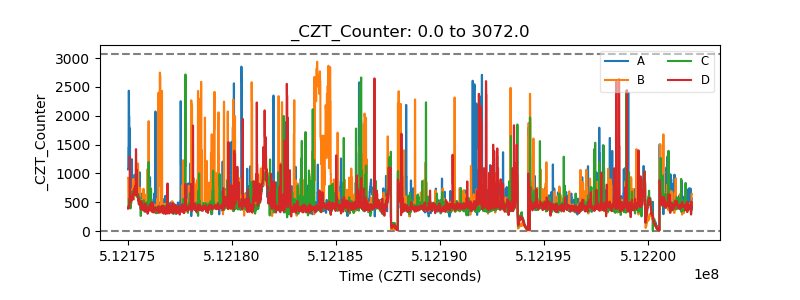 |
| +2.5 Volts monitor |  |
| +5 Volts monitor |  |
| _ROLL_ROT | 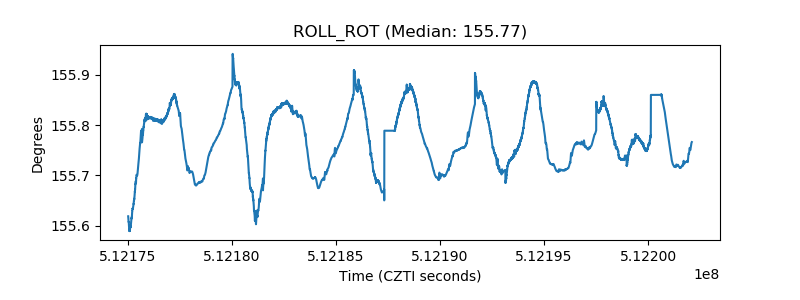 |
| _Roll_DEC | 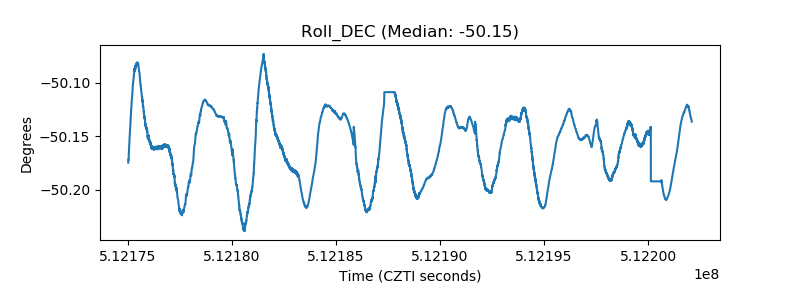 |
| _Roll_RA | 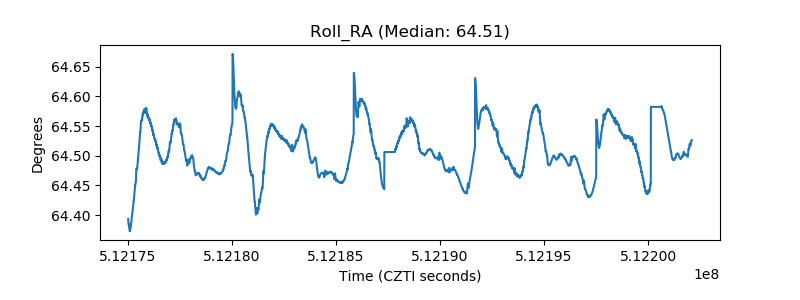 |
| Veto Counter | 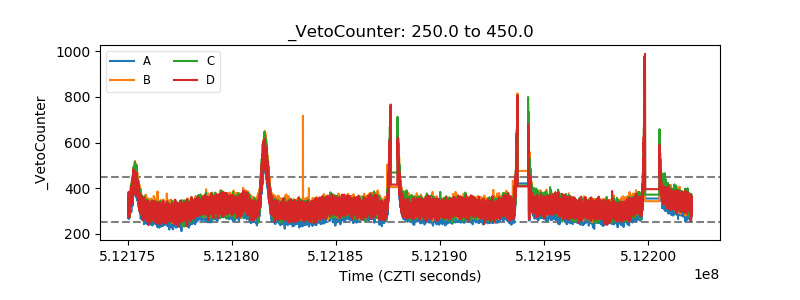 |