| Param | Original file | Final file |
|---|---|---|
| Filename | modeM0/AS1A14_083T05_9000006560_56764cztM0_level2.fits | modeM0/AS1A14_083T05_9000006560_56764cztM0_level2_quad_clean.evt |
| Size (bytes) | 413,006,400 | 88,608,960 |
| Size | 393.9 MB | 84.5 MB |
| Events in quadrant A | 3,570,210 | 584,758 |
| Events in quadrant B | 4,617,514 | 589,691 |
| Events in quadrant C | 3,304,471 | 549,146 |
| Events in quadrant D | 3,311,759 | 524,598 |
| Mode SS | |||
|---|---|---|---|
| Quadrant | BADHDUFLAG | Total packets | Discarded packets |
| A | 0 | 126 | 0 |
| B | 0 | 126 | 0 |
| C | 0 | 126 | 0 |
| D | 0 | 126 | 0 |
| Mode M0 | |||
|---|---|---|---|
| Quadrant | BADHDUFLAG | Total packets | Discarded packets |
| A | 0 | 14468 | 1 |
| B | 0 | 18044 | 1 |
| C | 0 | 14453 | 1 |
| D | 0 | 14250 | 1 |
| Mode M9 | |||
|---|---|---|---|
| Quadrant | BADHDUFLAG | Total packets | Discarded packets |
| A | 0 | 8 | 0 |
| B | 0 | 8 | 0 |
| C | 0 | 8 | 0 |
| D | 0 | 8 | 0 |
| Quadrant | Total seconds | Saturated seconds | Saturation percentage |
|---|---|---|---|
| A | 6221 | 102 | 1.639608% |
| B | 6221 | 598 | 9.612602% |
| C | 6222 | 252 | 4.050145% |
| D | 6222 | 193 | 3.101896% |
Noise dominated data is calculated using 1-second bins in cleaned event files. If a bin has >2000 counts, and if more than 50% of those come from <1% of pixels, then it is considered to be noise-dominated and hence unusable.
| Quadrant | # 1 sec bins | Bins with >0 counts | Bins with >2000 counts | High rate bins dominated by noise | Noise dominated (total time) | Noise dominated (detector-on time) | Marked lightcurve |
|---|---|---|---|---|---|---|---|
| A | 7081 | 6222 | 9 | 9 | 0.13% | 0.14% | 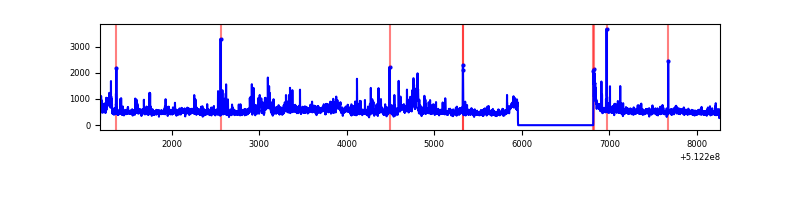 |
| B | 7081 | 6222 | 399 | 399 | 5.63% | 6.41% | 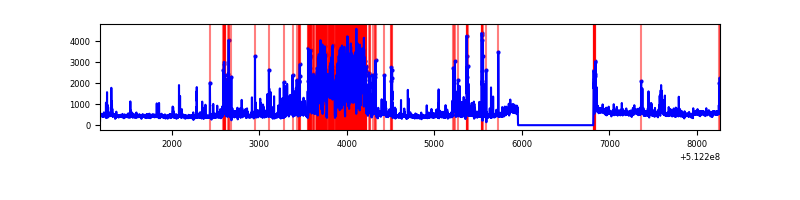 |
| C | 7082 | 6223 | 135 | 135 | 1.91% | 2.17% | 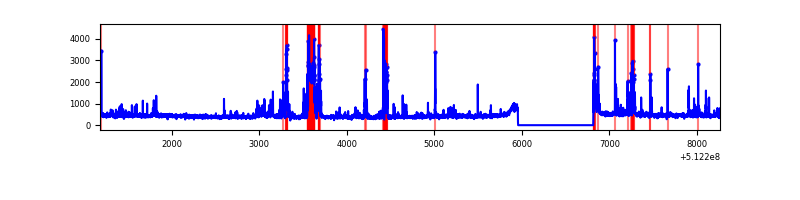 |
| D | 7082 | 6223 | 96 | 96 | 1.36% | 1.54% | 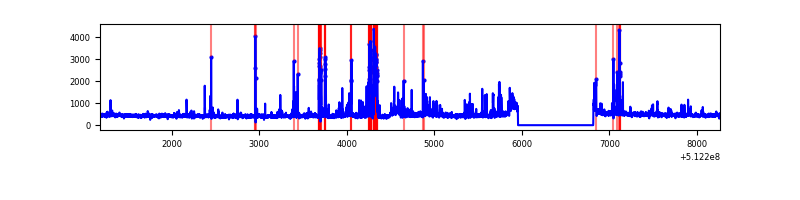 |
Top three noisy pixels from each quadrant. If the there are fewer than three noisy pixels in the level2.evt file, extra rows are filled as -1
| Pixel properties | Quadrant properties | ||||||
|---|---|---|---|---|---|---|---|
| Quadrant | DetID | PixID | Counts | Sigma | Mean | Median | Sigma |
| A | 3 | 14 | 620692 | 3719.76 | 669 | 651 | 166.7 |
| A | 15 | 33 | 119424 | 712.55 | 669 | 651 | 166.7 |
| A | 10 | 251 | 95793 | 570.78 | 669 | 651 | 166.7 |
| B | 5 | 185 | 1587208 | 11399.29 | 638 | 613 | 139.2 |
| B | 10 | 247 | 222516 | 1594.32 | 638 | 613 | 139.2 |
| B | 4 | 206 | 57054 | 405.51 | 638 | 613 | 139.2 |
| C | 15 | 230 | 470648 | 2678.77 | 642 | 638 | 175.5 |
| C | 12 | 249 | 141937 | 805.32 | 642 | 638 | 175.5 |
| C | 6 | 223 | 94462 | 534.74 | 642 | 638 | 175.5 |
| D | 2 | 249 | 347025 | 1905.68 | 646 | 617 | 181.8 |
| D | 3 | 12 | 96106 | 525.31 | 646 | 617 | 181.8 |
| D | 2 | 62 | 90468 | 494.29 | 646 | 617 | 181.8 |
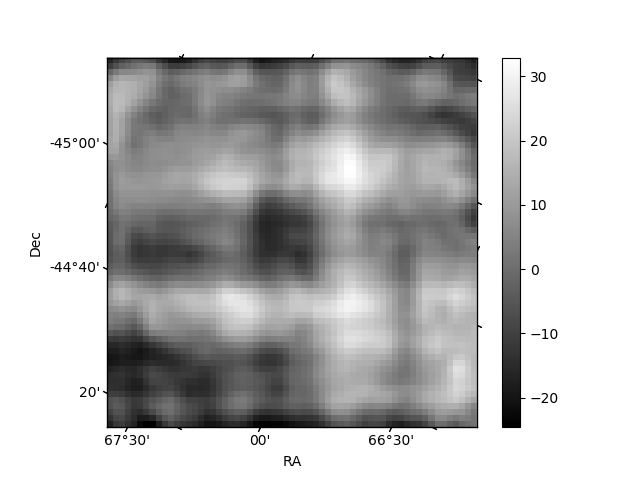
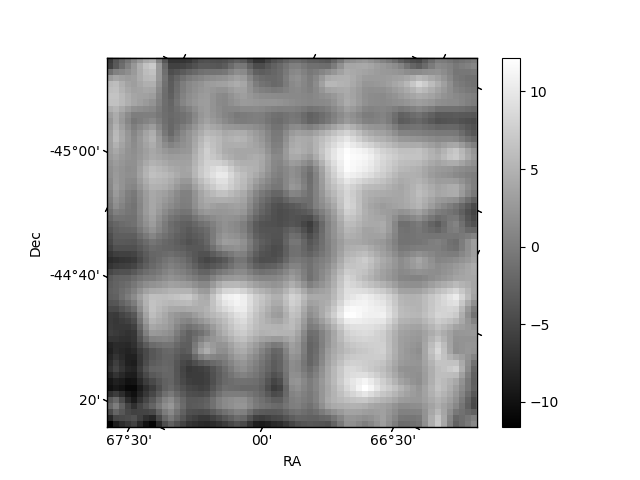
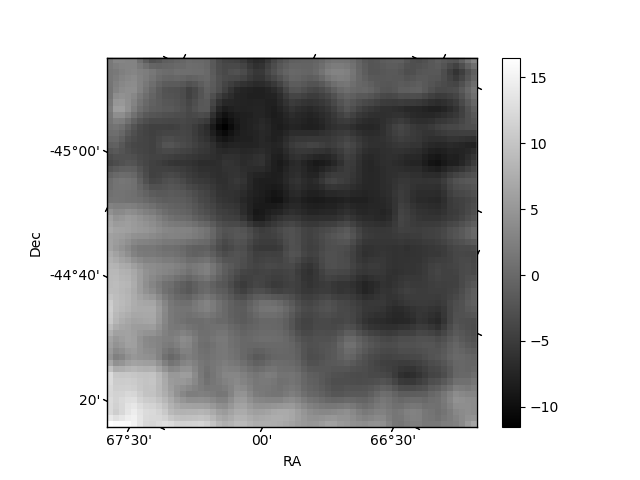
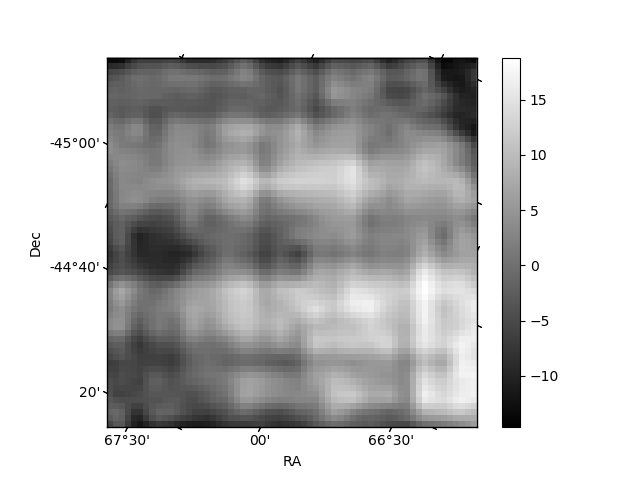
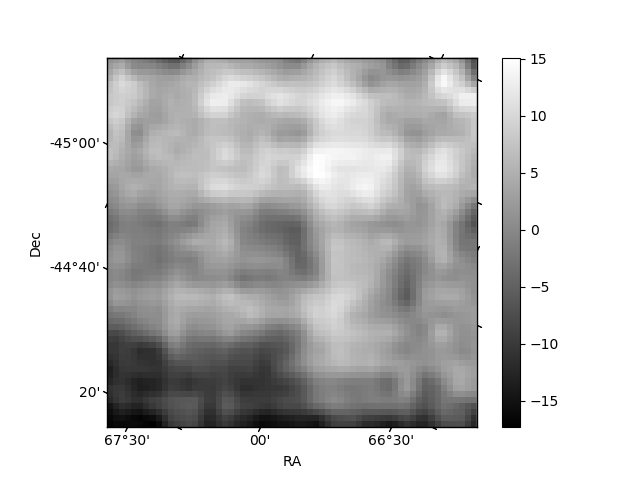
Histogram calculated using DETX and DETY for each event in the final _common_clean file
| Quadrant A | 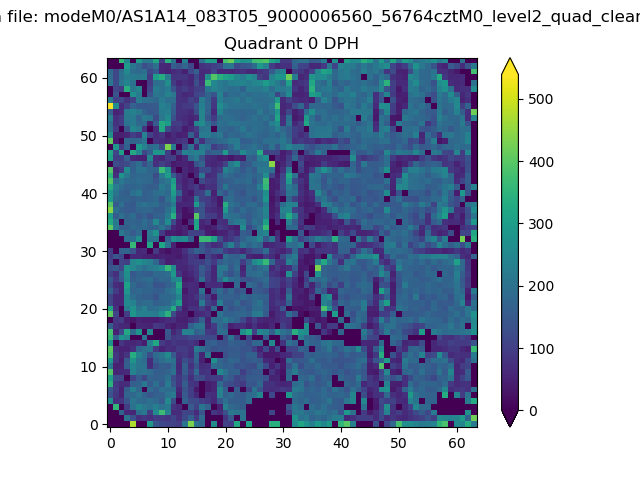 |
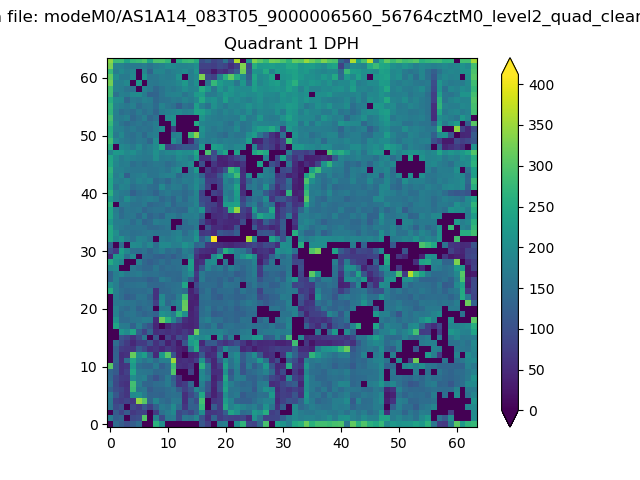 |
Quadrant B |
|---|---|---|---|
| Quadrant D | 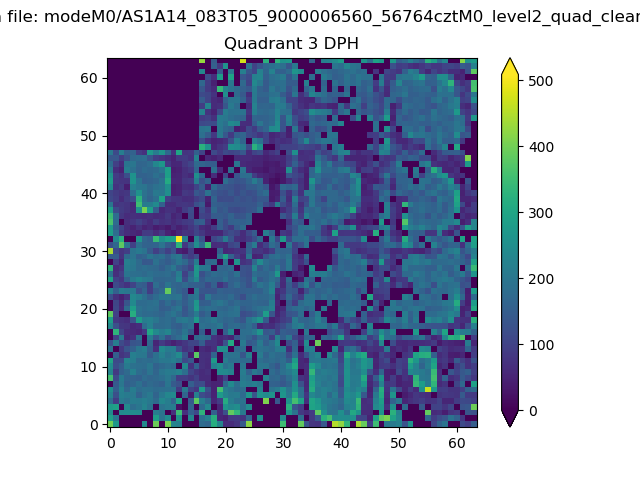 |
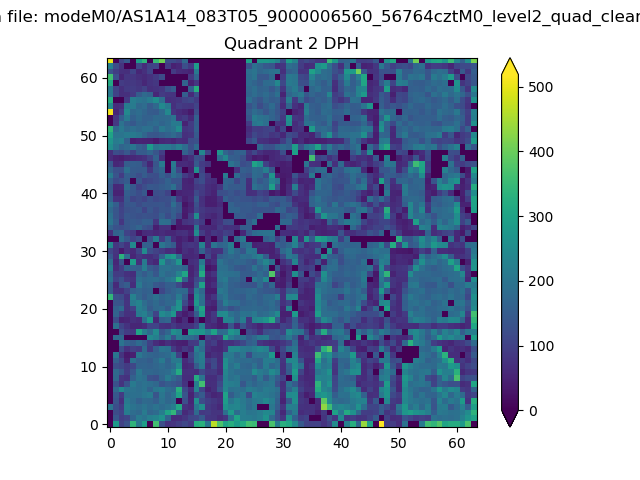 |
Quadrant C |
| Plot type | Count rate plots | Images |
|---|---|---|
| Comparison with Poisson distribution Blue bars denote a histogram of data divided into 1 sec bins. Red curve is a Poisson curve with rate = median count rate of data. |
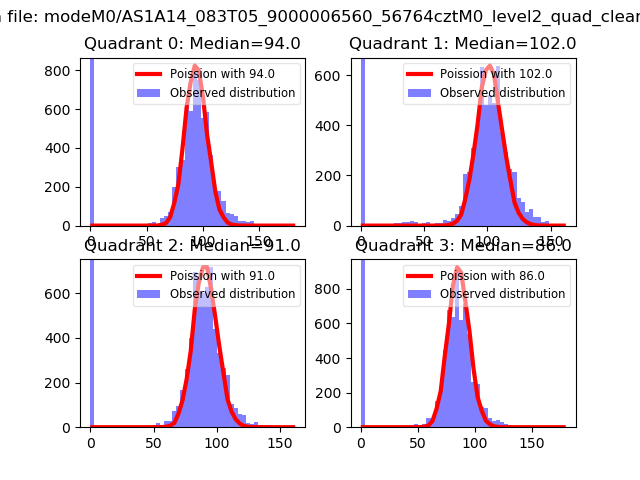 |
 |
| Quadrant-wise count rates Data is divided into 100 sec bins |
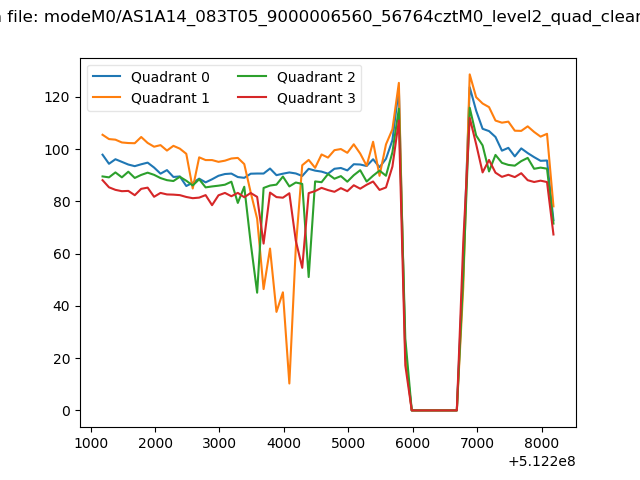 |
|
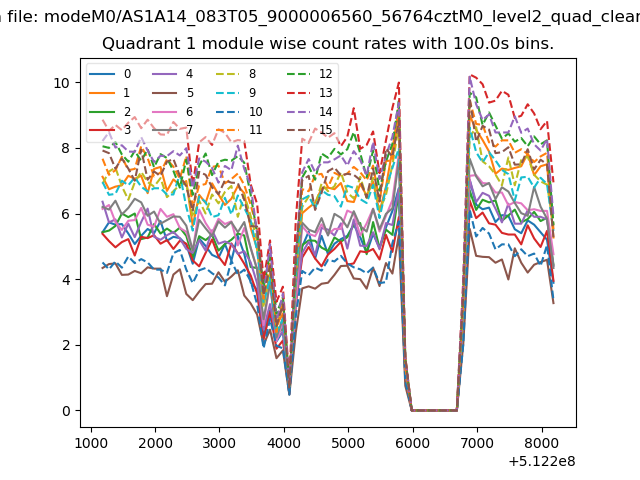
| Module-wise count rates for Quadrant A Data is divided into 100 sec bins |
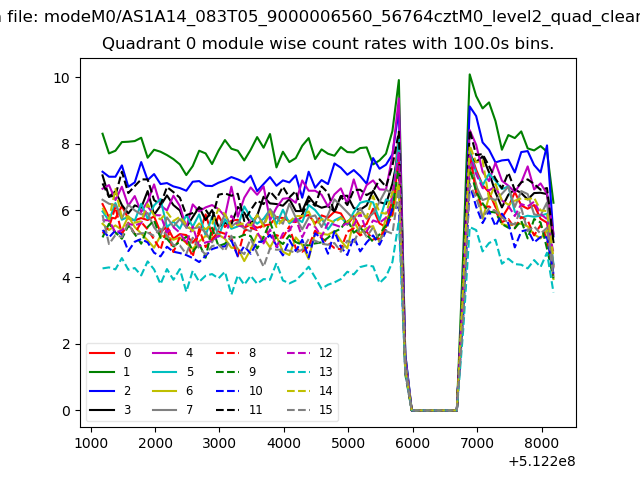 |
 |
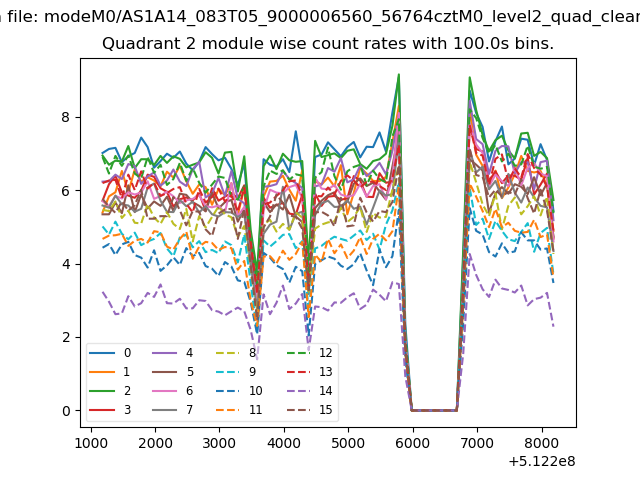
| Module-wise count rates for Quadrant B Data is divided into 100 sec bins |
 |
 |
| Module-wise count rates for Quadrant C Data is divided into 100 sec bins |
 |
 |
| Module-wise count rates for Quadrant D Data is divided into 100 sec bins |
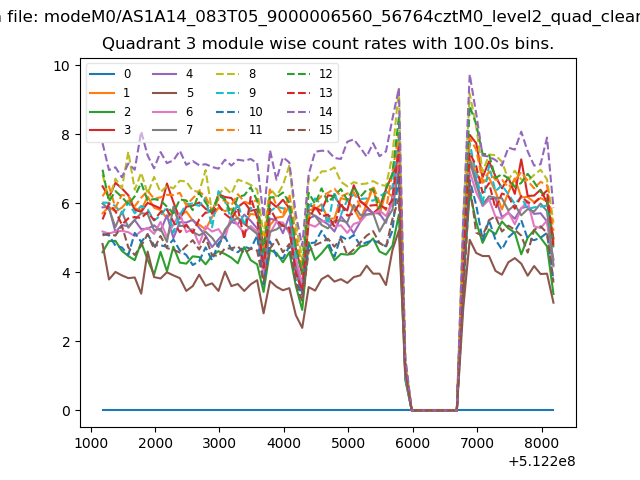 |
 |
| Parameter | Plot |
|---|---|
| CZT HV Monitor | 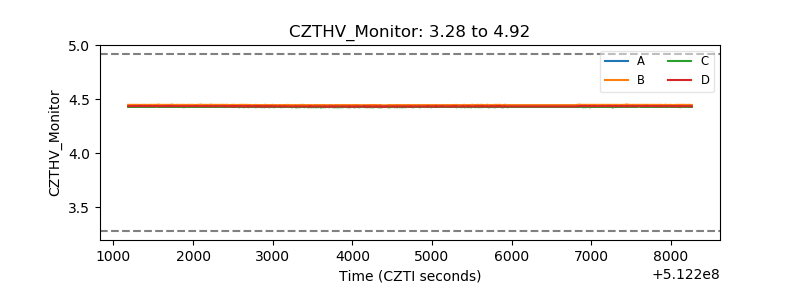 |
| D_VDD | 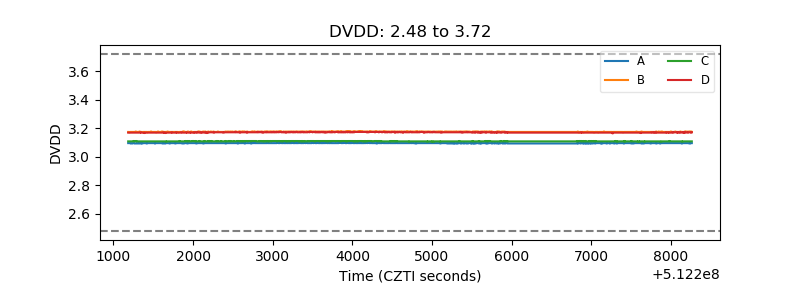 |
| Temperature 1 | 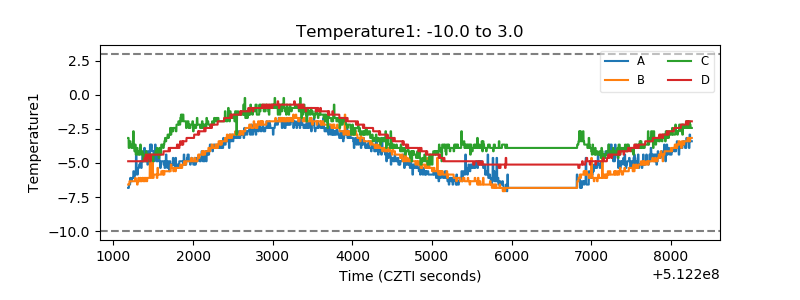 |
| Veto HV Monitor | 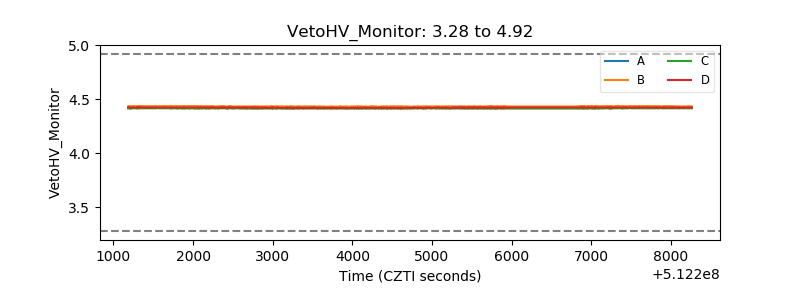 |
| Veto LLD | 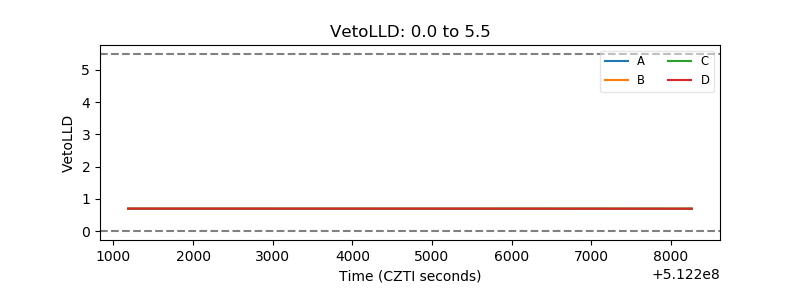 |
| Alpha Counter | 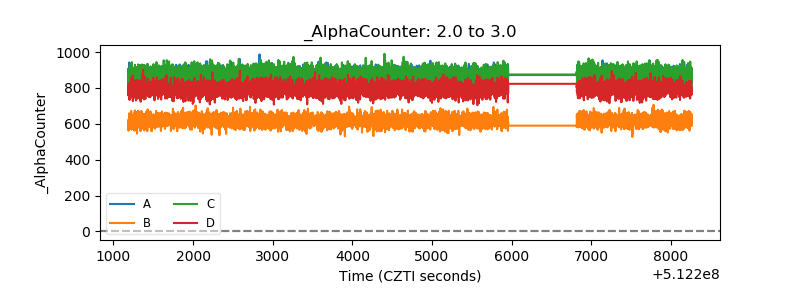 |
| _CPM_Rate | 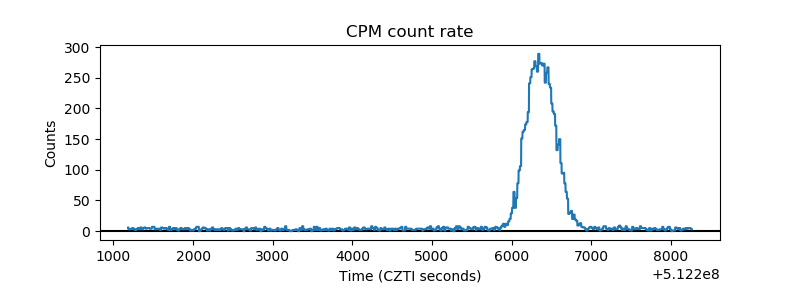 |
| CZT Counter | 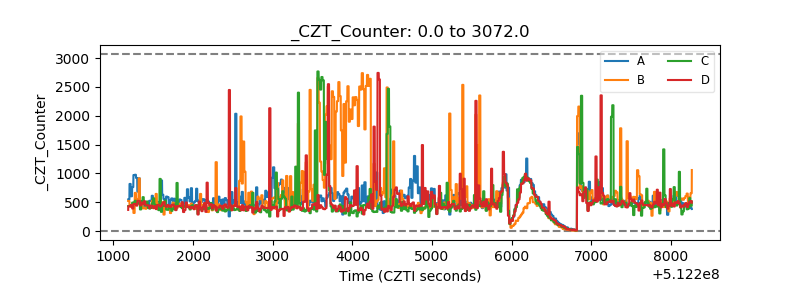 |
| +2.5 Volts monitor |  |
| +5 Volts monitor |  |
| _ROLL_ROT | 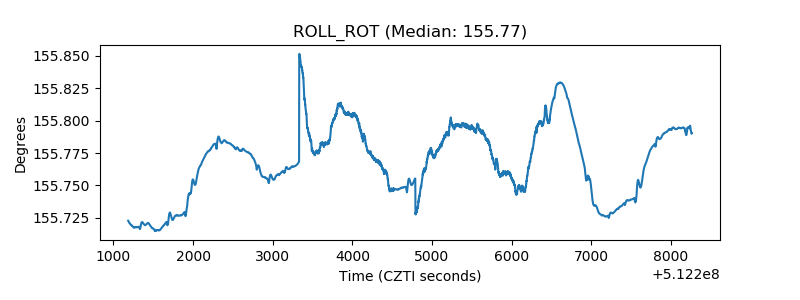 |
| _Roll_DEC | 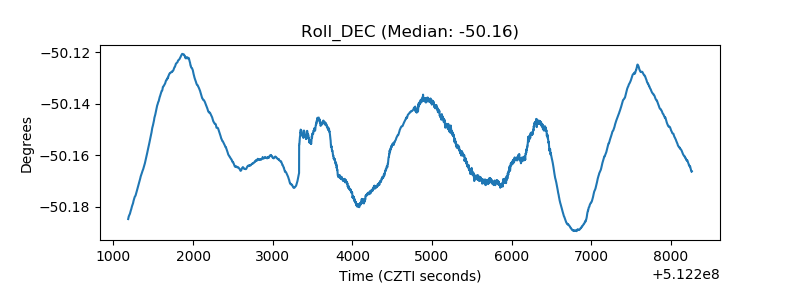 |
| _Roll_RA | 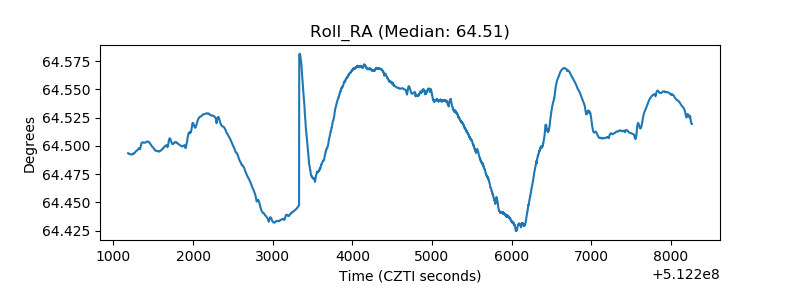 |
| Veto Counter | 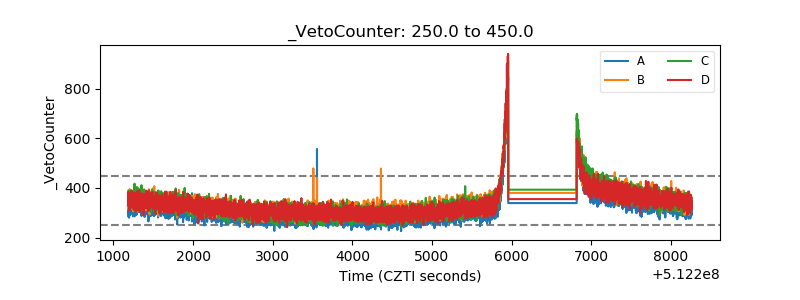 |