| Param | Original file | Final file |
|---|---|---|
| Filename | modeM0/AS1A14_083T05_9000006560_56766cztM0_level2.fits | modeM0/AS1A14_083T05_9000006560_56766cztM0_level2_quad_clean.evt |
| Size (bytes) | 397,552,320 | 93,545,280 |
| Size | 379.1 MB | 89.2 MB |
| Events in quadrant A | 3,490,130 | 609,507 |
| Events in quadrant B | 3,854,257 | 651,059 |
| Events in quadrant C | 3,658,289 | 569,613 |
| Events in quadrant D | 3,215,627 | 556,166 |
| Mode SS | |||
|---|---|---|---|
| Quadrant | BADHDUFLAG | Total packets | Discarded packets |
| A | 0 | 130 | 0 |
| B | 0 | 130 | 0 |
| C | 0 | 130 | 0 |
| D | 0 | 130 | 0 |
| Mode M0 | |||
|---|---|---|---|
| Quadrant | BADHDUFLAG | Total packets | Discarded packets |
| A | 0 | 14626 | 1 |
| B | 0 | 15807 | 1 |
| C | 0 | 15658 | 1 |
| D | 0 | 13962 | 1 |
| Mode M9 | |||
|---|---|---|---|
| Quadrant | BADHDUFLAG | Total packets | Discarded packets |
| A | 0 | 10 | 0 |
| B | 0 | 10 | 0 |
| C | 0 | 10 | 0 |
| D | 0 | 10 | 0 |
| Quadrant | Total seconds | Saturated seconds | Saturation percentage |
|---|---|---|---|
| A | 6395 | 110 | 1.720094% |
| B | 6396 | 217 | 3.392745% |
| C | 6396 | 312 | 4.878049% |
| D | 6396 | 72 | 1.125704% |
Noise dominated data is calculated using 1-second bins in cleaned event files. If a bin has >2000 counts, and if more than 50% of those come from <1% of pixels, then it is considered to be noise-dominated and hence unusable.
| Quadrant | # 1 sec bins | Bins with >0 counts | Bins with >2000 counts | High rate bins dominated by noise | Noise dominated (total time) | Noise dominated (detector-on time) | Marked lightcurve |
|---|---|---|---|---|---|---|---|
| A | 7400 | 6396 | 48 | 48 | 0.65% | 0.75% | 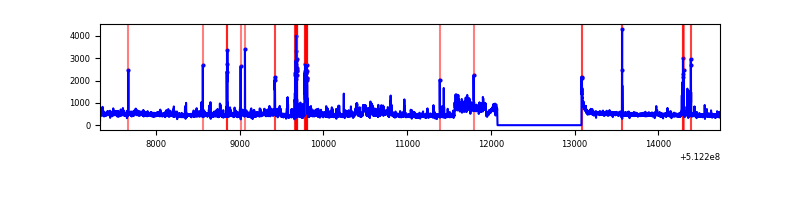 |
| B | 7401 | 6397 | 96 | 96 | 1.30% | 1.50% | 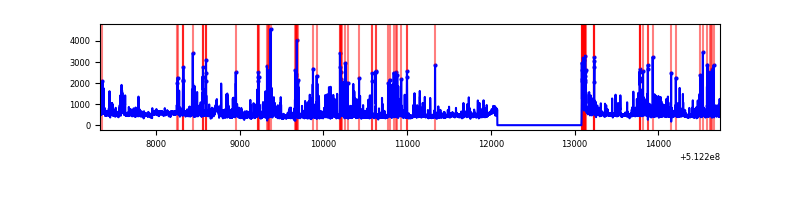 |
| C | 7401 | 6397 | 259 | 259 | 3.50% | 4.05% | 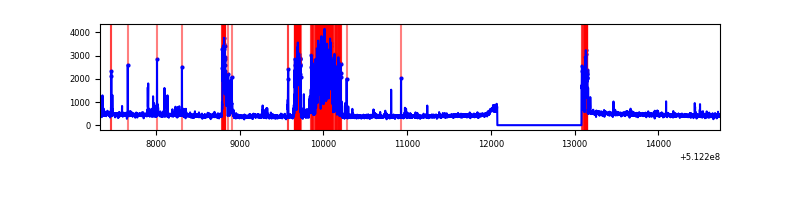 |
| D | 7401 | 6397 | 16 | 16 | 0.22% | 0.25% | 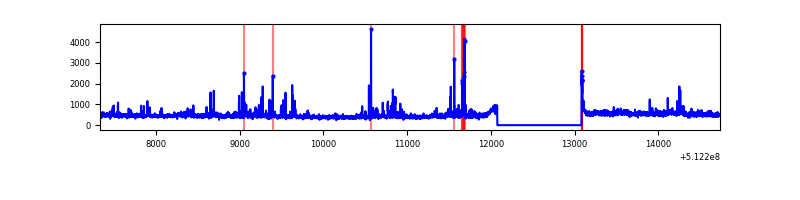 |
Top three noisy pixels from each quadrant. If the there are fewer than three noisy pixels in the level2.evt file, extra rows are filled as -1
| Pixel properties | Quadrant properties | ||||||
|---|---|---|---|---|---|---|---|
| Quadrant | DetID | PixID | Counts | Sigma | Mean | Median | Sigma |
| A | 3 | 14 | 509869 | 2953.21 | 692 | 673 | 172.4 |
| A | 15 | 33 | 146050 | 843.15 | 692 | 673 | 172.4 |
| A | 10 | 251 | 96146 | 553.72 | 692 | 673 | 172.4 |
| B | 5 | 185 | 414154 | 2817.99 | 674 | 649 | 146.7 |
| B | 10 | 247 | 243308 | 1653.7 | 674 | 649 | 146.7 |
| B | 4 | 206 | 215142 | 1461.75 | 674 | 649 | 146.7 |
| C | 15 | 230 | 865420 | 4797.39 | 659 | 652 | 180.3 |
| C | 9 | 38 | 95033 | 523.59 | 659 | 652 | 180.3 |
| C | 6 | 223 | 38482 | 209.87 | 659 | 652 | 180.3 |
| D | 5 | 113 | 145126 | 762.35 | 672 | 639 | 189.5 |
| D | 2 | 249 | 92425 | 484.29 | 672 | 639 | 189.5 |
| D | 2 | 62 | 77272 | 404.34 | 672 | 639 | 189.5 |
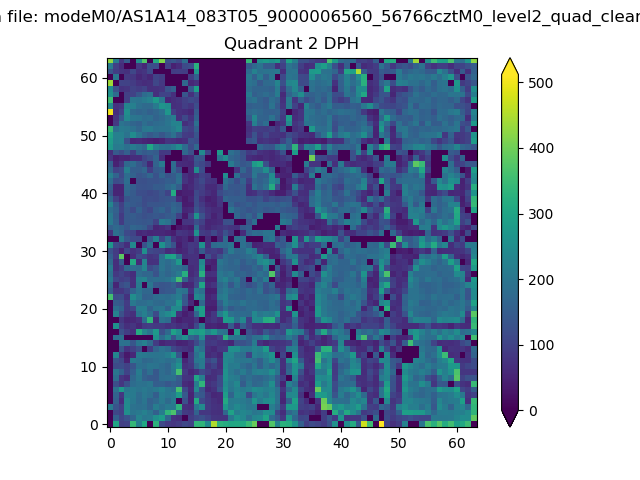
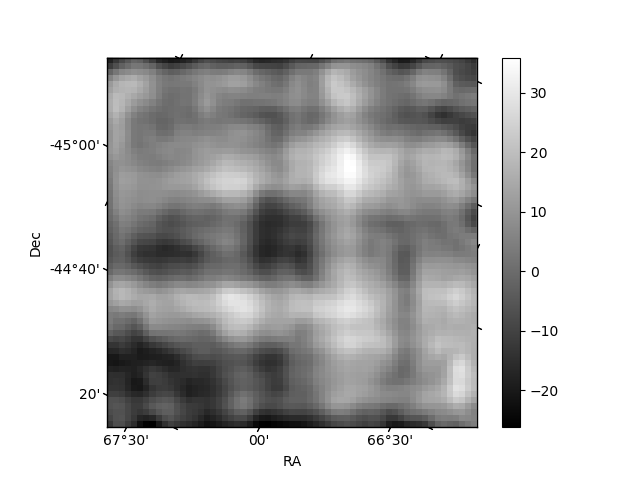
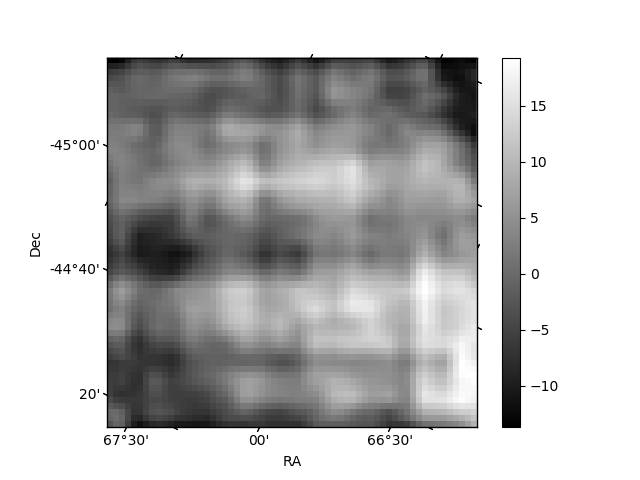
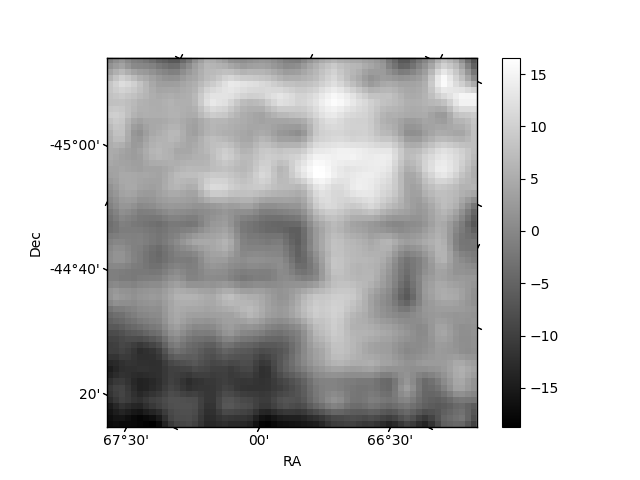
Histogram calculated using DETX and DETY for each event in the final _common_clean file
| Quadrant A | 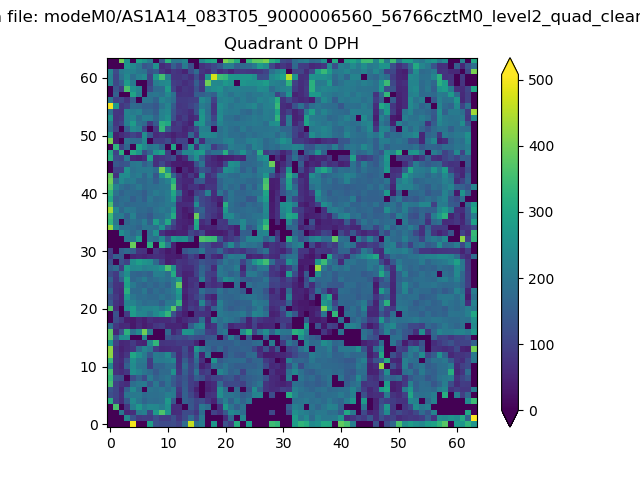 |
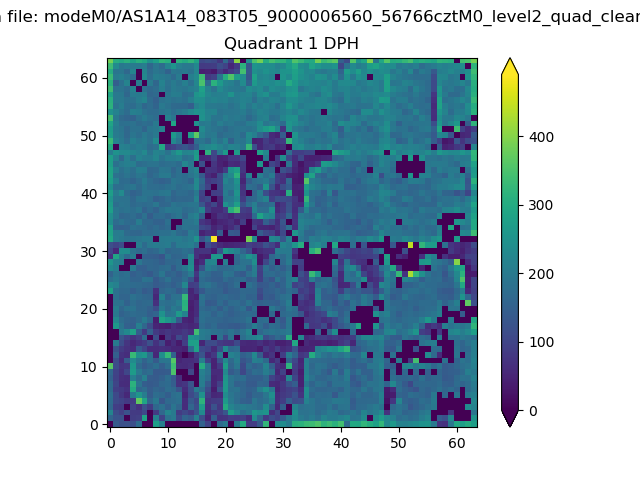 |
Quadrant B |
|---|---|---|---|
| Quadrant D | 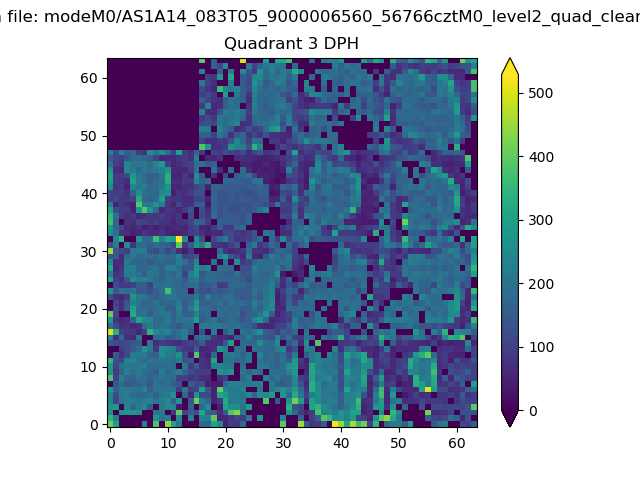 |
 |
Quadrant C |
| Plot type | Count rate plots | Images |
|---|---|---|
| Comparison with Poisson distribution Blue bars denote a histogram of data divided into 1 sec bins. Red curve is a Poisson curve with rate = median count rate of data. |
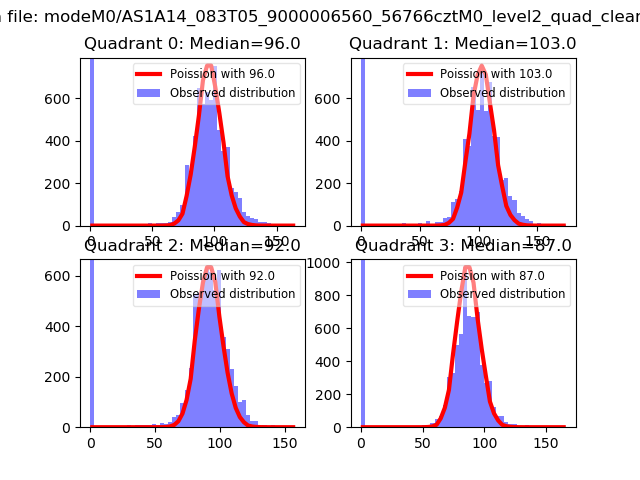 |
 |
| Quadrant-wise count rates Data is divided into 100 sec bins |
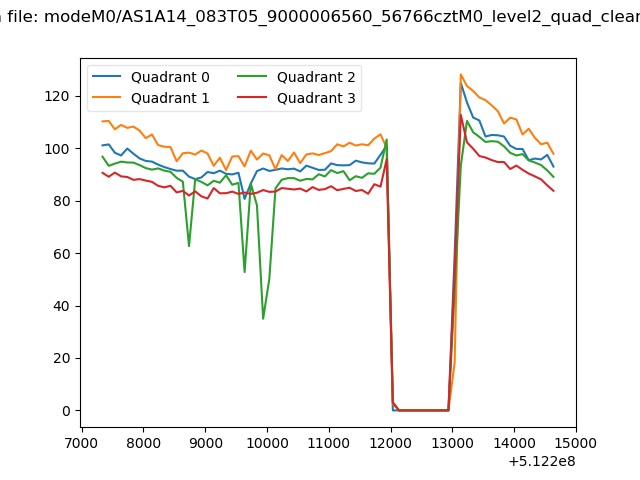 |
|
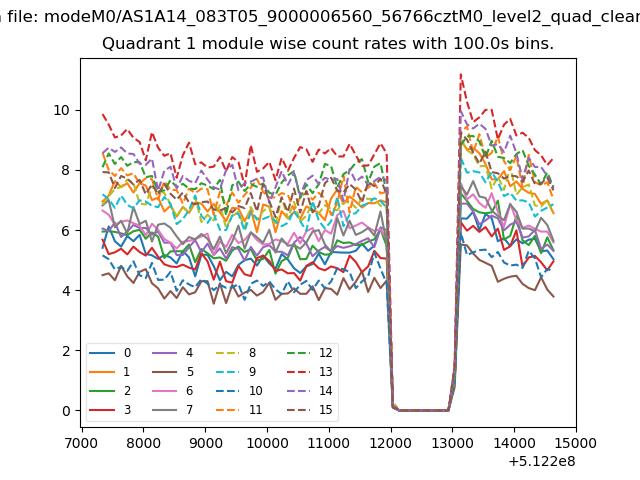
| Module-wise count rates for Quadrant A Data is divided into 100 sec bins |
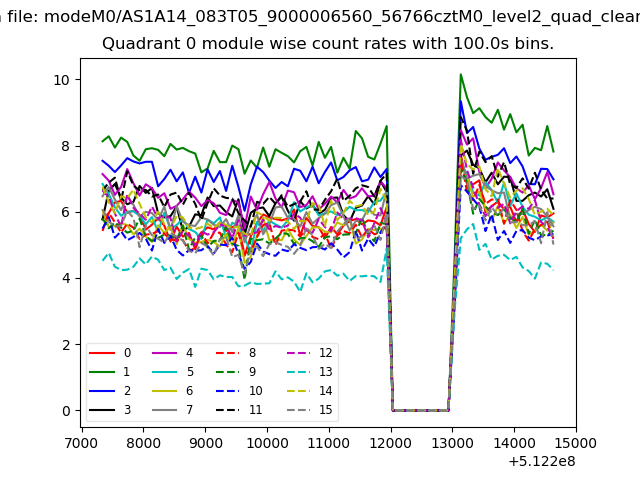 |
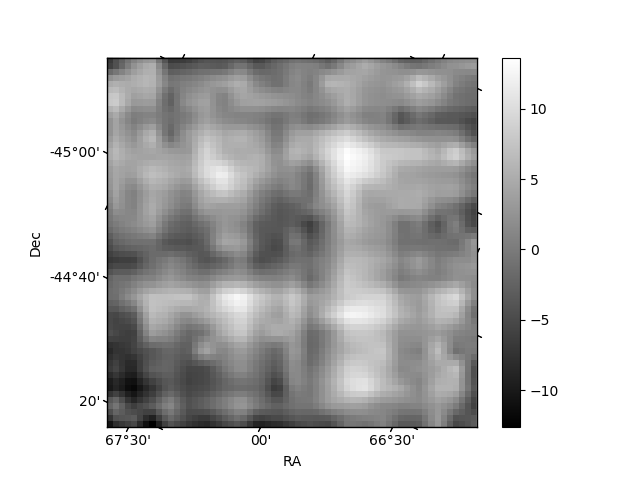 |
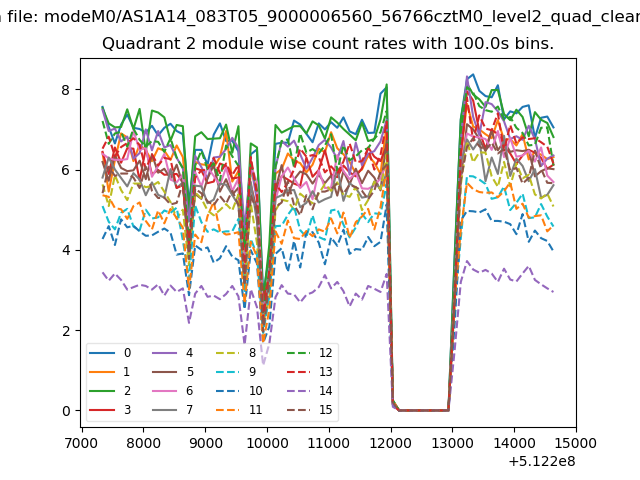
| Module-wise count rates for Quadrant B Data is divided into 100 sec bins |
 |
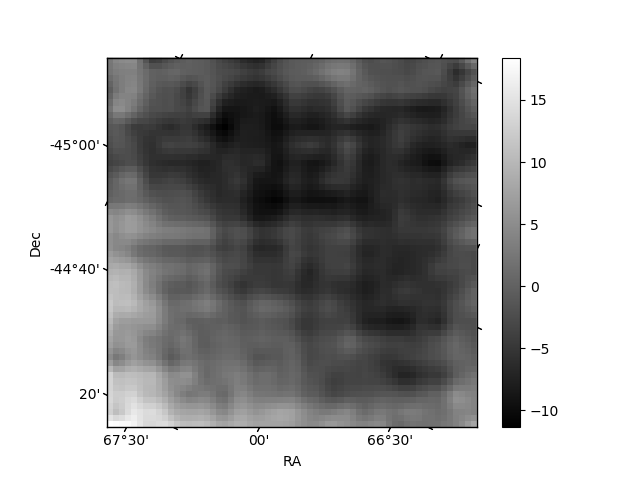 |
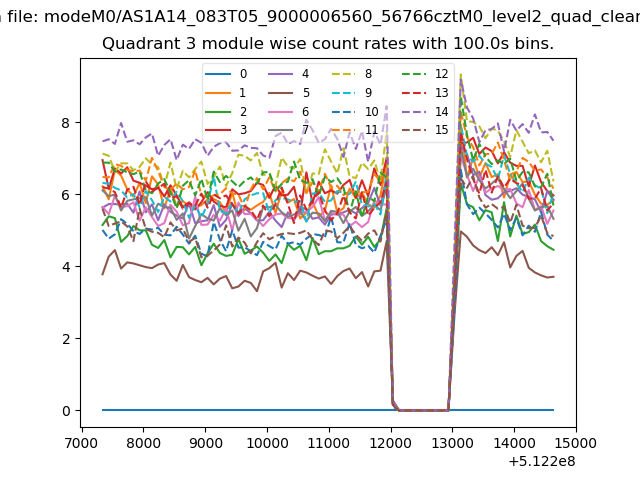
| Module-wise count rates for Quadrant C Data is divided into 100 sec bins |
 |
 |
| Module-wise count rates for Quadrant D Data is divided into 100 sec bins |
 |
 |
| Parameter | Plot |
|---|---|
| CZT HV Monitor | 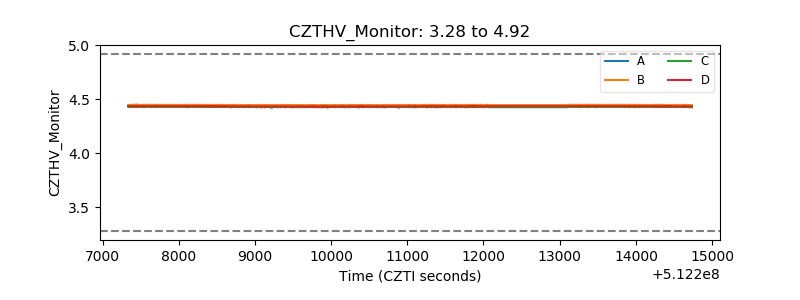 |
| D_VDD | 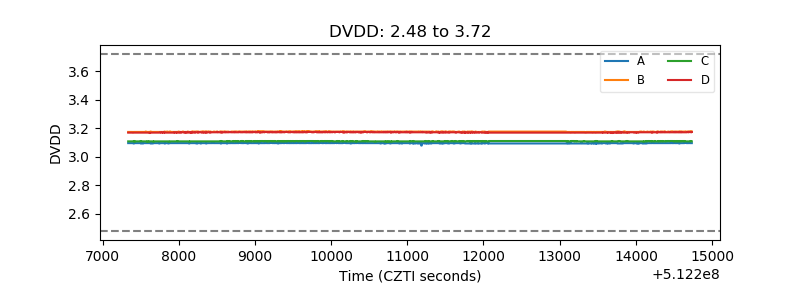 |
| Temperature 1 | 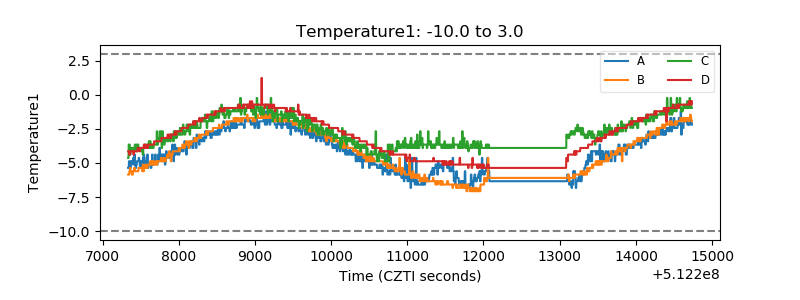 |
| Veto HV Monitor | 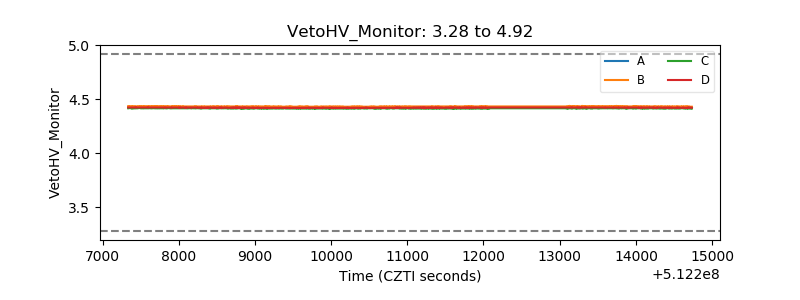 |
| Veto LLD | 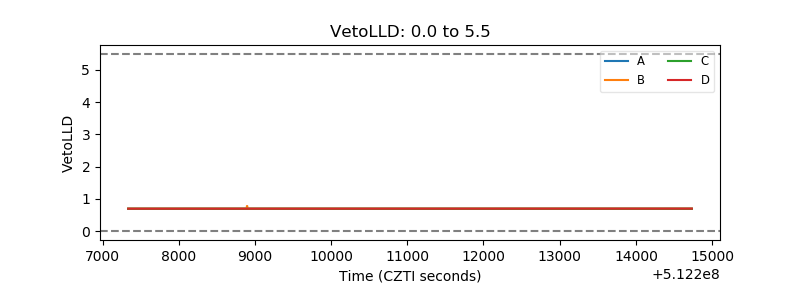 |
| Alpha Counter | 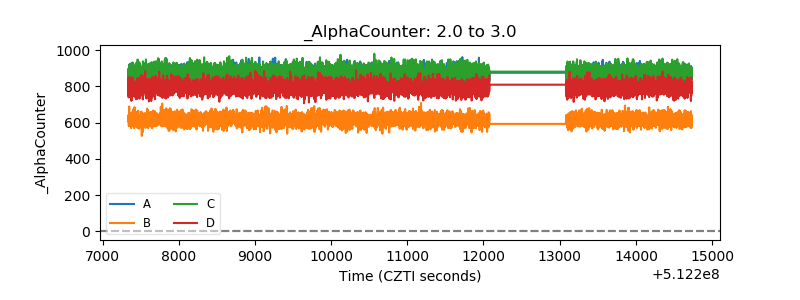 |
| _CPM_Rate | 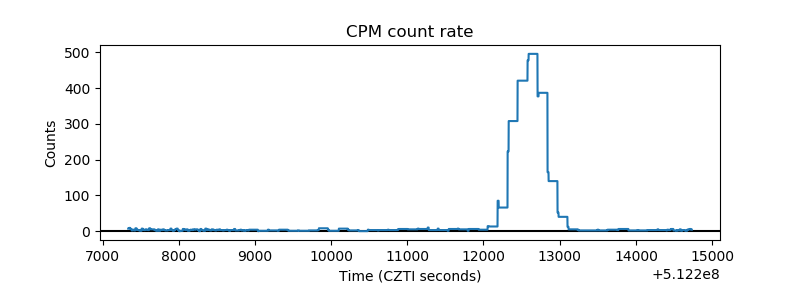 |
| CZT Counter | 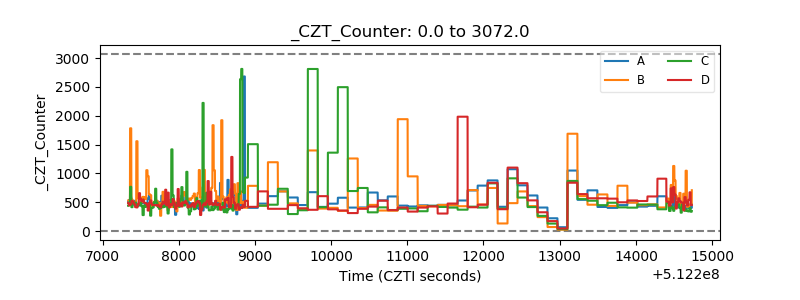 |
| +2.5 Volts monitor |  |
| +5 Volts monitor |  |
| _ROLL_ROT | 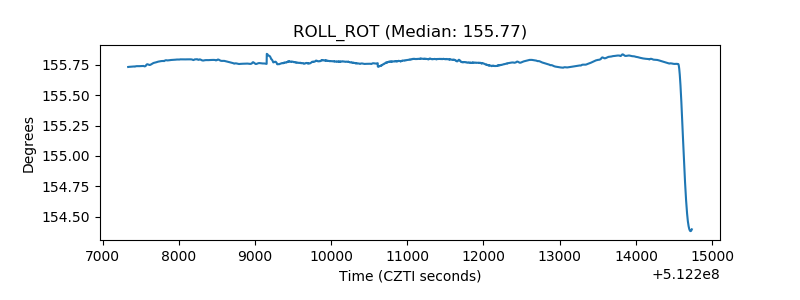 |
| _Roll_DEC | 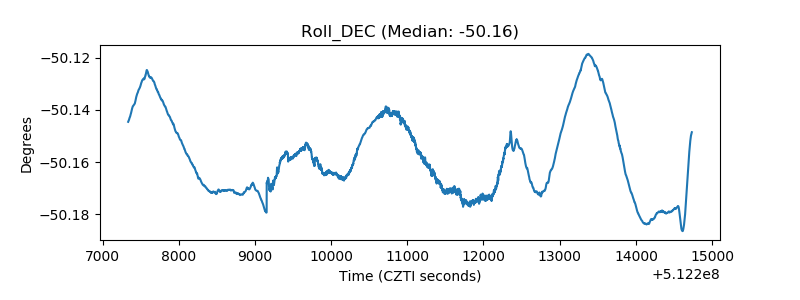 |
| _Roll_RA | 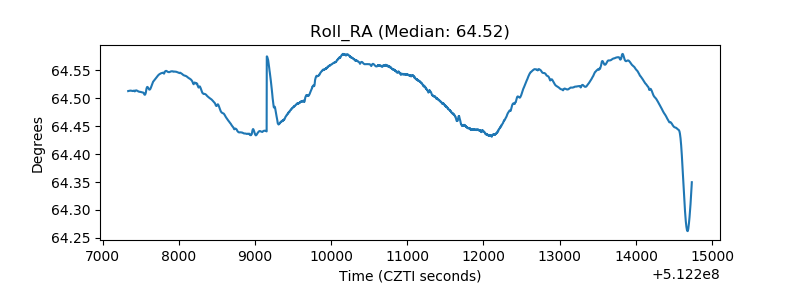 |
| Veto Counter | 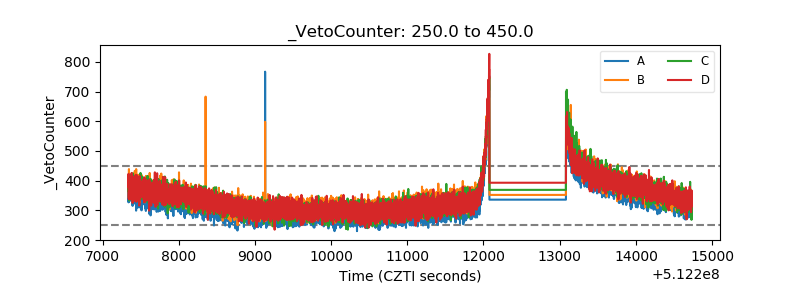 |