| Param | Original file | Final file |
|---|---|---|
| Filename | modeM0/AS1A14_083T05_9000006560_56767cztM0_level2.fits | modeM0/AS1A14_083T05_9000006560_56767cztM0_level2_quad_clean.evt |
| Size (bytes) | 420,526,080 | 89,717,760 |
| Size | 401.0 MB | 85.6 MB |
| Events in quadrant A | 3,613,678 | 585,940 |
| Events in quadrant B | 4,850,055 | 598,120 |
| Events in quadrant C | 3,492,847 | 563,815 |
| Events in quadrant D | 3,131,575 | 539,828 |
| Mode SS | |||
|---|---|---|---|
| Quadrant | BADHDUFLAG | Total packets | Discarded packets |
| A | 0 | 124 | 0 |
| B | 0 | 124 | 0 |
| C | 0 | 124 | 0 |
| D | 0 | 124 | 0 |
| Mode M0 | |||
|---|---|---|---|
| Quadrant | BADHDUFLAG | Total packets | Discarded packets |
| A | 0 | 14921 | 1 |
| B | 0 | 18686 | 1 |
| C | 0 | 14849 | 2 |
| D | 0 | 13525 | 1 |
| Mode M9 | |||
|---|---|---|---|
| Quadrant | BADHDUFLAG | Total packets | Discarded packets |
| A | 0 | 11 | 0 |
| B | 0 | 11 | 0 |
| C | 0 | 11 | 0 |
| D | 0 | 11 | 0 |
| Quadrant | Total seconds | Saturated seconds | Saturation percentage |
|---|---|---|---|
| A | 6147 | 269 | 4.376118% |
| B | 6147 | 620 | 10.086221% |
| C | 6147 | 200 | 3.253620% |
| D | 6147 | 96 | 1.561737% |
Noise dominated data is calculated using 1-second bins in cleaned event files. If a bin has >2000 counts, and if more than 50% of those come from <1% of pixels, then it is considered to be noise-dominated and hence unusable.
| Quadrant | # 1 sec bins | Bins with >0 counts | Bins with >2000 counts | High rate bins dominated by noise | Noise dominated (total time) | Noise dominated (detector-on time) | Marked lightcurve |
|---|---|---|---|---|---|---|---|
| A | 7207 | 6148 | 152 | 152 | 2.11% | 2.47% | 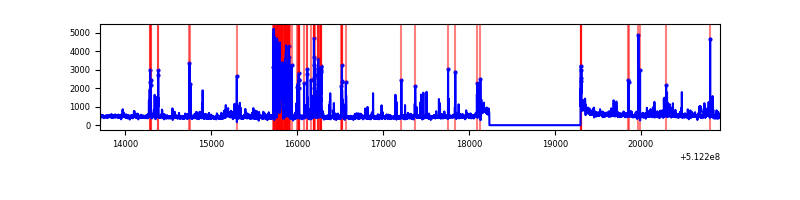 |
| B | 7207 | 6148 | 299 | 299 | 4.15% | 4.86% | 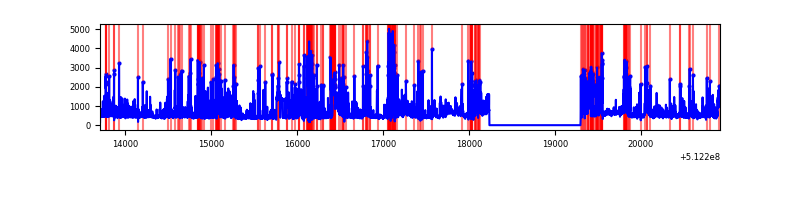 |
| C | 7207 | 6148 | 166 | 166 | 2.30% | 2.70% |  |
| D | 7207 | 6148 | 32 | 32 | 0.44% | 0.52% | 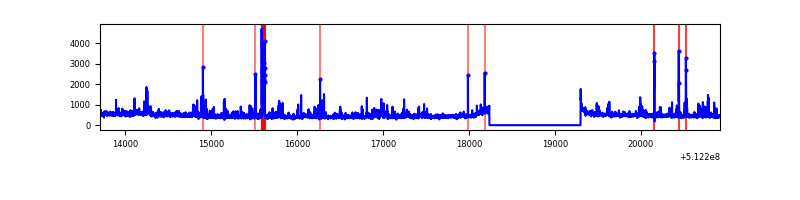 |
Top three noisy pixels from each quadrant. If the there are fewer than three noisy pixels in the level2.evt file, extra rows are filled as -1
| Pixel properties | Quadrant properties | ||||||
|---|---|---|---|---|---|---|---|
| Quadrant | DetID | PixID | Counts | Sigma | Mean | Median | Sigma |
| A | 3 | 62 | 499754 | 3027.51 | 661 | 645 | 164.9 |
| A | 3 | 14 | 304679 | 1844.22 | 661 | 645 | 164.9 |
| A | 10 | 251 | 207020 | 1251.83 | 661 | 645 | 164.9 |
| B | 4 | 206 | 965554 | 7105.9 | 629 | 607 | 135.8 |
| B | 5 | 185 | 763309 | 5616.56 | 629 | 607 | 135.8 |
| B | 0 | 152 | 211431 | 1552.51 | 629 | 607 | 135.8 |
| C | 14 | 96 | 379292 | 2154.48 | 641 | 633 | 175.8 |
| C | 15 | 230 | 233087 | 1322.61 | 641 | 633 | 175.8 |
| C | 13 | 3 | 107172 | 606.18 | 641 | 633 | 175.8 |
| D | 3 | 12 | 144983 | 784.89 | 650 | 622 | 183.9 |
| D | 5 | 113 | 111233 | 601.39 | 650 | 622 | 183.9 |
| D | 2 | 249 | 95113 | 513.75 | 650 | 622 | 183.9 |
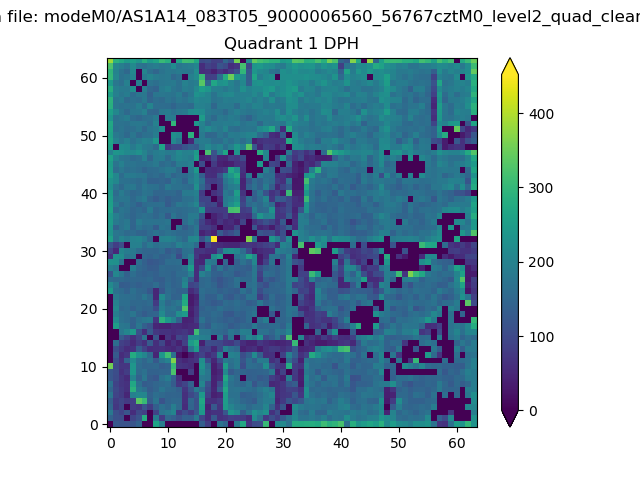
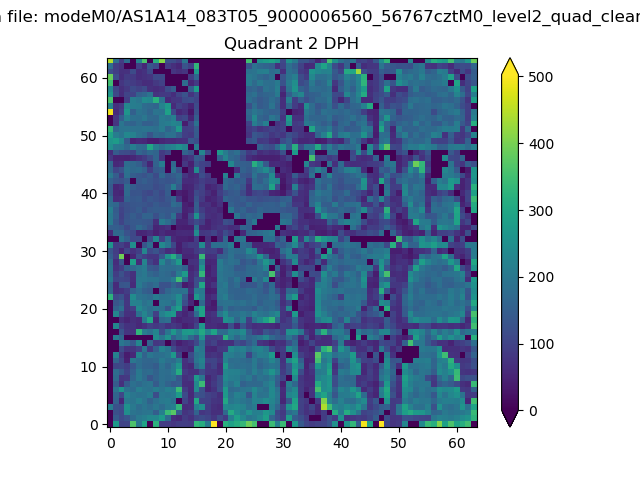
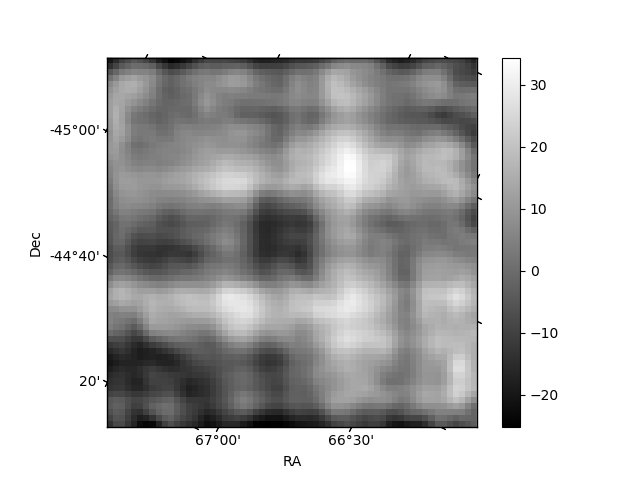
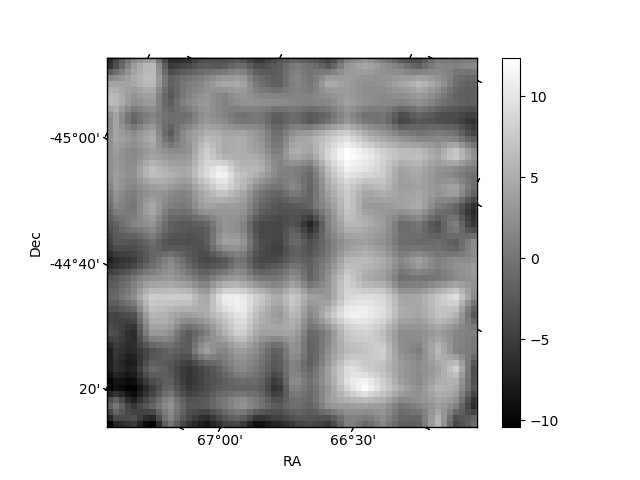
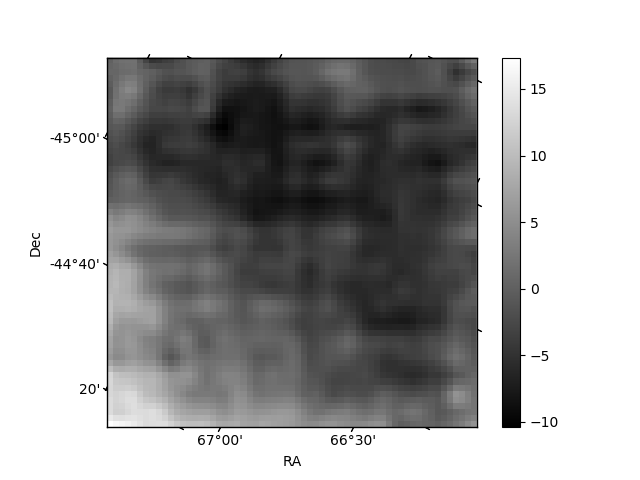
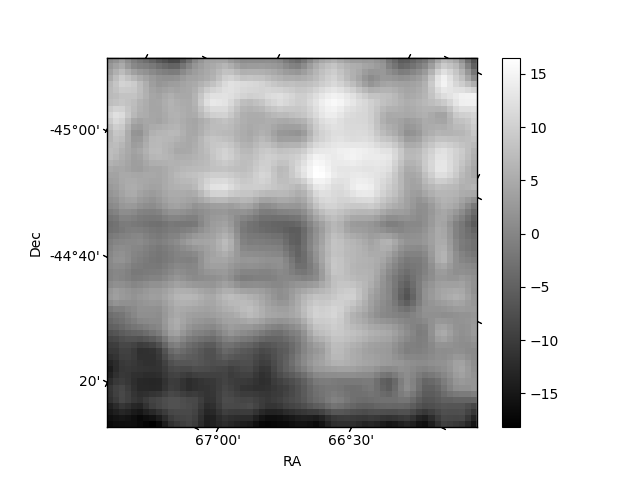
Histogram calculated using DETX and DETY for each event in the final _common_clean file
| Quadrant A | 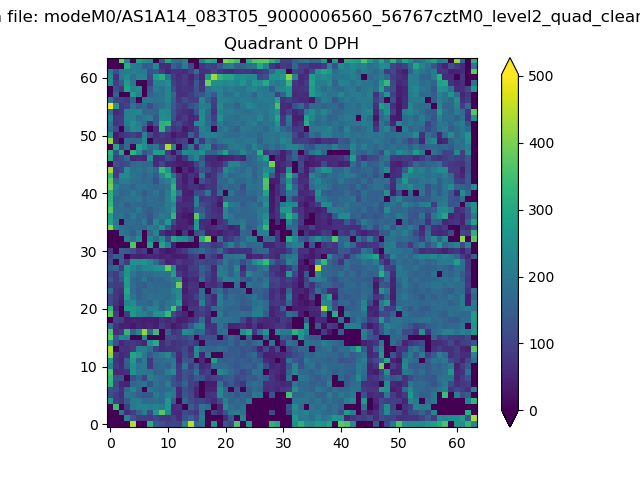 |
 |
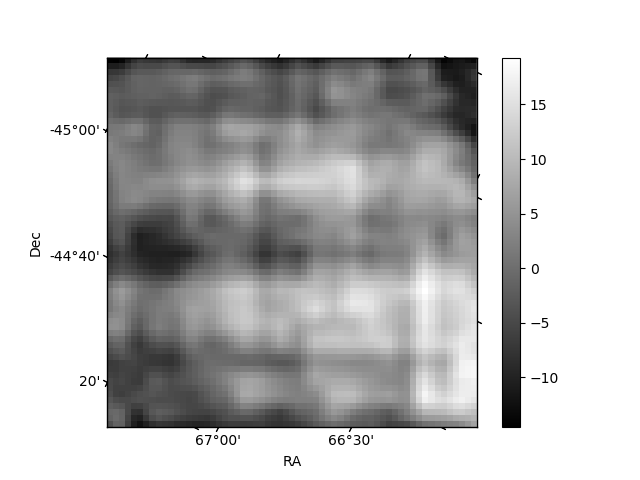
Quadrant B |
|---|---|---|---|
| Quadrant D | 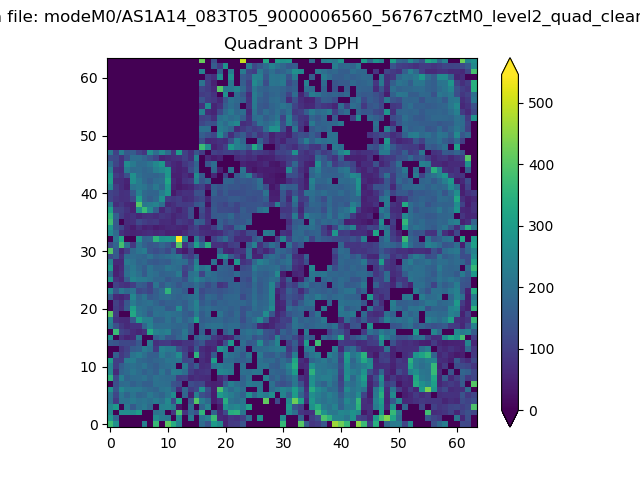 |
 |
Quadrant C |
| Plot type | Count rate plots | Images |
|---|---|---|
| Comparison with Poisson distribution Blue bars denote a histogram of data divided into 1 sec bins. Red curve is a Poisson curve with rate = median count rate of data. |
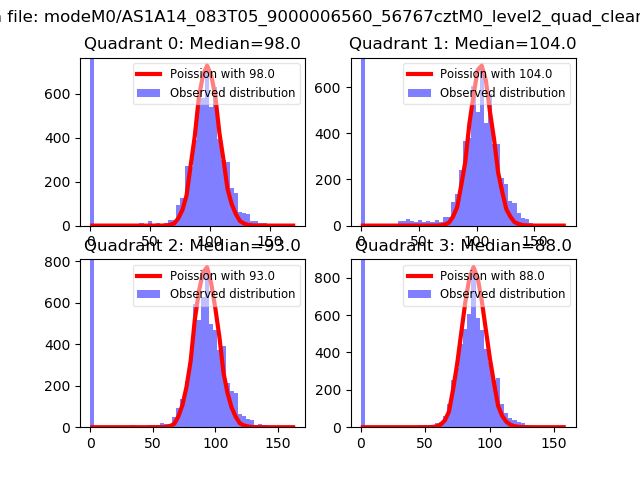 |
 |
| Quadrant-wise count rates Data is divided into 100 sec bins |
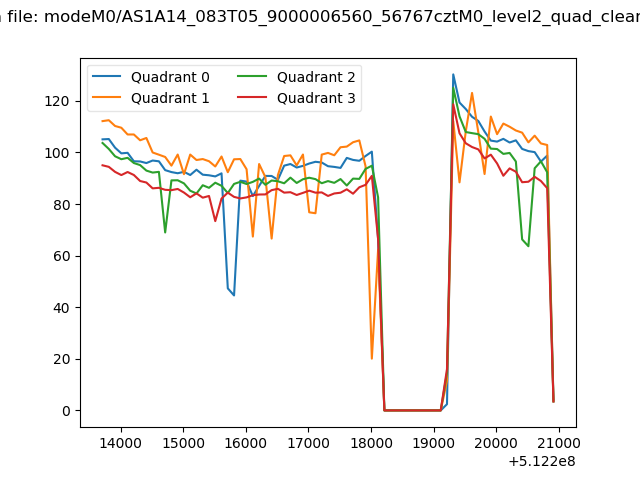 |
|
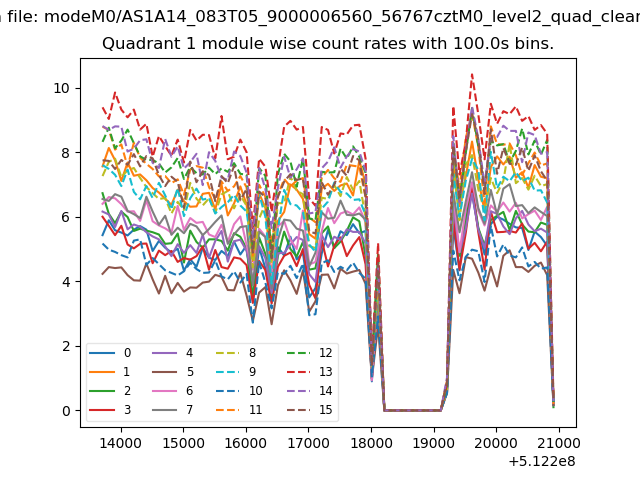
| Module-wise count rates for Quadrant A Data is divided into 100 sec bins |
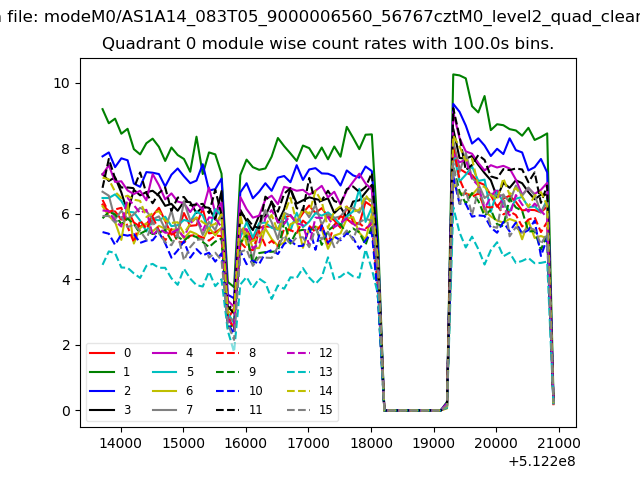 |
 |
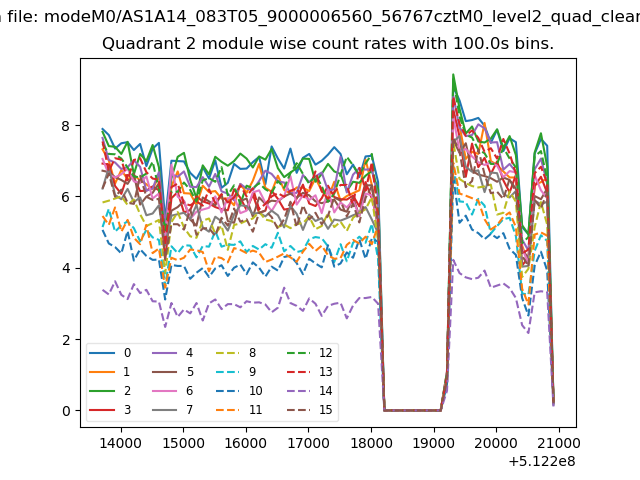
| Module-wise count rates for Quadrant B Data is divided into 100 sec bins |
 |
 |
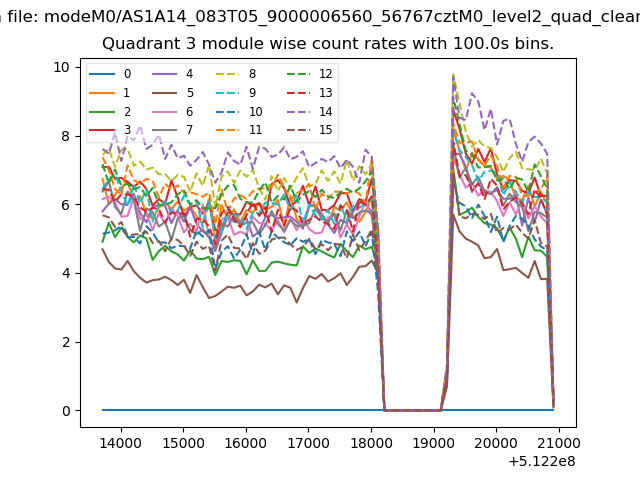
| Module-wise count rates for Quadrant C Data is divided into 100 sec bins |
 |
 |
| Module-wise count rates for Quadrant D Data is divided into 100 sec bins |
 |
 |
| Parameter | Plot |
|---|---|
| CZT HV Monitor | 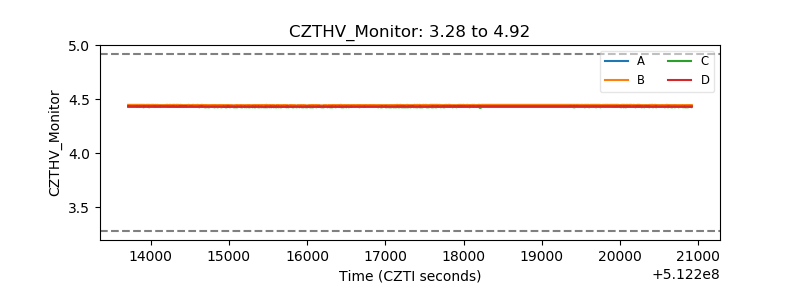 |
| D_VDD | 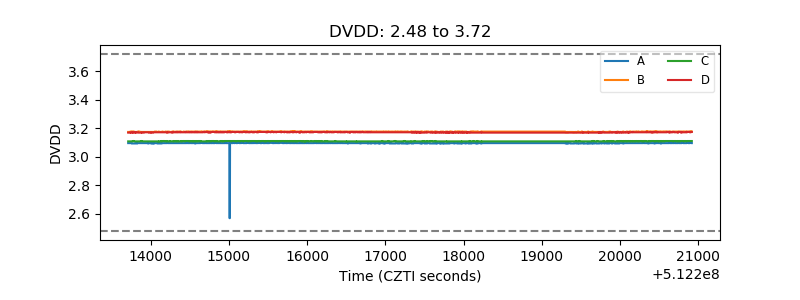 |
| Temperature 1 | 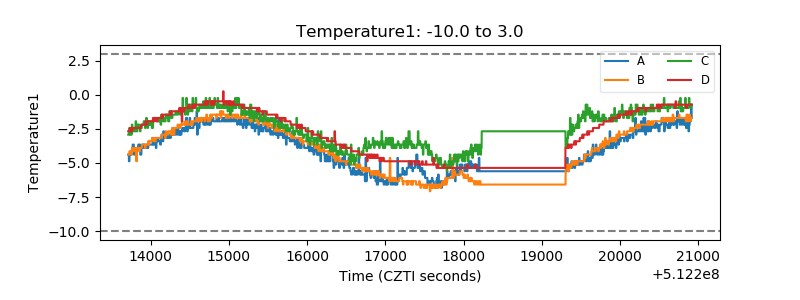 |
| Veto HV Monitor | 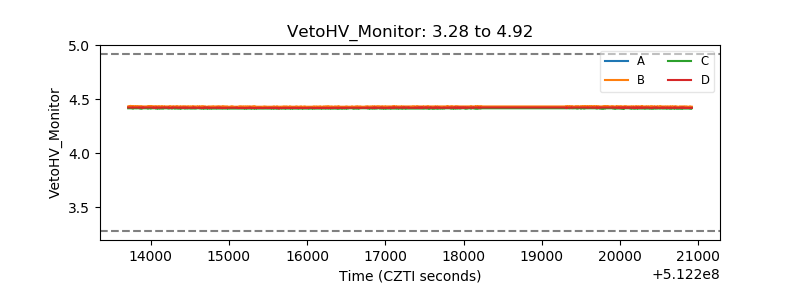 |
| Veto LLD | 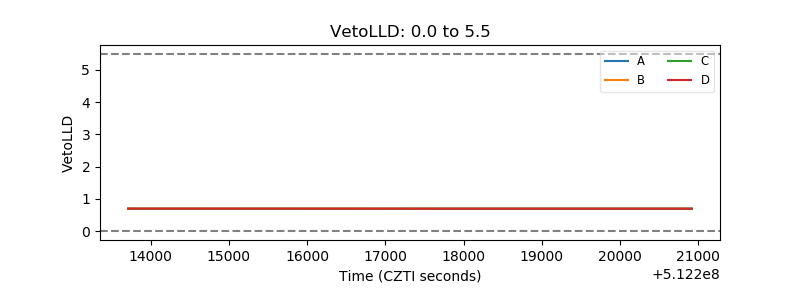 |
| Alpha Counter | 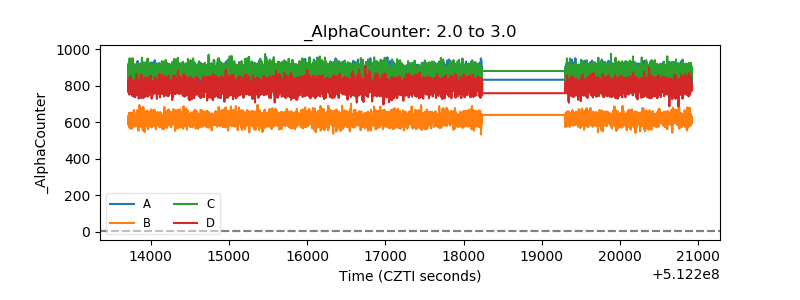 |
| _CPM_Rate | 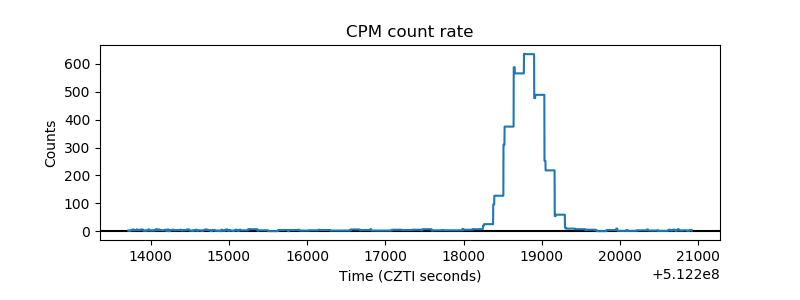 |
| CZT Counter | 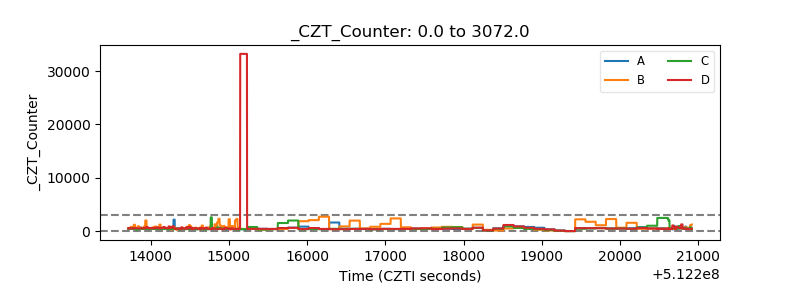 |
| +2.5 Volts monitor |  |
| +5 Volts monitor |  |
| _ROLL_ROT | 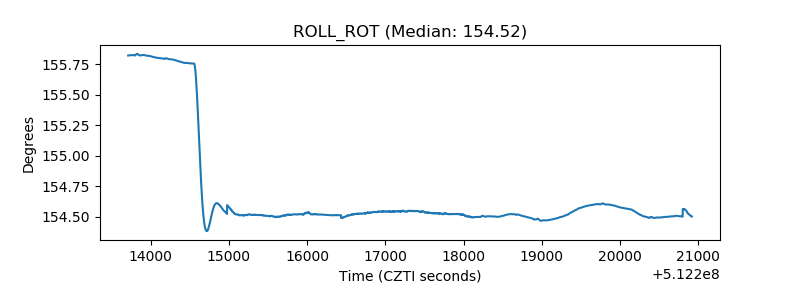 |
| _Roll_DEC | 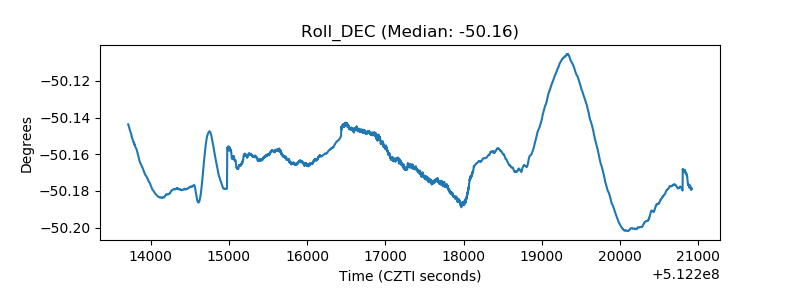 |
| _Roll_RA | 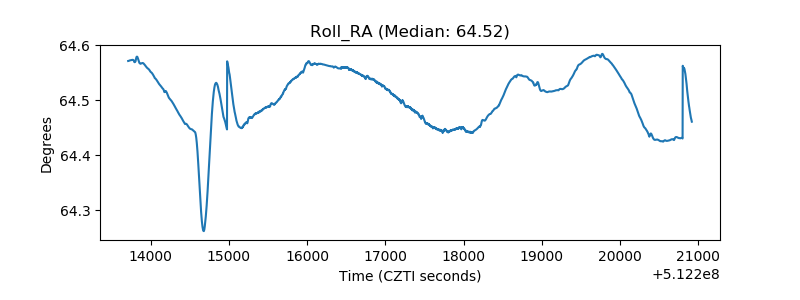 |
| Veto Counter | 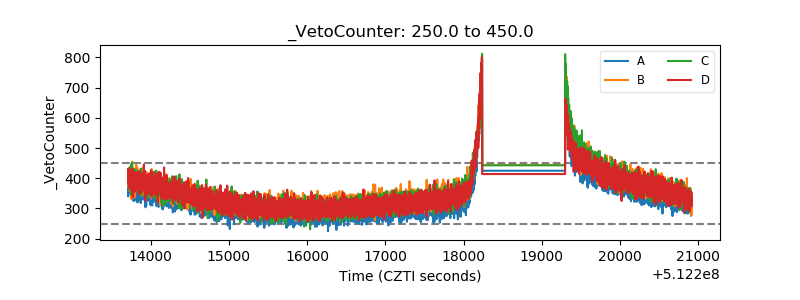 |