| Param | Original file | Final file |
|---|---|---|
| Filename | modeM0/AS1A14_083T05_9000006560_56768cztM0_level2.fits | modeM0/AS1A14_083T05_9000006560_56768cztM0_level2_quad_clean.evt |
| Size (bytes) | 404,130,240 | 90,017,280 |
| Size | 385.4 MB | 85.8 MB |
| Events in quadrant A | 3,643,461 | 589,725 |
| Events in quadrant B | 4,001,881 | 625,493 |
| Events in quadrant C | 3,781,940 | 555,121 |
| Events in quadrant D | 3,060,976 | 531,995 |
| Mode SS | |||
|---|---|---|---|
| Quadrant | BADHDUFLAG | Total packets | Discarded packets |
| A | 0 | 124 | 0 |
| B | 0 | 124 | 0 |
| C | 0 | 124 | 0 |
| D | 0 | 124 | 0 |
| Mode M0 | |||
|---|---|---|---|
| Quadrant | BADHDUFLAG | Total packets | Discarded packets |
| A | 0 | 14956 | 1 |
| B | 0 | 16032 | 1 |
| C | 0 | 15578 | 1 |
| D | 0 | 13467 | 1 |
| Mode M9 | |||
|---|---|---|---|
| Quadrant | BADHDUFLAG | Total packets | Discarded packets |
| A | 0 | 11 | 0 |
| B | 0 | 11 | 0 |
| C | 0 | 11 | 0 |
| D | 0 | 11 | 0 |
| Quadrant | Total seconds | Saturated seconds | Saturation percentage |
|---|---|---|---|
| A | 6060 | 160 | 2.640264% |
| B | 6061 | 243 | 4.009239% |
| C | 6061 | 218 | 3.596766% |
| D | 6061 | 101 | 1.666392% |
Noise dominated data is calculated using 1-second bins in cleaned event files. If a bin has >2000 counts, and if more than 50% of those come from <1% of pixels, then it is considered to be noise-dominated and hence unusable.
| Quadrant | # 1 sec bins | Bins with >0 counts | Bins with >2000 counts | High rate bins dominated by noise | Noise dominated (total time) | Noise dominated (detector-on time) | Marked lightcurve |
|---|---|---|---|---|---|---|---|
| A | 7155 | 6061 | 59 | 59 | 0.82% | 0.97% | 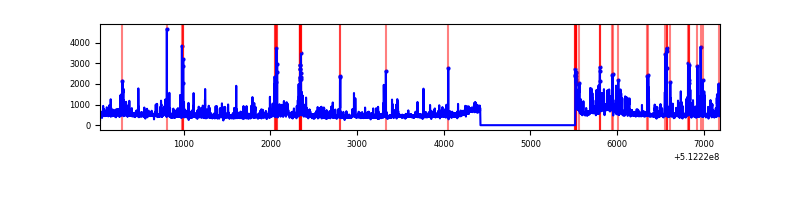 |
| B | 7156 | 6062 | 92 | 92 | 1.29% | 1.52% | 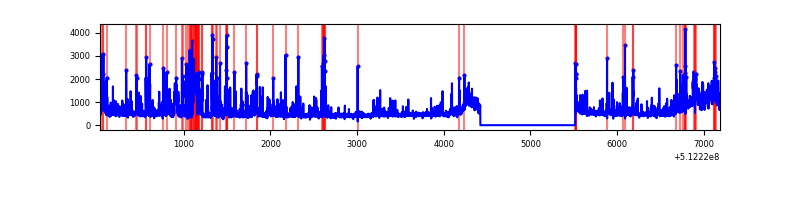 |
| C | 7156 | 6062 | 197 | 197 | 2.75% | 3.25% | 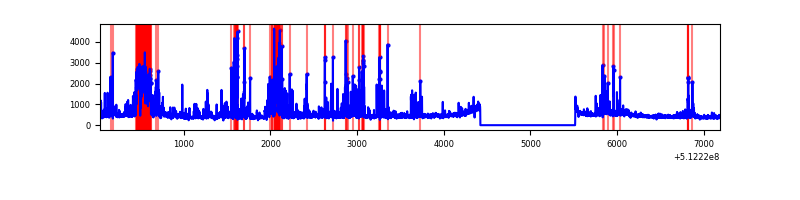 |
| D | 7156 | 6062 | 26 | 26 | 0.36% | 0.43% | 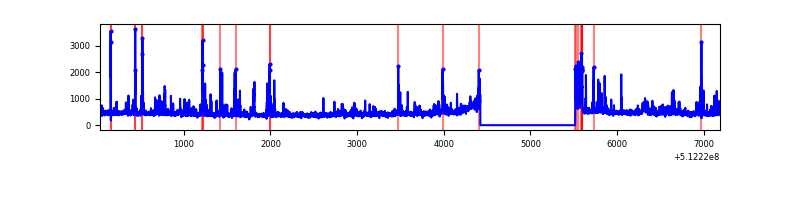 |
Top three noisy pixels from each quadrant. If the there are fewer than three noisy pixels in the level2.evt file, extra rows are filled as -1
| Pixel properties | Quadrant properties | ||||||
|---|---|---|---|---|---|---|---|
| Quadrant | DetID | PixID | Counts | Sigma | Mean | Median | Sigma |
| A | 3 | 14 | 657354 | 3992.32 | 658 | 640 | 164.5 |
| A | 10 | 251 | 326990 | 1983.96 | 658 | 640 | 164.5 |
| A | 3 | 62 | 71602 | 431.4 | 658 | 640 | 164.5 |
| B | 5 | 185 | 515038 | 3776.34 | 644 | 623 | 136.2 |
| B | 4 | 206 | 462340 | 3389.48 | 644 | 623 | 136.2 |
| B | 10 | 247 | 168410 | 1231.73 | 644 | 623 | 136.2 |
| C | 14 | 96 | 651047 | 3770.94 | 627 | 621 | 172.5 |
| C | 13 | 3 | 433761 | 2511.19 | 627 | 621 | 172.5 |
| C | 14 | 254 | 50105 | 286.89 | 627 | 621 | 172.5 |
| D | 2 | 249 | 233060 | 1289.12 | 636 | 607 | 180.3 |
| D | 2 | 120 | 60754 | 333.56 | 636 | 607 | 180.3 |
| D | 5 | 173 | 50167 | 274.85 | 636 | 607 | 180.3 |
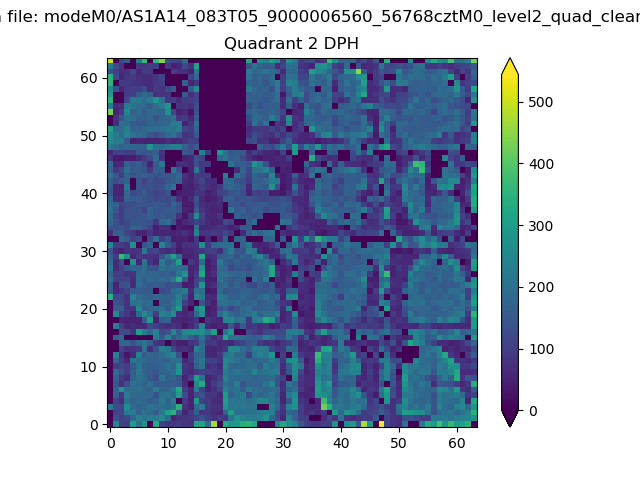
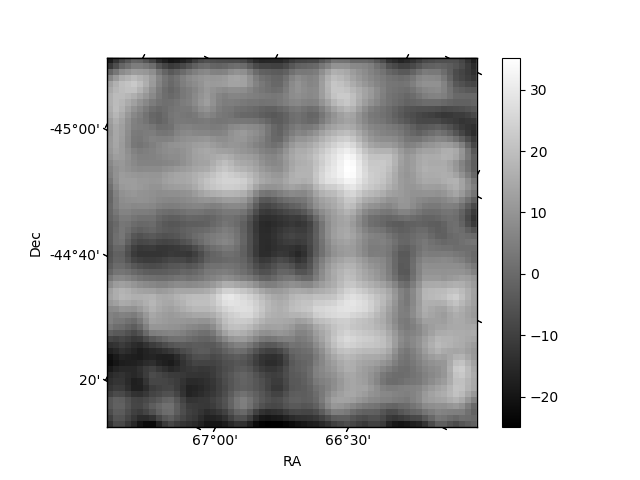
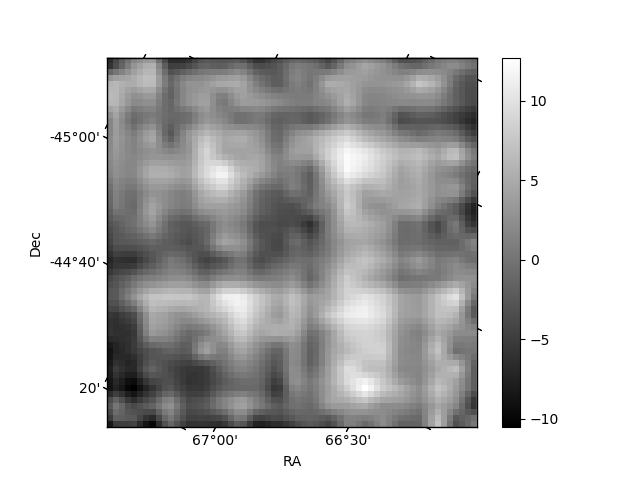
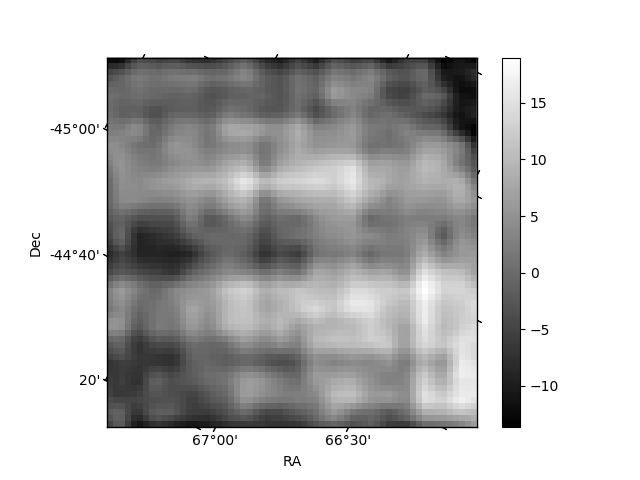
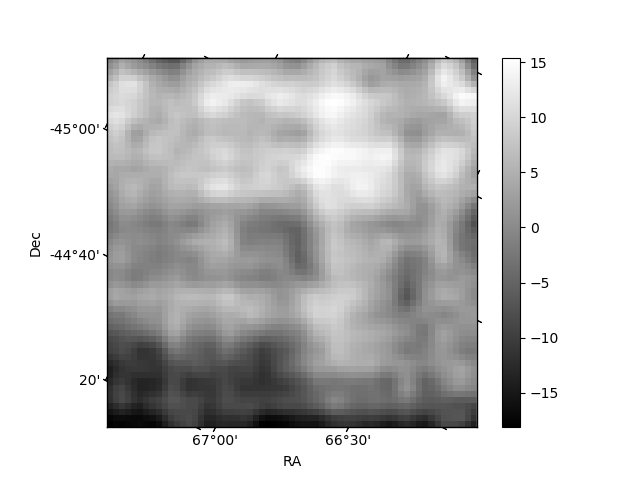
Histogram calculated using DETX and DETY for each event in the final _common_clean file
| Quadrant A | 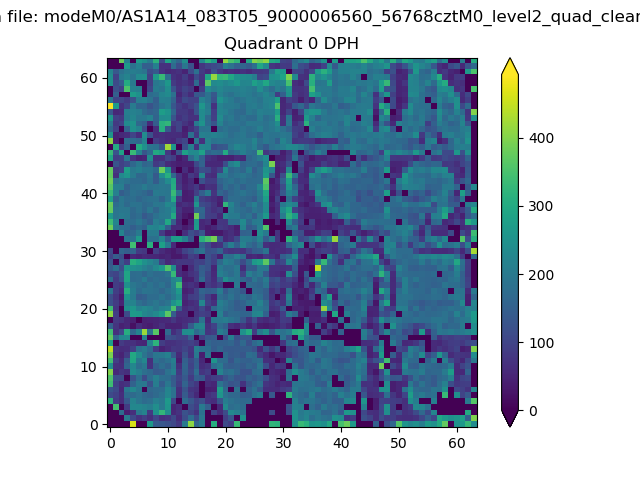 |
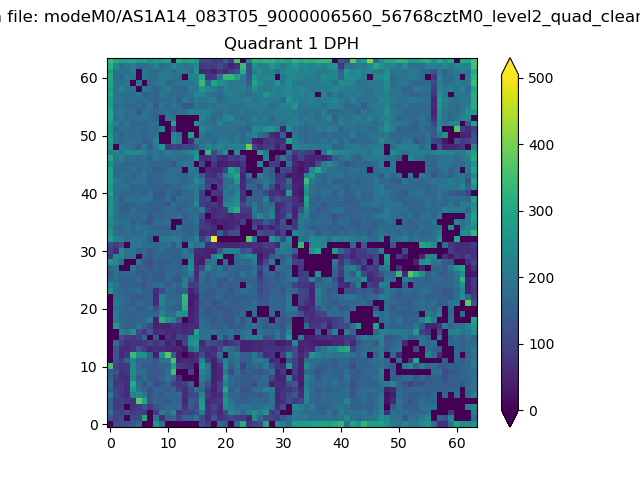 |
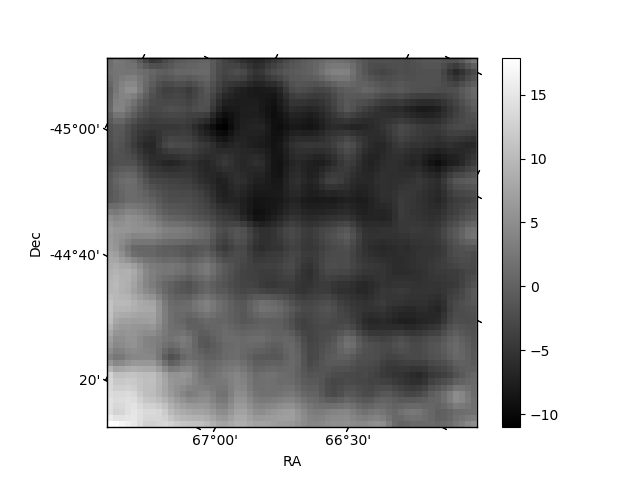
Quadrant B |
|---|---|---|---|
| Quadrant D | 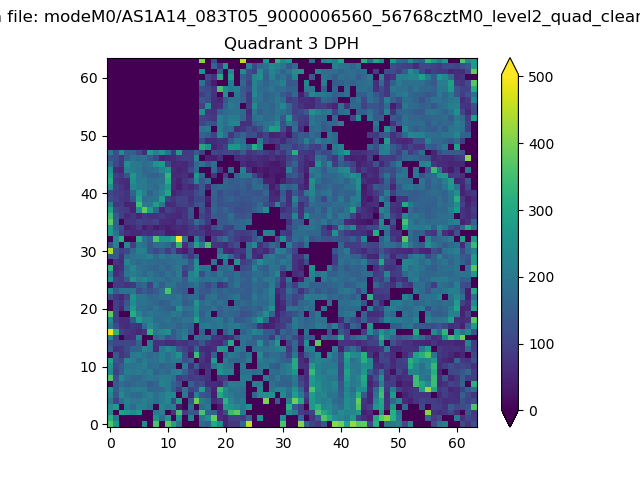 |
 |
Quadrant C |
| Plot type | Count rate plots | Images |
|---|---|---|
| Comparison with Poisson distribution Blue bars denote a histogram of data divided into 1 sec bins. Red curve is a Poisson curve with rate = median count rate of data. |
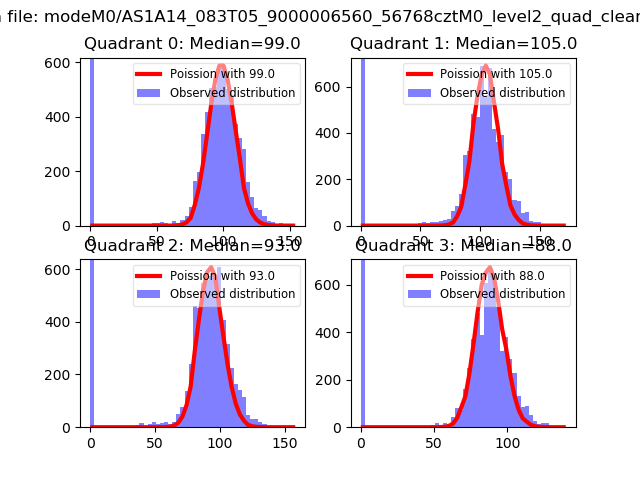 |
 |
| Quadrant-wise count rates Data is divided into 100 sec bins |
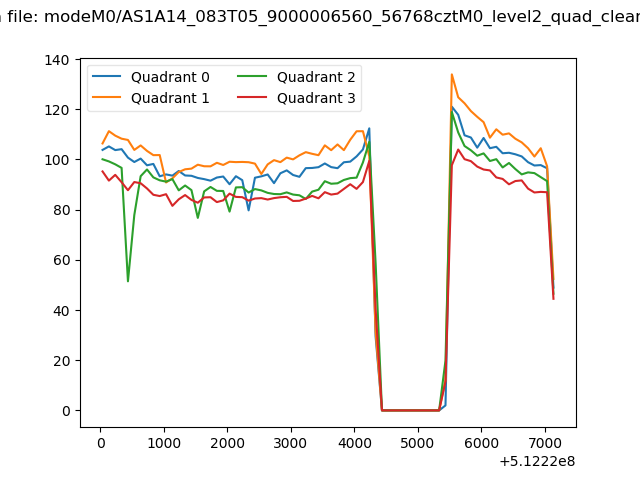 |
|
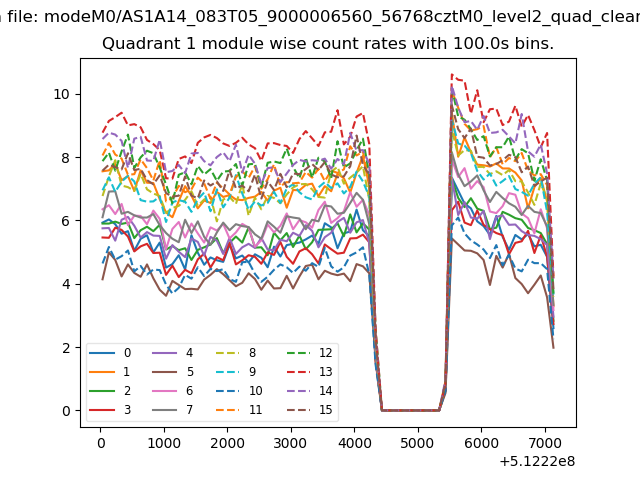
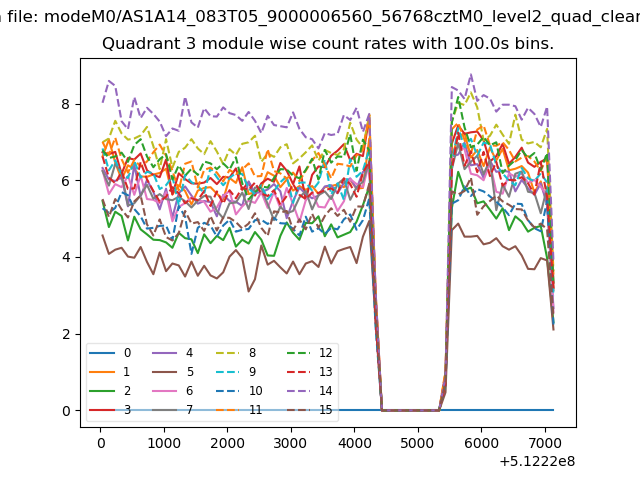
| Module-wise count rates for Quadrant A Data is divided into 100 sec bins |
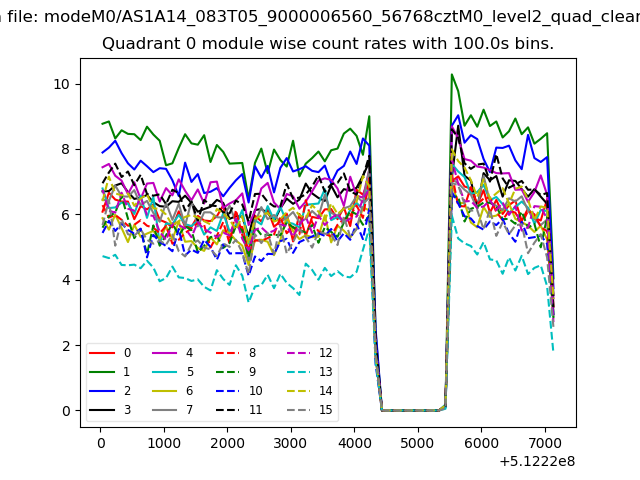 |
 |
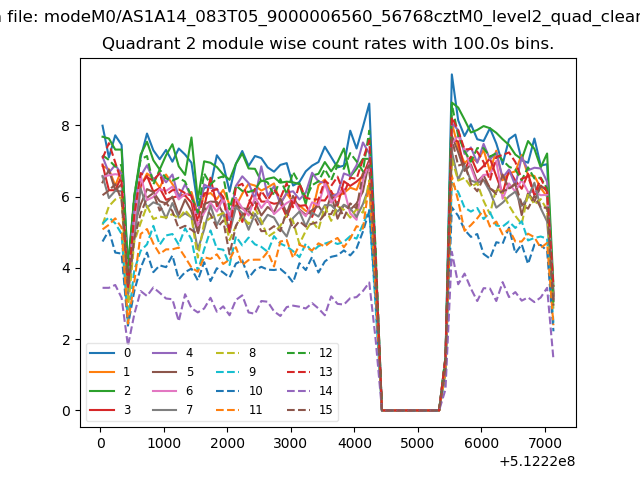
| Module-wise count rates for Quadrant B Data is divided into 100 sec bins |
 |
 |
| Module-wise count rates for Quadrant C Data is divided into 100 sec bins |
 |
 |
| Module-wise count rates for Quadrant D Data is divided into 100 sec bins |
 |
 |
| Parameter | Plot |
|---|---|
| CZT HV Monitor | 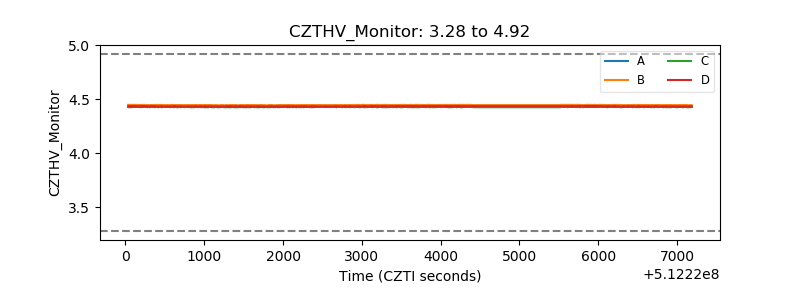 |
| D_VDD | 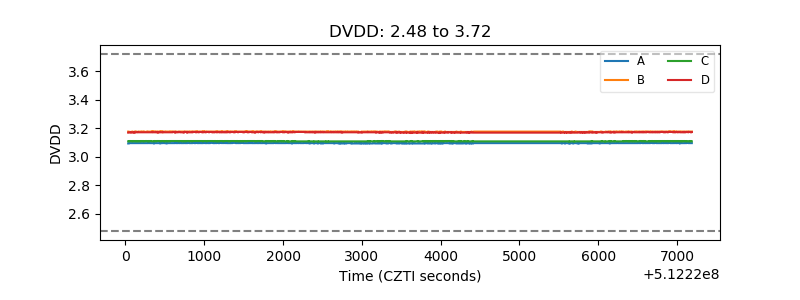 |
| Temperature 1 | 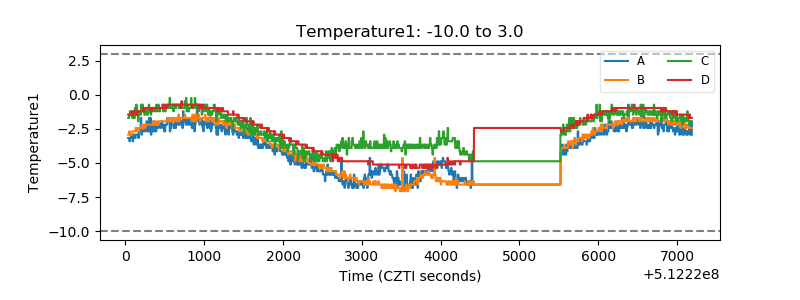 |
| Veto HV Monitor |  |
| Veto LLD | 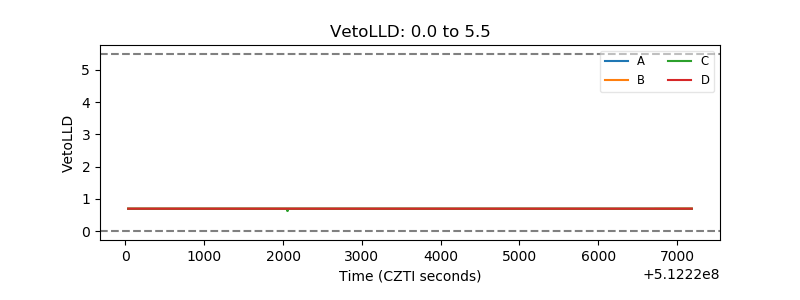 |
| Alpha Counter | 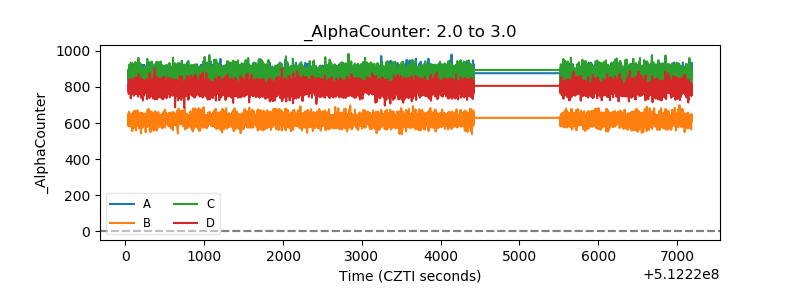 |
| _CPM_Rate | 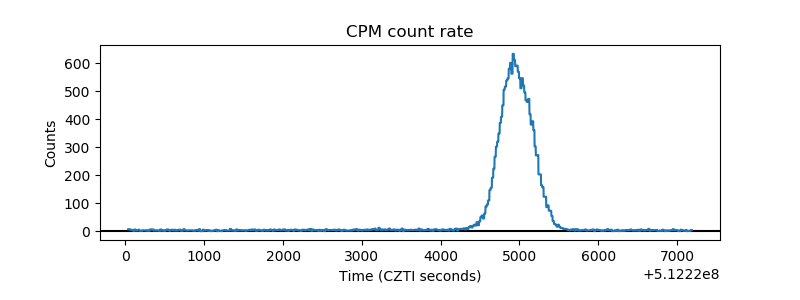 |
| CZT Counter | 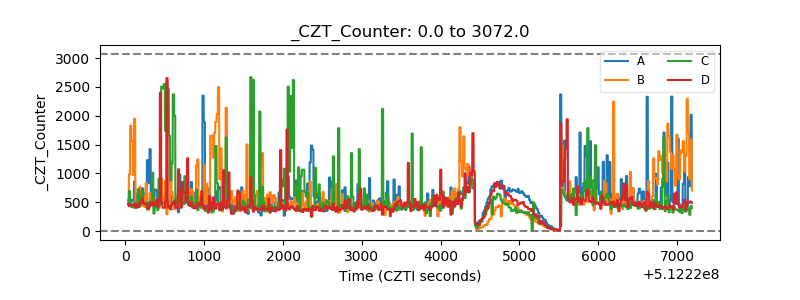 |
| +2.5 Volts monitor |  |
| +5 Volts monitor |  |
| _ROLL_ROT | 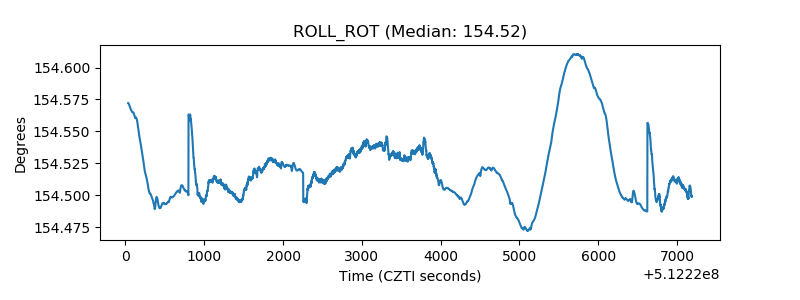 |
| _Roll_DEC | 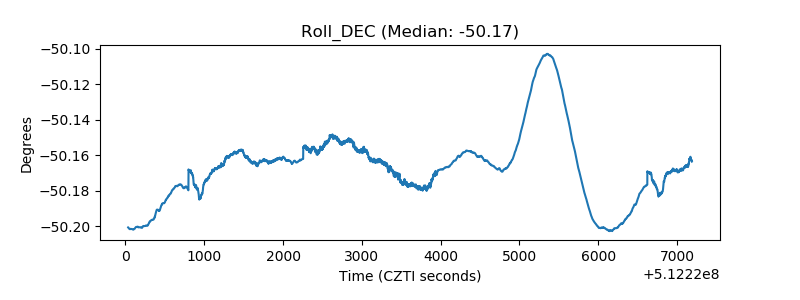 |
| _Roll_RA | 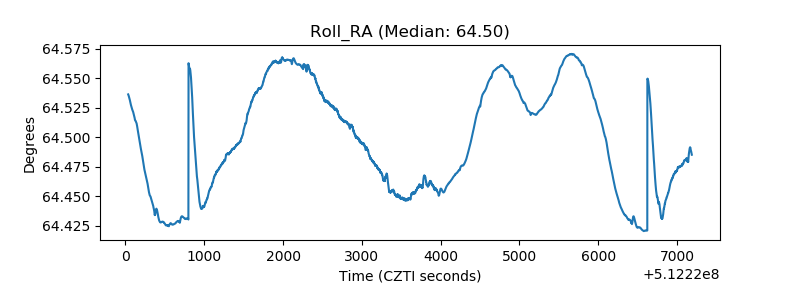 |
| Veto Counter | 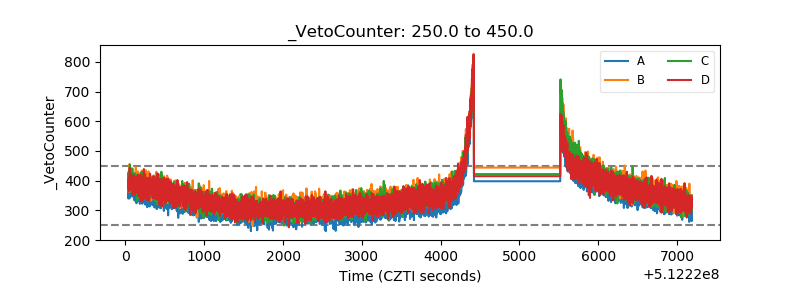 |