| Param | Original file | Final file |
|---|---|---|
| Filename | modeM0/AS1A14_083T05_9000006560_56770cztM0_level2.fits | modeM0/AS1A14_083T05_9000006560_56770cztM0_level2_quad_clean.evt |
| Size (bytes) | 500,302,080 | 90,158,400 |
| Size | 477.1 MB | 86.0 MB |
| Events in quadrant A | 4,599,071 | 586,862 |
| Events in quadrant B | 6,040,488 | 565,315 |
| Events in quadrant C | 4,052,733 | 578,767 |
| Events in quadrant D | 3,327,978 | 551,028 |
| Mode SS | |||
|---|---|---|---|
| Quadrant | BADHDUFLAG | Total packets | Discarded packets |
| A | 0 | 130 | 0 |
| B | 0 | 130 | 0 |
| C | 0 | 130 | 0 |
| D | 0 | 130 | 0 |
| Mode M0 | |||
|---|---|---|---|
| Quadrant | BADHDUFLAG | Total packets | Discarded packets |
| A | 0 | 18137 | 4 |
| B | 0 | 22437 | 1 |
| C | 0 | 16689 | 1 |
| D | 0 | 14636 | 1 |
| Mode M9 | |||
|---|---|---|---|
| Quadrant | BADHDUFLAG | Total packets | Discarded packets |
| A | 0 | 10 | 0 |
| B | 0 | 10 | 0 |
| C | 0 | 10 | 0 |
| D | 0 | 10 | 0 |
| Quadrant | Total seconds | Saturated seconds | Saturation percentage |
|---|---|---|---|
| A | 6424 | 447 | 6.958281% |
| B | 6424 | 1128 | 17.559153% |
| C | 6425 | 151 | 2.350195% |
| D | 6425 | 71 | 1.105058% |
Noise dominated data is calculated using 1-second bins in cleaned event files. If a bin has >2000 counts, and if more than 50% of those come from <1% of pixels, then it is considered to be noise-dominated and hence unusable.
| Quadrant | # 1 sec bins | Bins with >0 counts | Bins with >2000 counts | High rate bins dominated by noise | Noise dominated (total time) | Noise dominated (detector-on time) | Marked lightcurve |
|---|---|---|---|---|---|---|---|
| A | 7404 | 6425 | 369 | 369 | 4.98% | 5.74% | 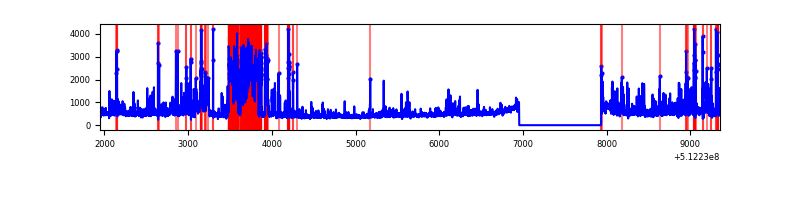 |
| B | 7404 | 6425 | 934 | 934 | 12.61% | 14.54% | 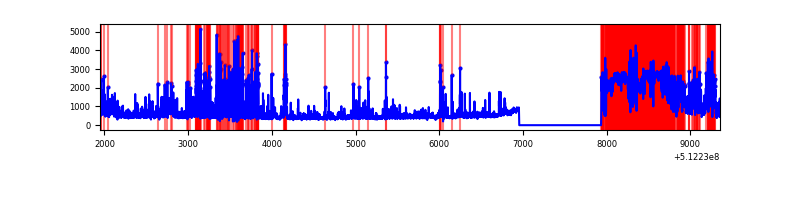 |
| C | 7405 | 6426 | 154 | 154 | 2.08% | 2.40% | 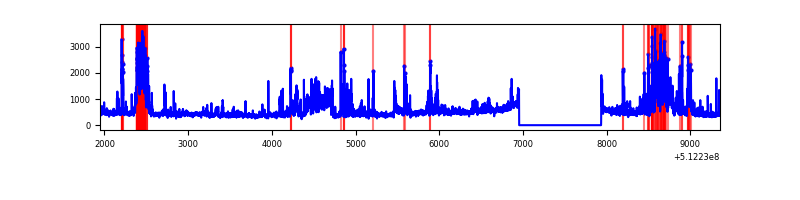 |
| D | 7405 | 6426 | 50 | 50 | 0.68% | 0.78% | 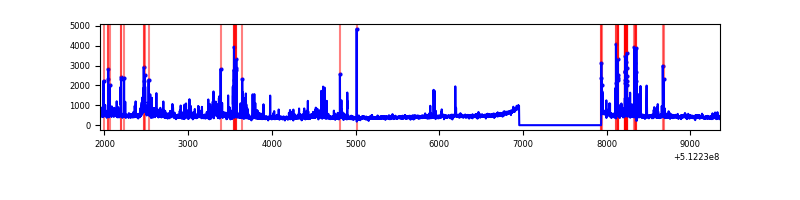 |
Top three noisy pixels from each quadrant. If the there are fewer than three noisy pixels in the level2.evt file, extra rows are filled as -1
| Pixel properties | Quadrant properties | ||||||
|---|---|---|---|---|---|---|---|
| Quadrant | DetID | PixID | Counts | Sigma | Mean | Median | Sigma |
| A | 3 | 62 | 1018510 | 6091.7 | 672 | 653 | 167.1 |
| A | 3 | 14 | 561654 | 3357.5 | 672 | 653 | 167.1 |
| A | 10 | 251 | 248434 | 1482.93 | 672 | 653 | 167.1 |
| B | 5 | 172 | 2097601 | 16091.76 | 601 | 580 | 130.3 |
| B | 4 | 206 | 638394 | 4894.35 | 601 | 580 | 130.3 |
| B | 5 | 185 | 556762 | 4267.93 | 601 | 580 | 130.3 |
| C | 9 | 38 | 520052 | 2898.57 | 654 | 645 | 179.2 |
| C | 12 | 249 | 324538 | 1807.49 | 654 | 645 | 179.2 |
| C | 15 | 230 | 315078 | 1754.7 | 654 | 645 | 179.2 |
| D | 2 | 249 | 219208 | 1174.49 | 656 | 628 | 186.1 |
| D | 11 | 129 | 165200 | 884.29 | 656 | 628 | 186.1 |
| D | 2 | 120 | 159140 | 851.73 | 656 | 628 | 186.1 |
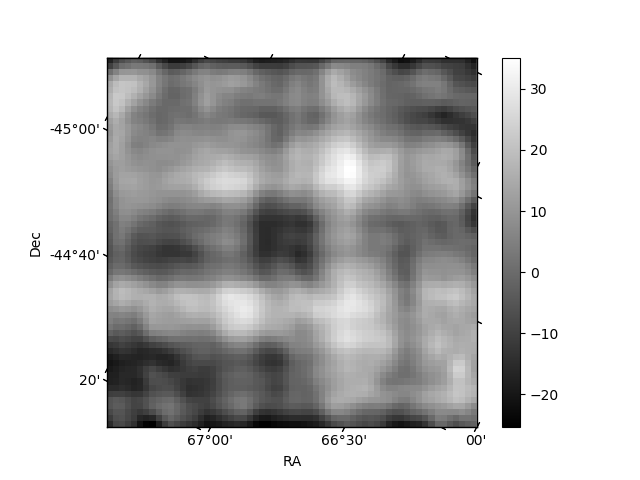
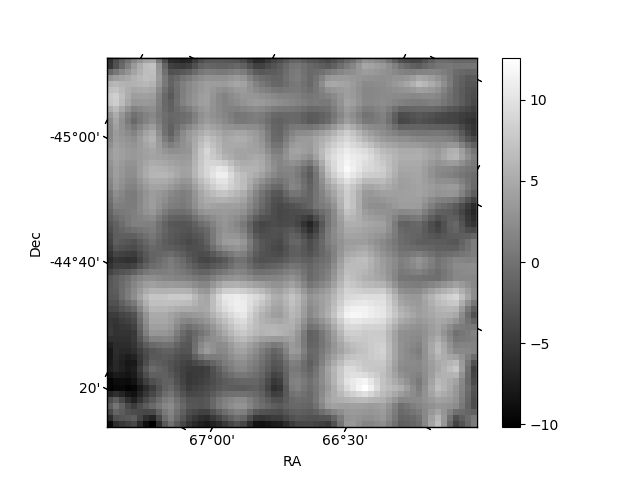
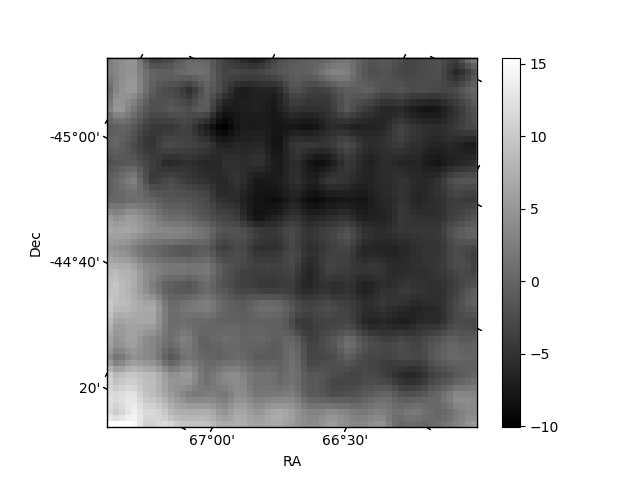
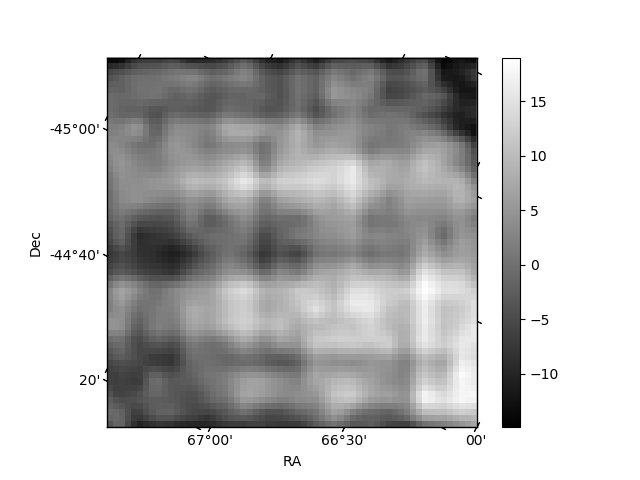
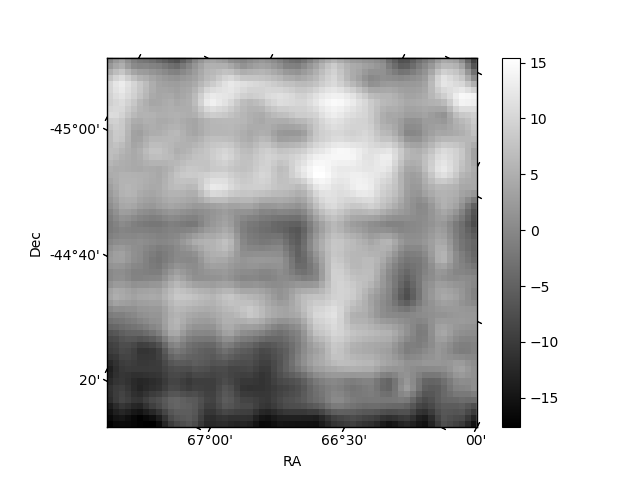
Histogram calculated using DETX and DETY for each event in the final _common_clean file
| Quadrant A | 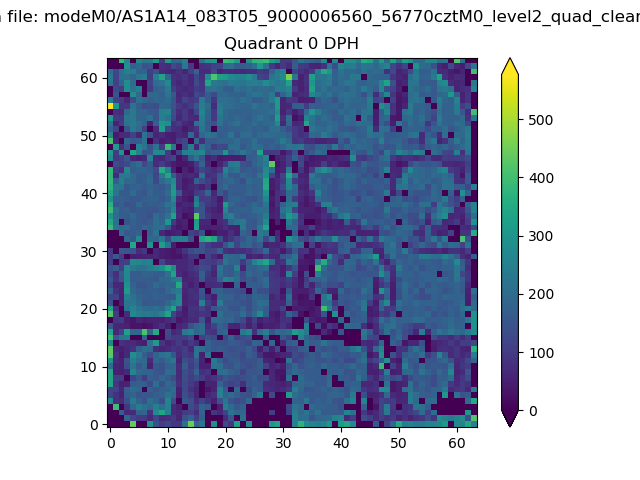 |
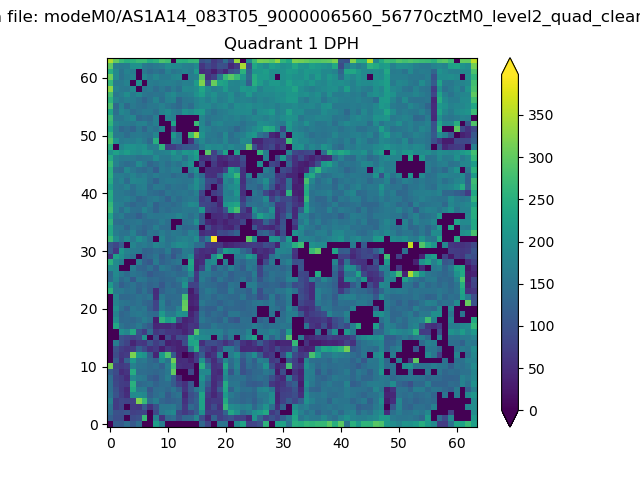 |
Quadrant B |
|---|---|---|---|
| Quadrant D | 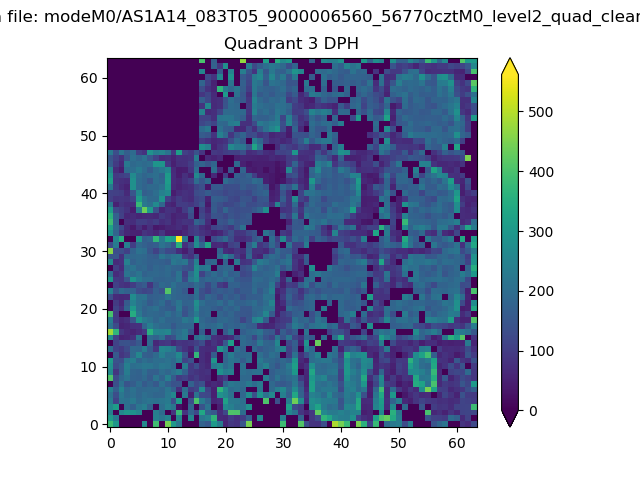 |
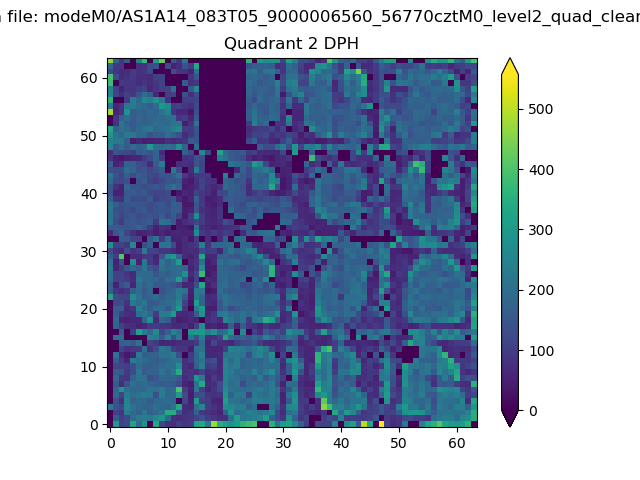 |
Quadrant C |
| Plot type | Count rate plots | Images |
|---|---|---|
| Comparison with Poisson distribution Blue bars denote a histogram of data divided into 1 sec bins. Red curve is a Poisson curve with rate = median count rate of data. |
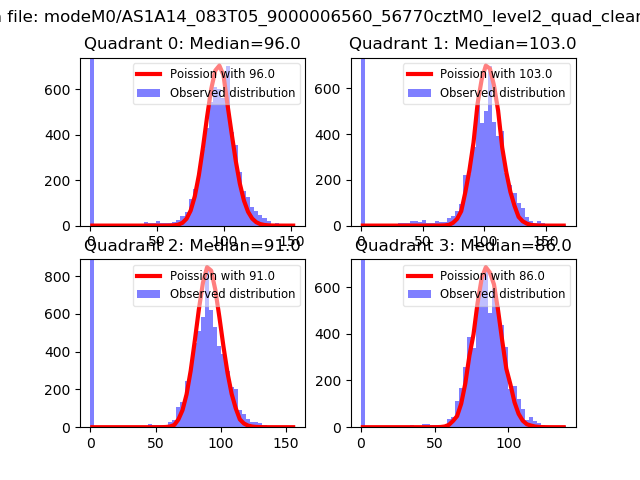 |
 |
| Quadrant-wise count rates Data is divided into 100 sec bins |
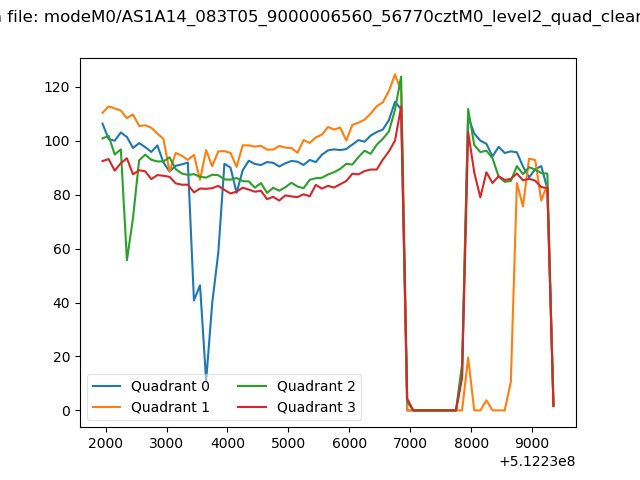 |
|
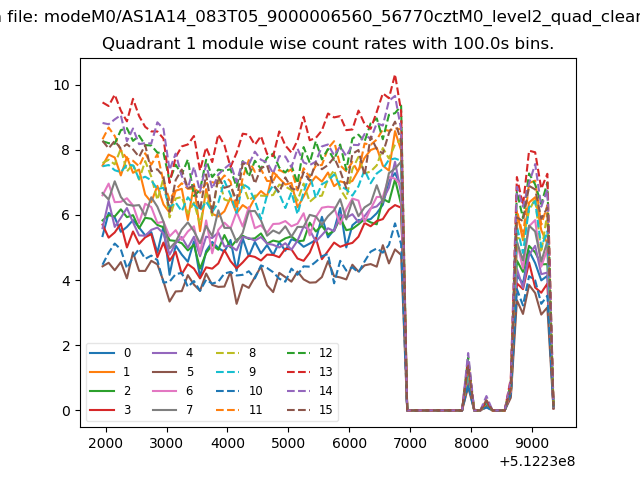
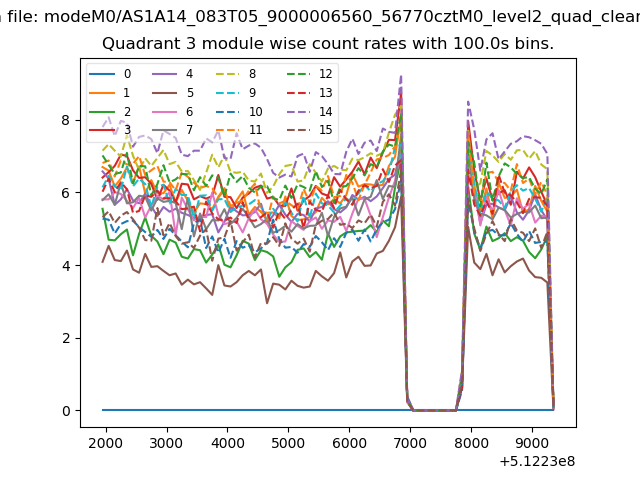
| Module-wise count rates for Quadrant A Data is divided into 100 sec bins |
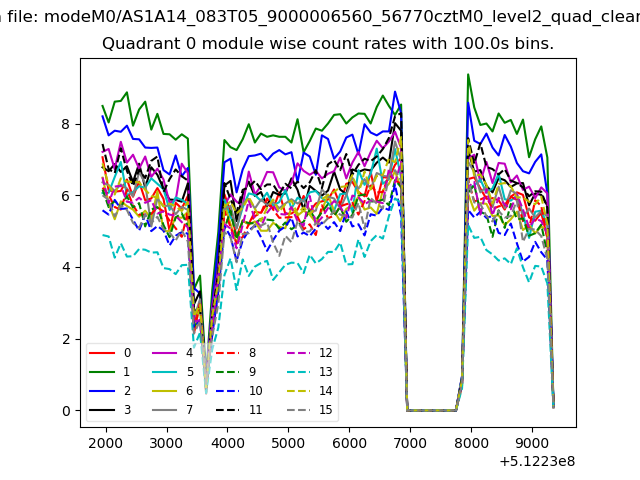 |
 |
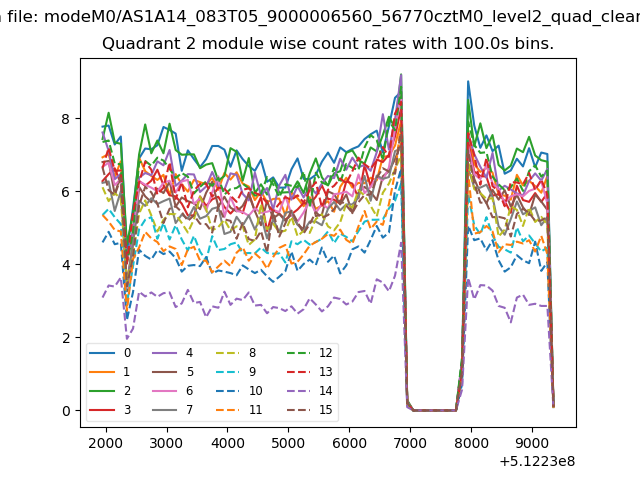
| Module-wise count rates for Quadrant B Data is divided into 100 sec bins |
 |
 |
| Module-wise count rates for Quadrant C Data is divided into 100 sec bins |
 |
 |
| Module-wise count rates for Quadrant D Data is divided into 100 sec bins |
 |
 |
| Parameter | Plot |
|---|---|
| CZT HV Monitor | 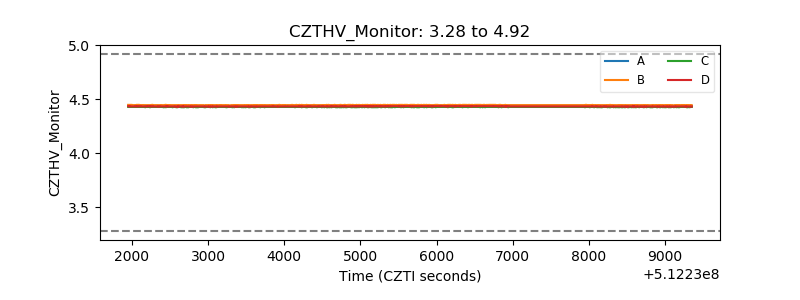 |
| D_VDD | 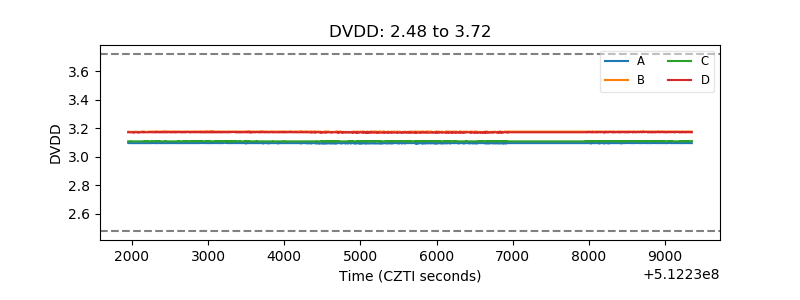 |
| Temperature 1 | 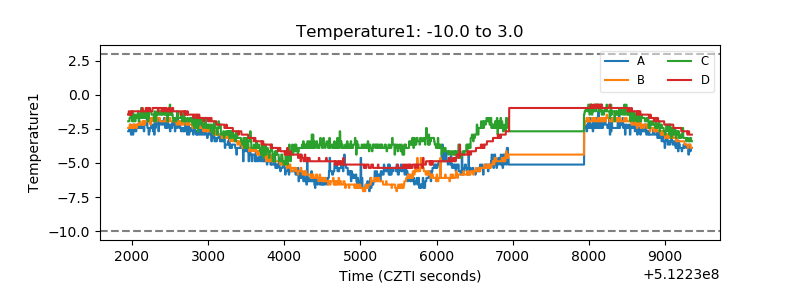 |
| Veto HV Monitor | 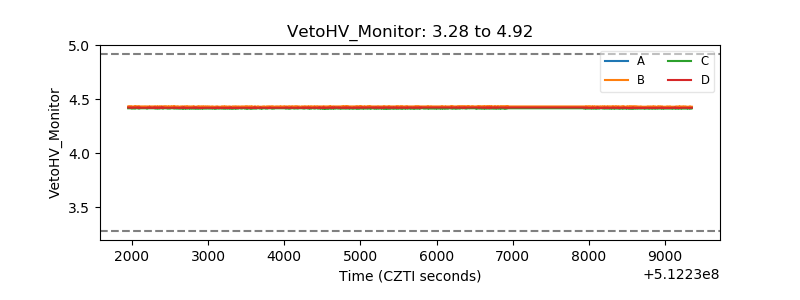 |
| Veto LLD | 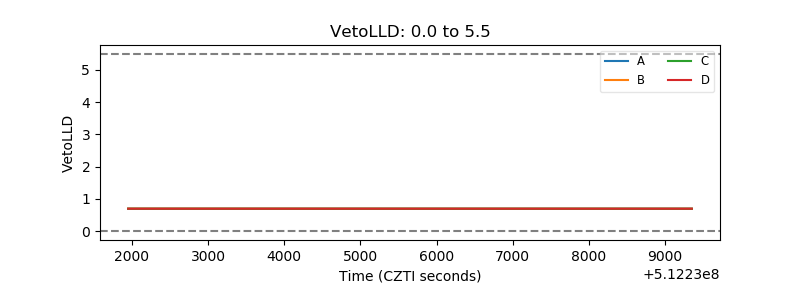 |
| Alpha Counter | 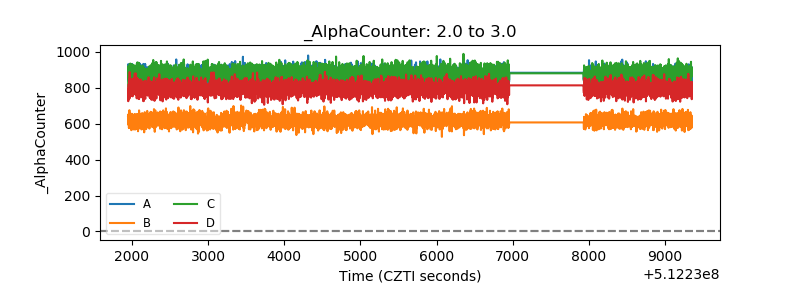 |
| _CPM_Rate | 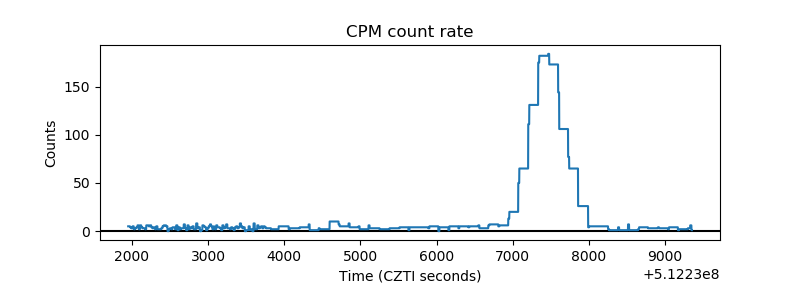 |
| CZT Counter | 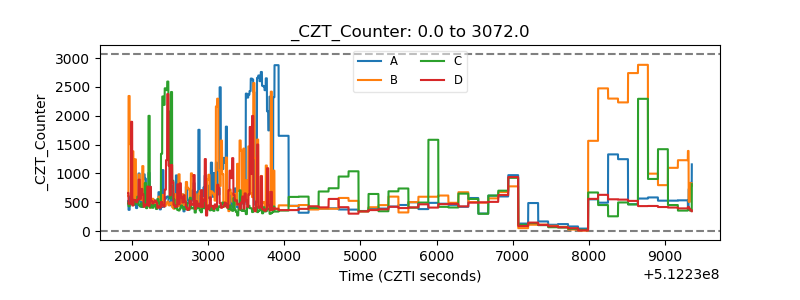 |
| +2.5 Volts monitor |  |
| +5 Volts monitor |  |
| _ROLL_ROT | 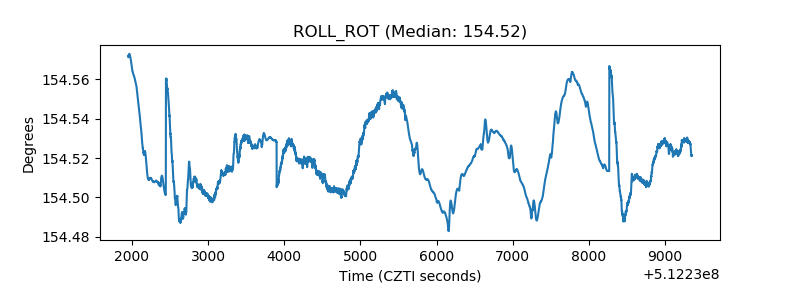 |
| _Roll_DEC | 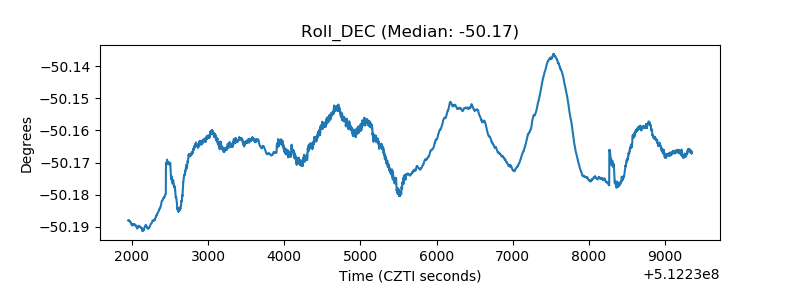 |
| _Roll_RA | 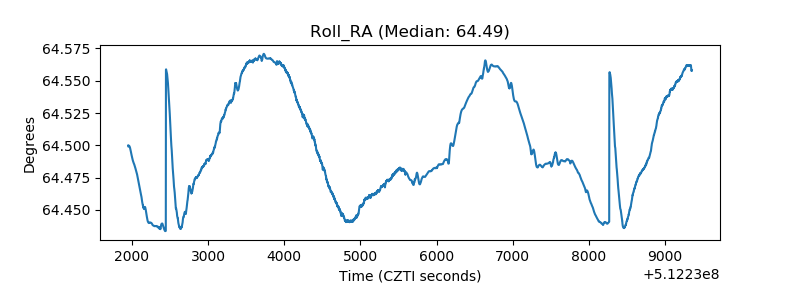 |
| Veto Counter | 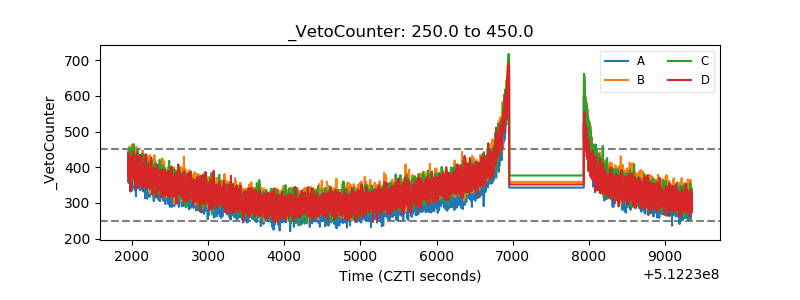 |