| Param | Original file | Final file |
|---|---|---|
| Filename | modeM0/AS1A14_083T05_9000006560_56772cztM0_level2.fits | modeM0/AS1A14_083T05_9000006560_56772cztM0_level2_quad_clean.evt |
| Size (bytes) | 640,857,600 | 100,327,680 |
| Size | 611.2 MB | 95.7 MB |
| Events in quadrant A | 5,283,686 | 681,607 |
| Events in quadrant B | 6,616,519 | 648,590 |
| Events in quadrant C | 7,525,293 | 577,034 |
| Events in quadrant D | 3,726,281 | 617,687 |
| Mode SS | |||
|---|---|---|---|
| Quadrant | BADHDUFLAG | Total packets | Discarded packets |
| A | 0 | 150 | 0 |
| B | 0 | 150 | 0 |
| C | 0 | 150 | 0 |
| D | 0 | 150 | 0 |
| Mode M0 | |||
|---|---|---|---|
| Quadrant | BADHDUFLAG | Total packets | Discarded packets |
| A | 0 | 20897 | 1 |
| B | 0 | 24849 | 1 |
| C | 0 | 27493 | 1 |
| D | 0 | 16573 | 1 |
| Mode M9 | |||
|---|---|---|---|
| Quadrant | BADHDUFLAG | Total packets | Discarded packets |
| A | 0 | 2 | 0 |
| B | 0 | 2 | 0 |
| C | 0 | 2 | 0 |
| D | 0 | 2 | 0 |
| Quadrant | Total seconds | Saturated seconds | Saturation percentage |
|---|---|---|---|
| A | 7364 | 200 | 2.715915% |
| B | 7364 | 1172 | 15.915263% |
| C | 7364 | 1061 | 14.407930% |
| D | 7364 | 122 | 1.656708% |
Noise dominated data is calculated using 1-second bins in cleaned event files. If a bin has >2000 counts, and if more than 50% of those come from <1% of pixels, then it is considered to be noise-dominated and hence unusable.
| Quadrant | # 1 sec bins | Bins with >0 counts | Bins with >2000 counts | High rate bins dominated by noise | Noise dominated (total time) | Noise dominated (detector-on time) | Marked lightcurve |
|---|---|---|---|---|---|---|---|
| A | 7604 | 7365 | 89 | 89 | 1.17% | 1.21% | 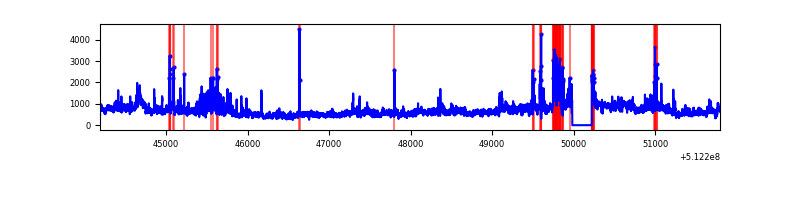 |
| B | 7604 | 7365 | 678 | 678 | 8.92% | 9.21% | 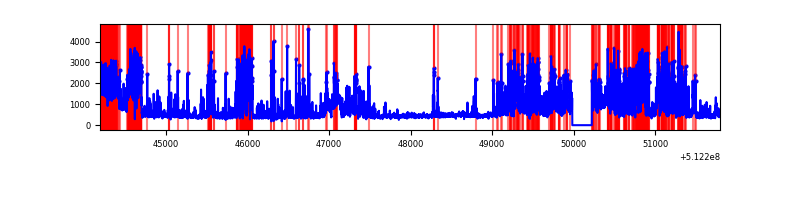 |
| C | 7604 | 7365 | 828 | 828 | 10.89% | 11.24% | 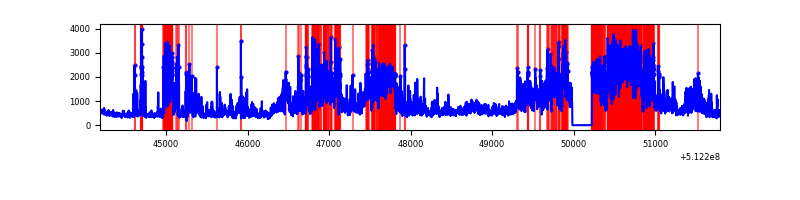 |
| D | 7604 | 7365 | 74 | 74 | 0.97% | 1.00% | 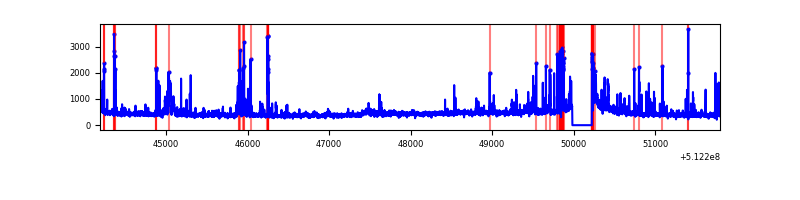 |
Top three noisy pixels from each quadrant. If the there are fewer than three noisy pixels in the level2.evt file, extra rows are filled as -1
| Pixel properties | Quadrant properties | ||||||
|---|---|---|---|---|---|---|---|
| Quadrant | DetID | PixID | Counts | Sigma | Mean | Median | Sigma |
| A | 3 | 14 | 1756756 | 9133.51 | 774 | 753 | 192.3 |
| A | 3 | 62 | 169319 | 876.76 | 774 | 753 | 192.3 |
| A | 10 | 251 | 146645 | 758.83 | 774 | 753 | 192.3 |
| B | 4 | 206 | 2488302 | 15789.13 | 729 | 701 | 157.6 |
| B | 5 | 172 | 662770 | 4202.24 | 729 | 701 | 157.6 |
| B | 10 | 247 | 186323 | 1178.17 | 729 | 701 | 157.6 |
| C | 9 | 38 | 2515135 | 12902.05 | 708 | 701 | 194.9 |
| C | 15 | 230 | 1445636 | 7414.24 | 708 | 701 | 194.9 |
| C | 14 | 96 | 446104 | 2285.45 | 708 | 701 | 194.9 |
| D | 2 | 249 | 403693 | 1913.3 | 745 | 713 | 210.6 |
| D | 15 | 142 | 110915 | 523.23 | 745 | 713 | 210.6 |
| D | 2 | 31 | 99228 | 467.74 | 745 | 713 | 210.6 |
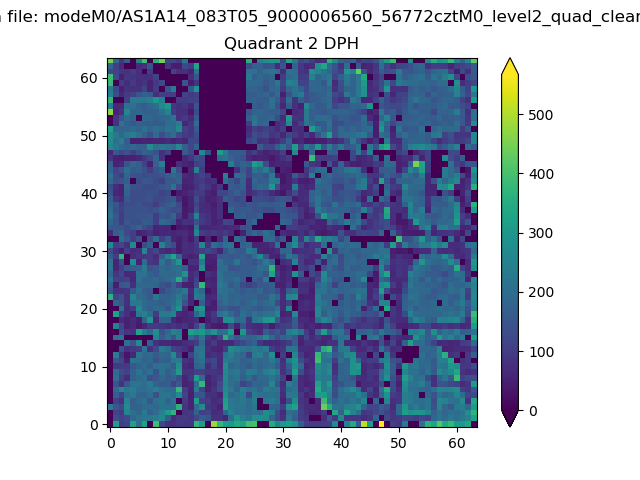
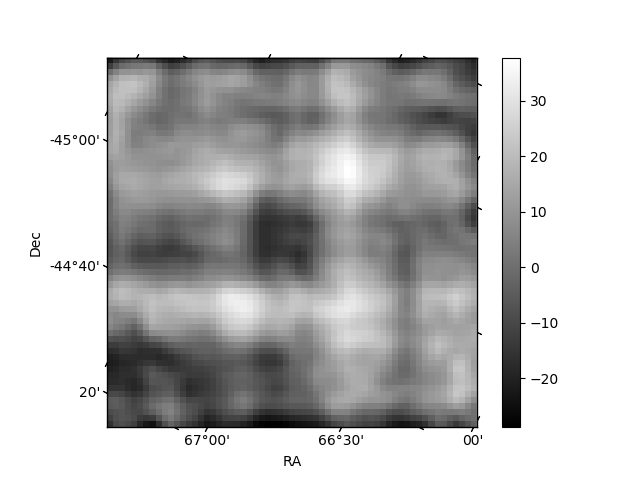
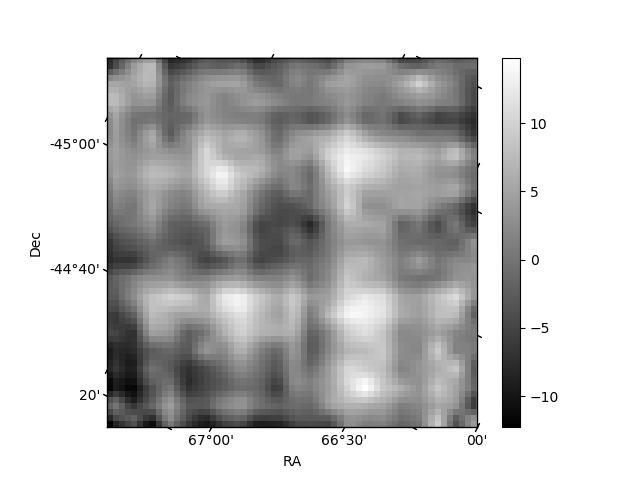
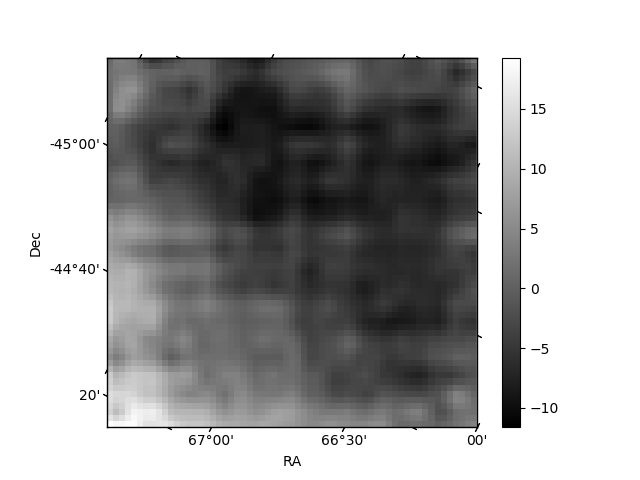
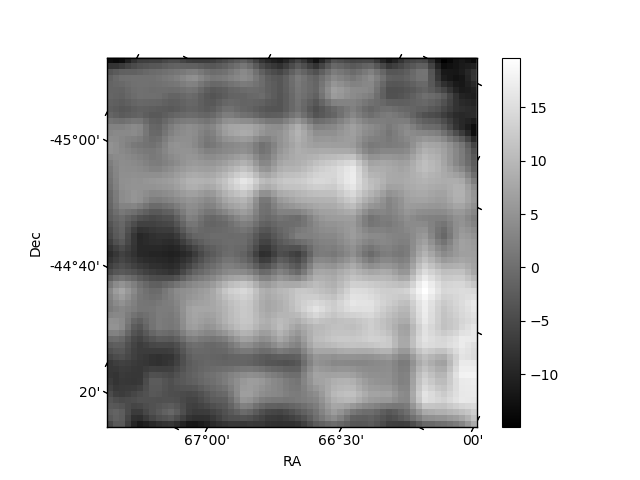
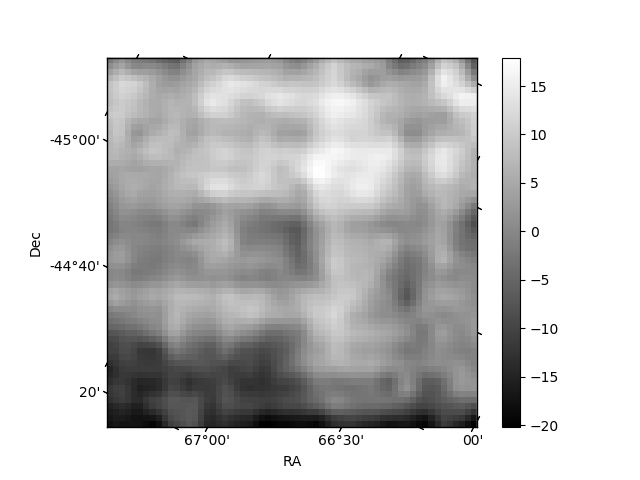
Histogram calculated using DETX and DETY for each event in the final _common_clean file
| Quadrant A | 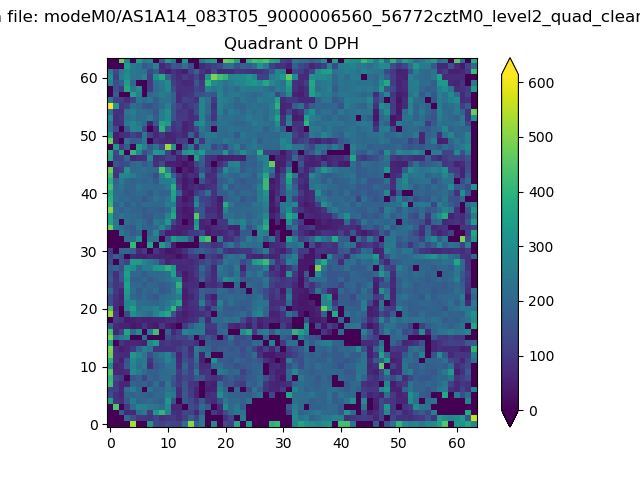 |
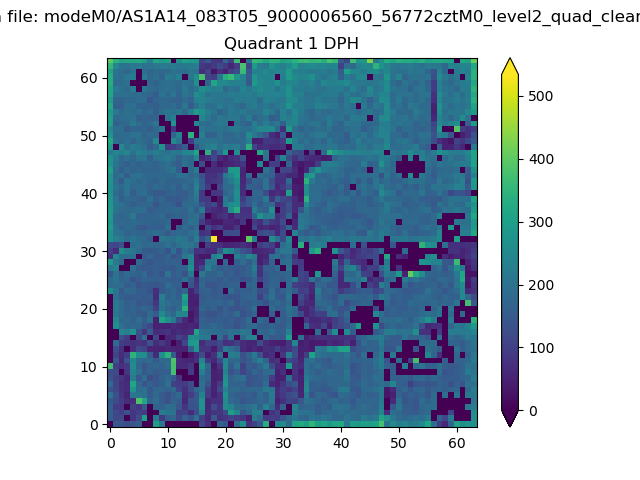 |
Quadrant B |
|---|---|---|---|
| Quadrant D | 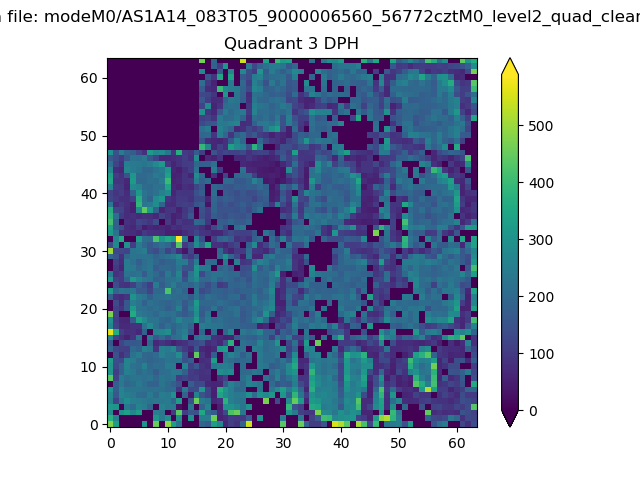 |
 |
Quadrant C |
| Plot type | Count rate plots | Images |
|---|---|---|
| Comparison with Poisson distribution Blue bars denote a histogram of data divided into 1 sec bins. Red curve is a Poisson curve with rate = median count rate of data. |
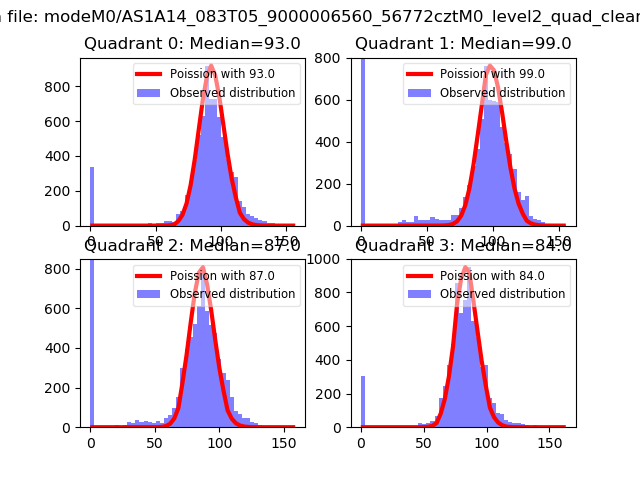 |
 |
| Quadrant-wise count rates Data is divided into 100 sec bins |
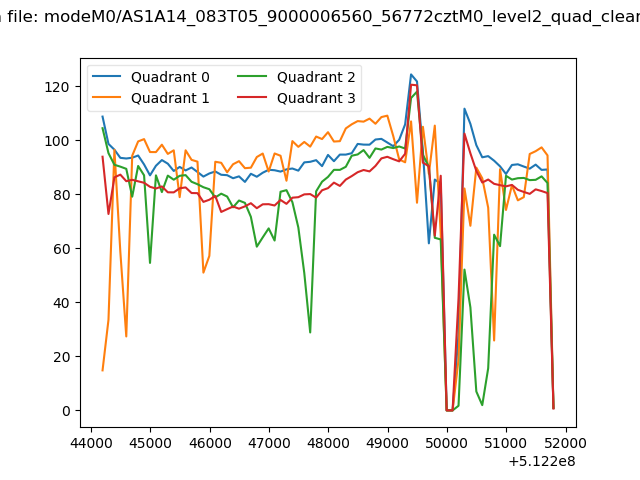 |
|
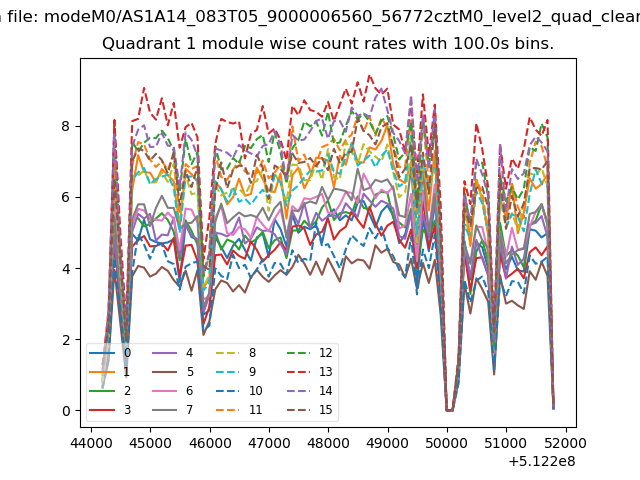
| Module-wise count rates for Quadrant A Data is divided into 100 sec bins |
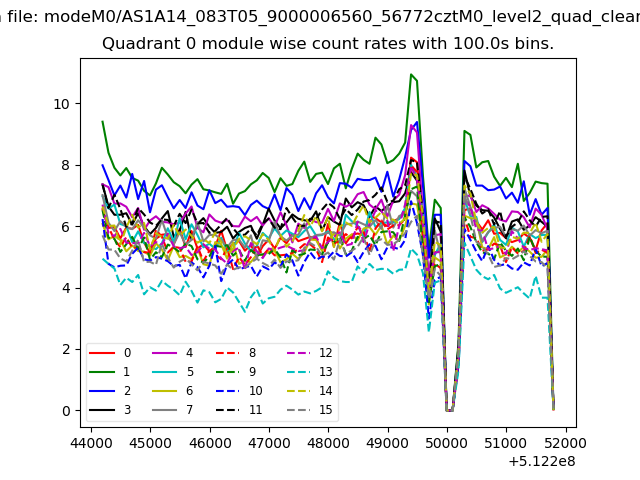 |
 |
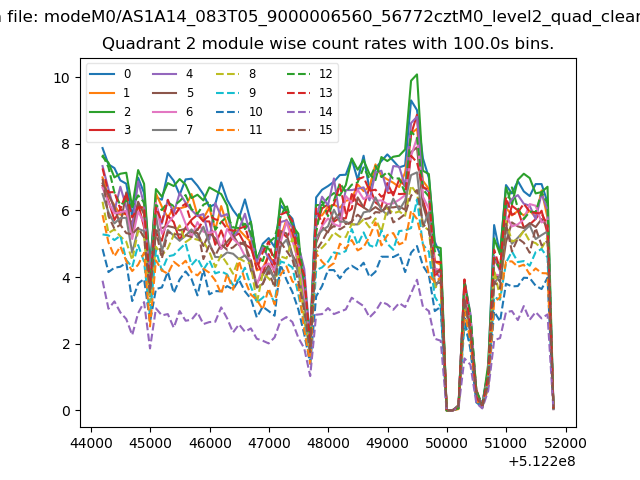
| Module-wise count rates for Quadrant B Data is divided into 100 sec bins |
 |
 |
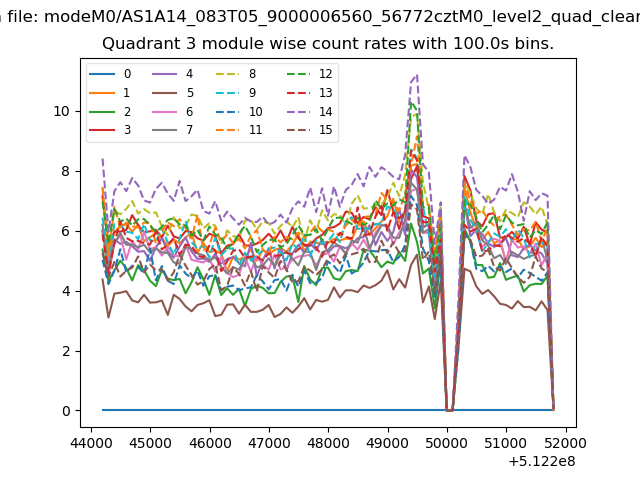
| Module-wise count rates for Quadrant C Data is divided into 100 sec bins |
 |
 |
| Module-wise count rates for Quadrant D Data is divided into 100 sec bins |
 |
 |
| Parameter | Plot |
|---|---|
| CZT HV Monitor | 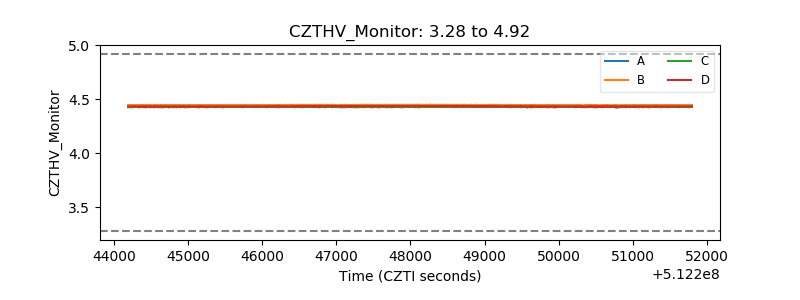 |
| D_VDD | 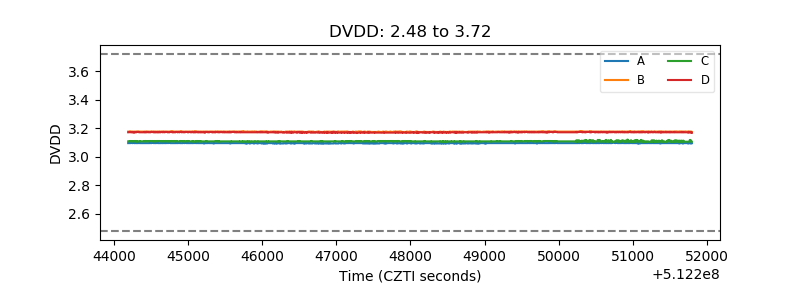 |
| Temperature 1 | 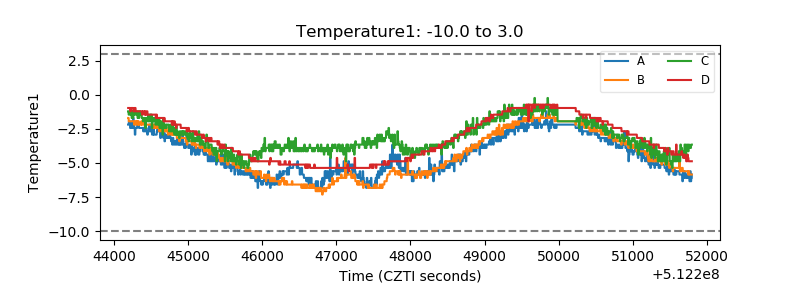 |
| Veto HV Monitor | 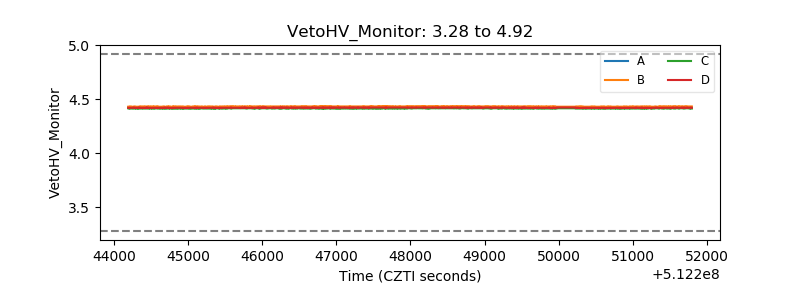 |
| Veto LLD | 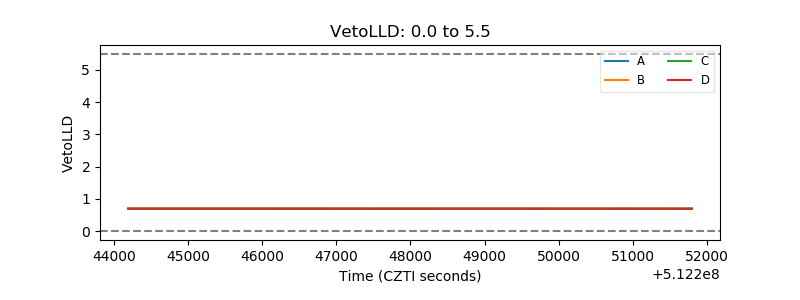 |
| Alpha Counter | 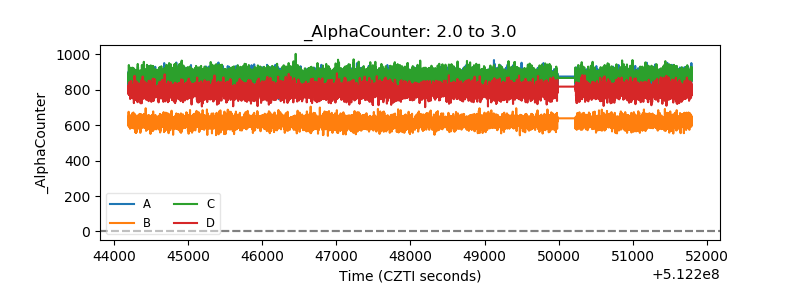 |
| _CPM_Rate | 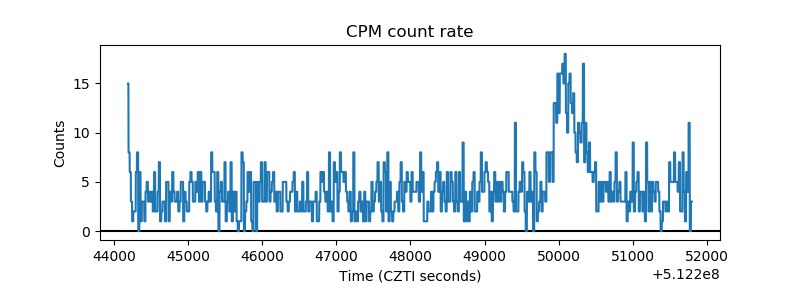 |
| CZT Counter | 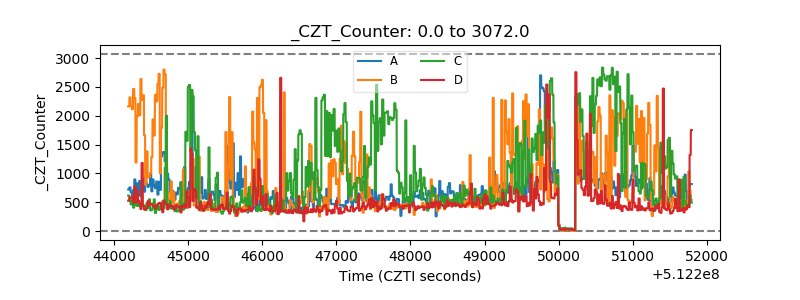 |
| +2.5 Volts monitor |  |
| +5 Volts monitor |  |
| _ROLL_ROT | 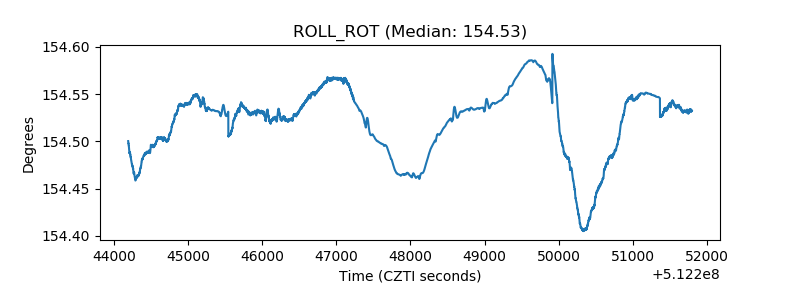 |
| _Roll_DEC | 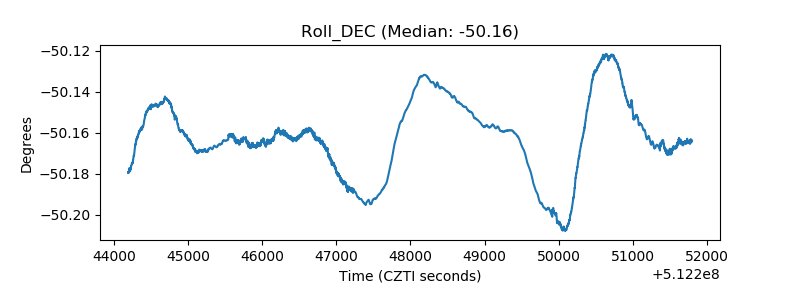 |
| _Roll_RA | 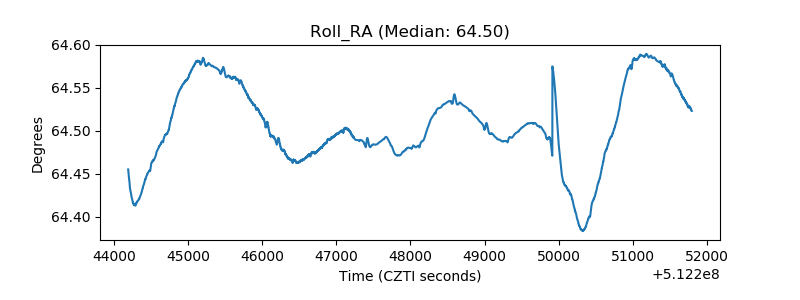 |
| Veto Counter | 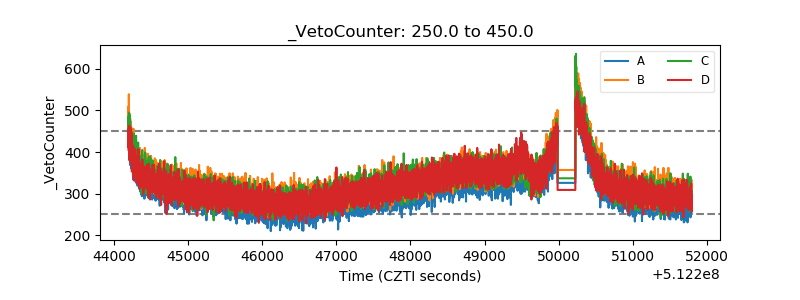 |