| Param | Original file | Final file |
|---|---|---|
| Filename | modeM0/AS1A14_083T05_9000006560_56773cztM0_level2.fits | modeM0/AS1A14_083T05_9000006560_56773cztM0_level2_quad_clean.evt |
| Size (bytes) | 749,736,000 | 106,441,920 |
| Size | 715.0 MB | 101.5 MB |
| Events in quadrant A | 5,359,869 | 739,522 |
| Events in quadrant B | 6,700,533 | 725,587 |
| Events in quadrant C | 11,204,849 | 532,963 |
| Events in quadrant D | 3,868,676 | 668,921 |
| Mode SS | |||
|---|---|---|---|
| Quadrant | BADHDUFLAG | Total packets | Discarded packets |
| A | 0 | 162 | 0 |
| B | 0 | 162 | 0 |
| C | 0 | 162 | 0 |
| D | 0 | 162 | 0 |
| Mode M0 | |||
|---|---|---|---|
| Quadrant | BADHDUFLAG | Total packets | Discarded packets |
| A | 0 | 21599 | 1 |
| B | 0 | 25617 | 1 |
| C | 0 | 38963 | 1 |
| D | 0 | 17592 | 1 |
| Mode M9 | |||
|---|---|---|---|
| Quadrant | BADHDUFLAG | Total packets | Discarded packets |
| A | 0 | 1 | 0 |
| B | 0 | 2 | 0 |
| C | 0 | 2 | 0 |
| D | 0 | 2 | 0 |
| Quadrant | Total seconds | Saturated seconds | Saturation percentage |
|---|---|---|---|
| A | 7994 | 113 | 1.413560% |
| B | 7994 | 1024 | 12.809607% |
| C | 7994 | 2117 | 26.482362% |
| D | 7994 | 71 | 0.888166% |
Noise dominated data is calculated using 1-second bins in cleaned event files. If a bin has >2000 counts, and if more than 50% of those come from <1% of pixels, then it is considered to be noise-dominated and hence unusable.
| Quadrant | # 1 sec bins | Bins with >0 counts | Bins with >2000 counts | High rate bins dominated by noise | Noise dominated (total time) | Noise dominated (detector-on time) | Marked lightcurve |
|---|---|---|---|---|---|---|---|
| A | 7994 | 7994 | 33 | 33 | 0.41% | 0.41% | 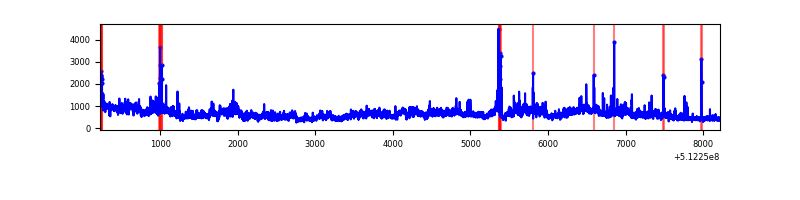 |
| B | 7994 | 7994 | 549 | 549 | 6.87% | 6.87% | 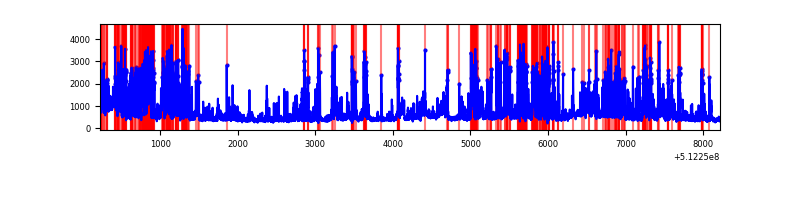 |
| C | 7994 | 7994 | 1853 | 1853 | 23.18% | 23.18% | 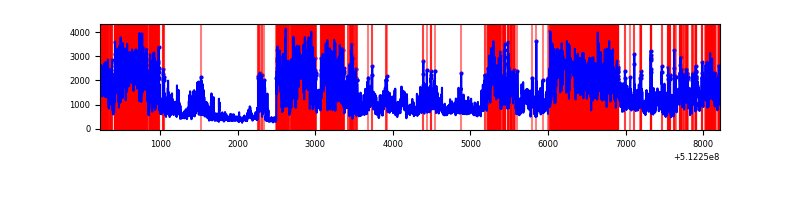 |
| D | 7994 | 7994 | 37 | 37 | 0.46% | 0.46% | 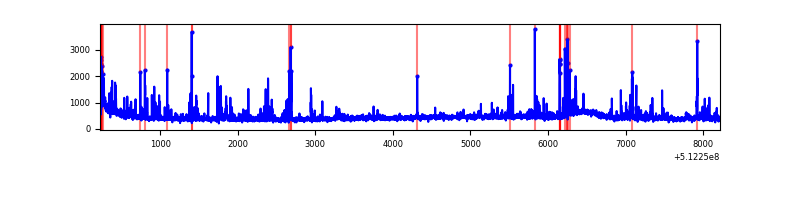 |
Top three noisy pixels from each quadrant. If the there are fewer than three noisy pixels in the level2.evt file, extra rows are filled as -1
| Pixel properties | Quadrant properties | ||||||
|---|---|---|---|---|---|---|---|
| Quadrant | DetID | PixID | Counts | Sigma | Mean | Median | Sigma |
| A | 3 | 14 | 1751890 | 8351.15 | 847 | 825 | 209.7 |
| A | 10 | 251 | 157246 | 746.0 | 847 | 825 | 209.7 |
| A | 12 | 15 | 77379 | 365.1 | 847 | 825 | 209.7 |
| B | 4 | 206 | 2881955 | 16504.62 | 803 | 772 | 174.6 |
| B | 10 | 247 | 189597 | 1081.67 | 803 | 772 | 174.6 |
| B | 7 | 252 | 116461 | 662.71 | 803 | 772 | 174.6 |
| C | 9 | 38 | 4028159 | 20228.98 | 725 | 716 | 199.1 |
| C | 15 | 230 | 3713791 | 18649.98 | 725 | 716 | 199.1 |
| C | 14 | 96 | 409224 | 2051.85 | 725 | 716 | 199.1 |
| D | 2 | 249 | 198691 | 862.07 | 817 | 778 | 229.6 |
| D | 2 | 31 | 120513 | 521.54 | 817 | 778 | 229.6 |
| D | 5 | 173 | 70269 | 302.69 | 817 | 778 | 229.6 |
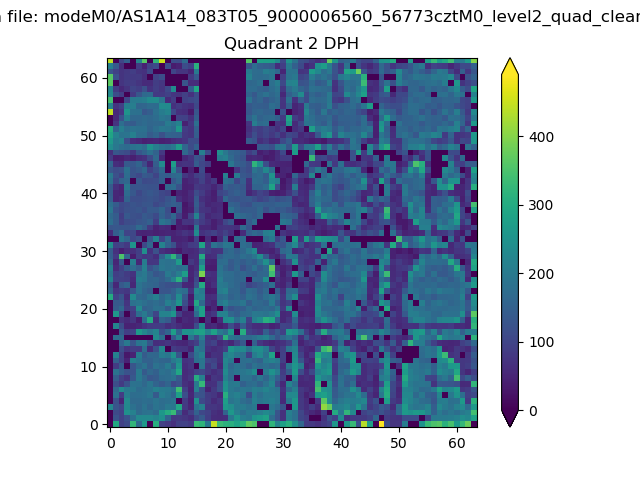
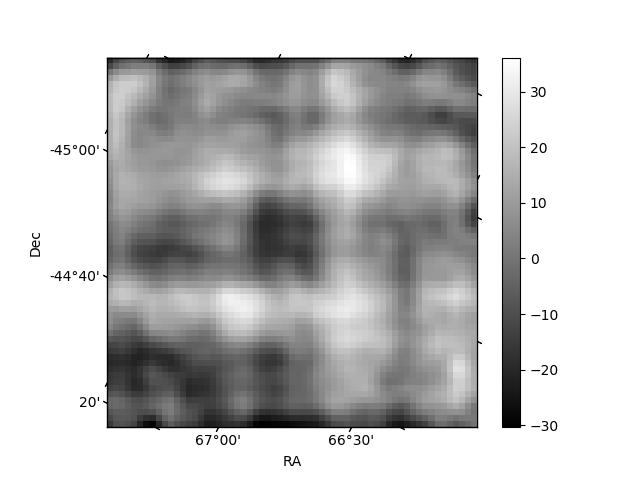
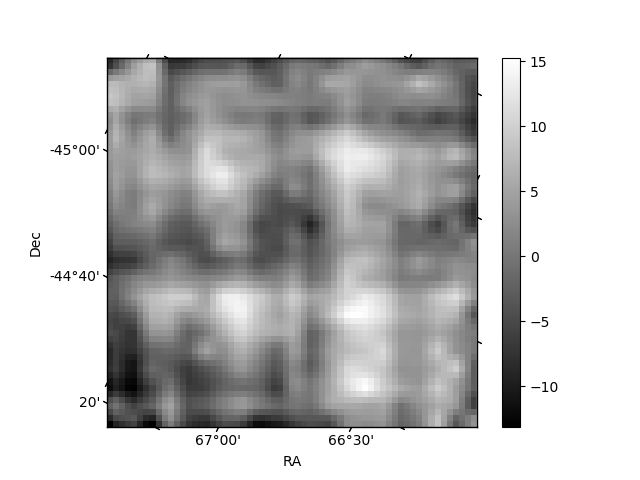
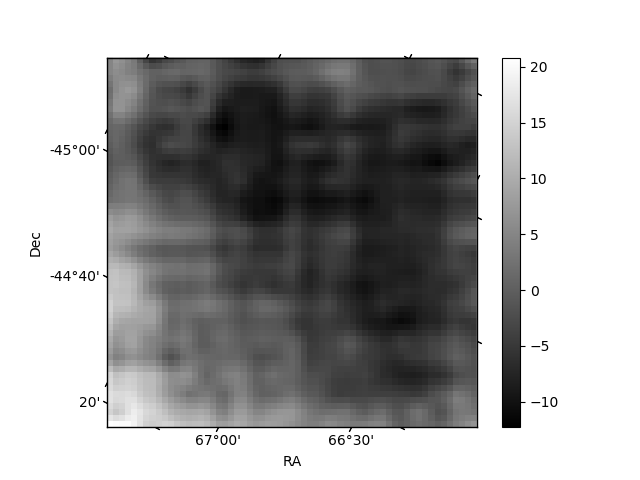
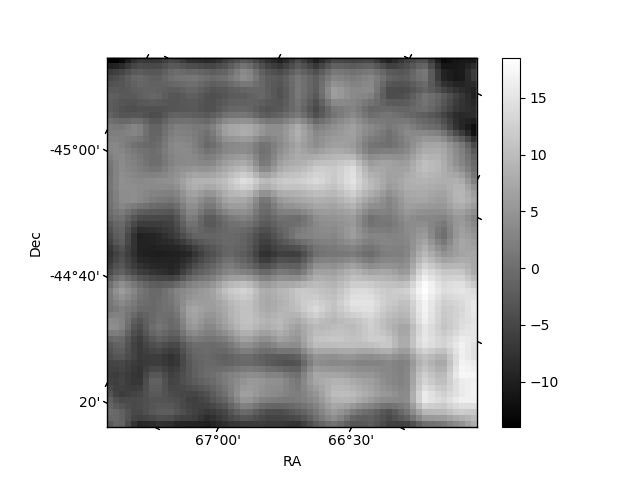
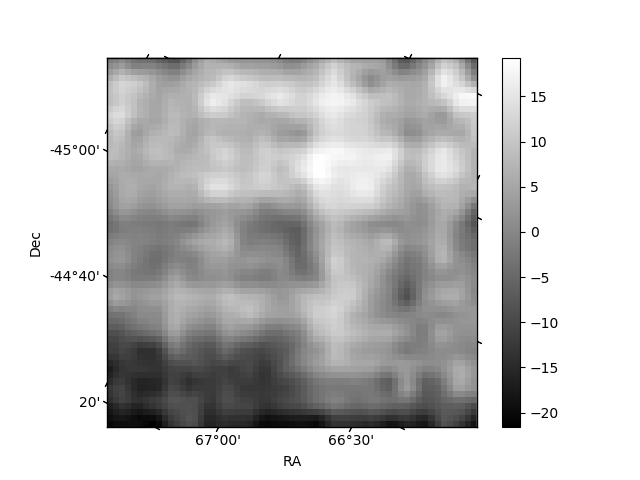
Histogram calculated using DETX and DETY for each event in the final _common_clean file
| Quadrant A | 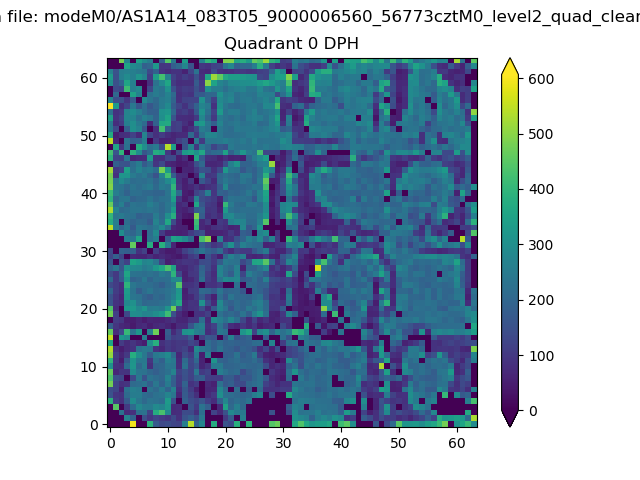 |
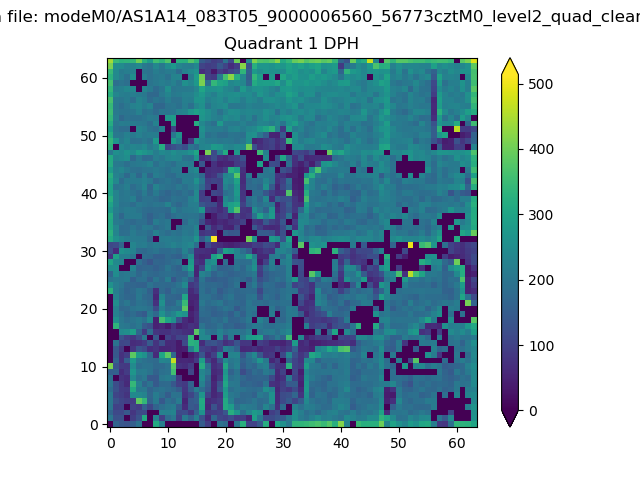 |
Quadrant B |
|---|---|---|---|
| Quadrant D | 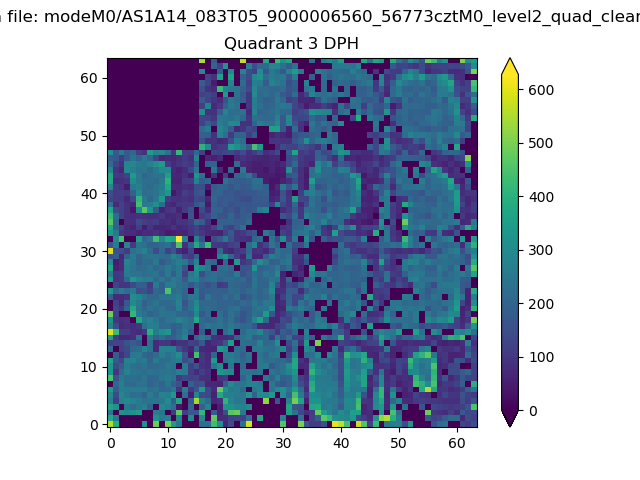 |
 |
Quadrant C |
| Plot type | Count rate plots | Images |
|---|---|---|
| Comparison with Poisson distribution Blue bars denote a histogram of data divided into 1 sec bins. Red curve is a Poisson curve with rate = median count rate of data. |
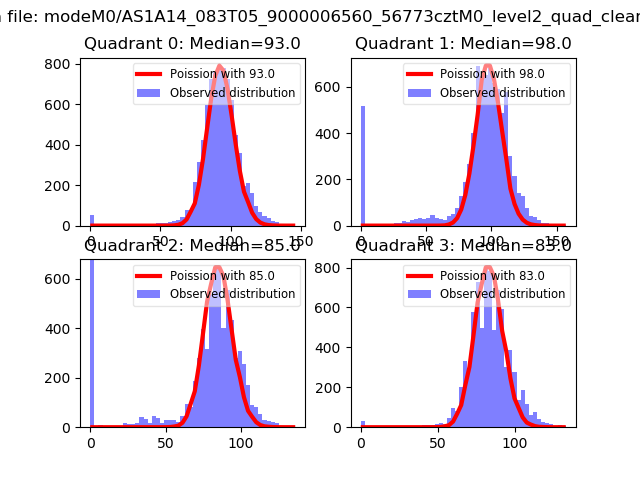 |
 |
| Quadrant-wise count rates Data is divided into 100 sec bins |
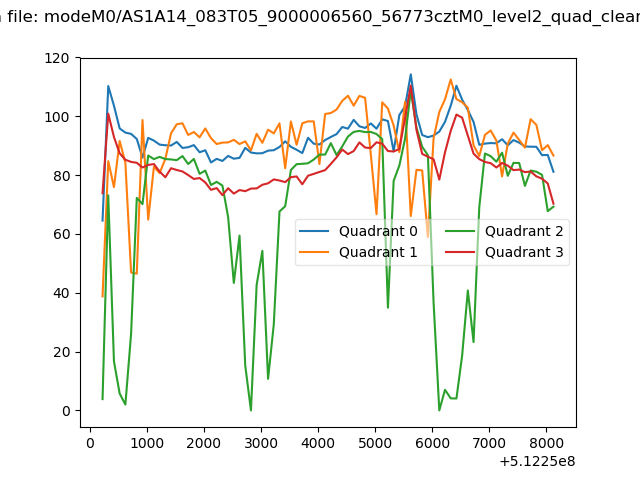 |
|
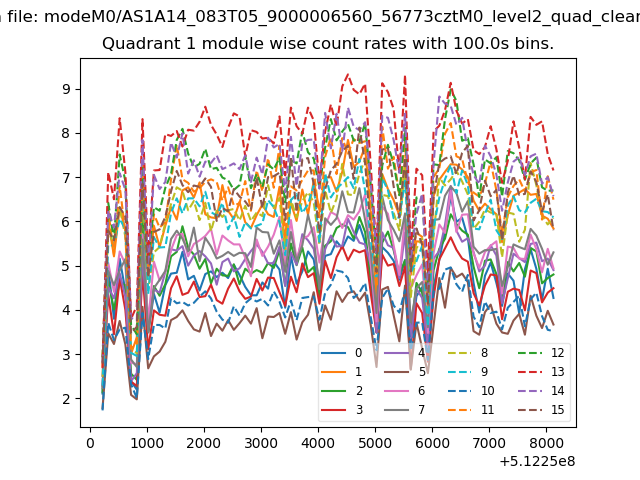
| Module-wise count rates for Quadrant A Data is divided into 100 sec bins |
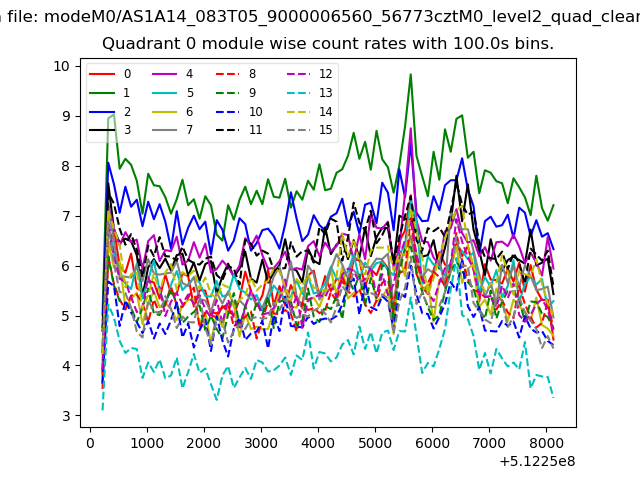 |
 |
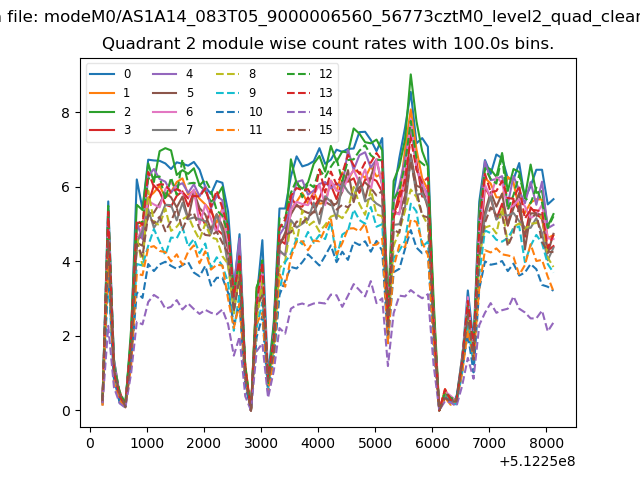
| Module-wise count rates for Quadrant B Data is divided into 100 sec bins |
 |
 |
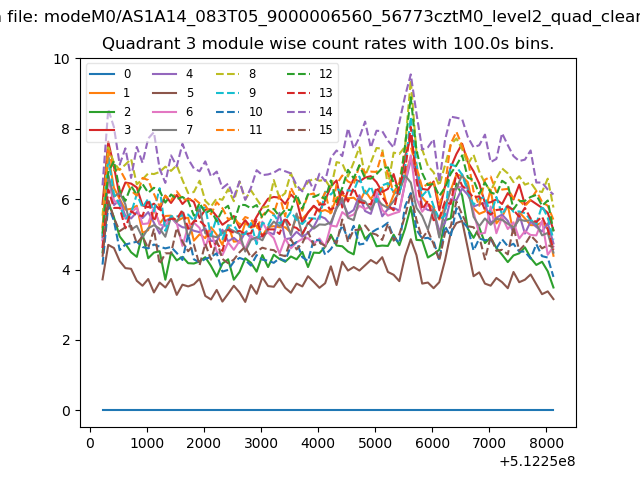
| Module-wise count rates for Quadrant C Data is divided into 100 sec bins |
 |
 |
| Module-wise count rates for Quadrant D Data is divided into 100 sec bins |
 |
 |
| Parameter | Plot |
|---|---|
| CZT HV Monitor | 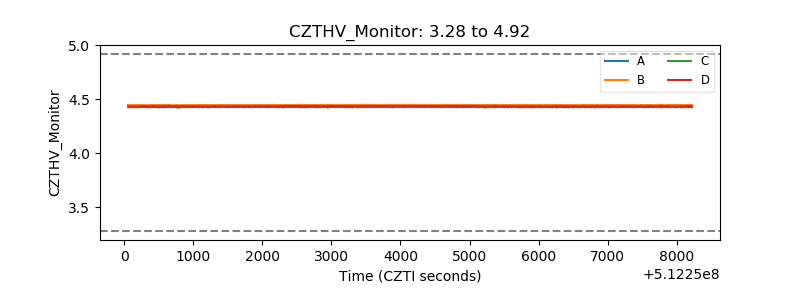 |
| D_VDD | 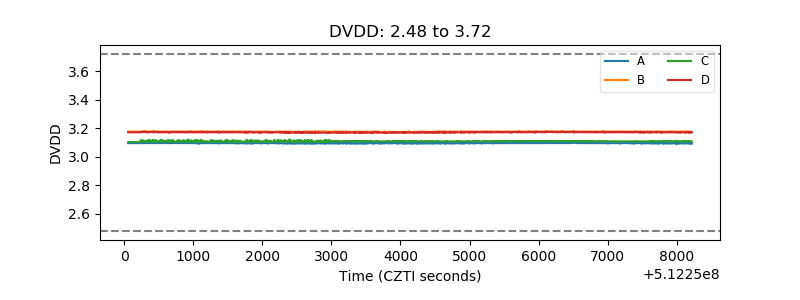 |
| Temperature 1 | 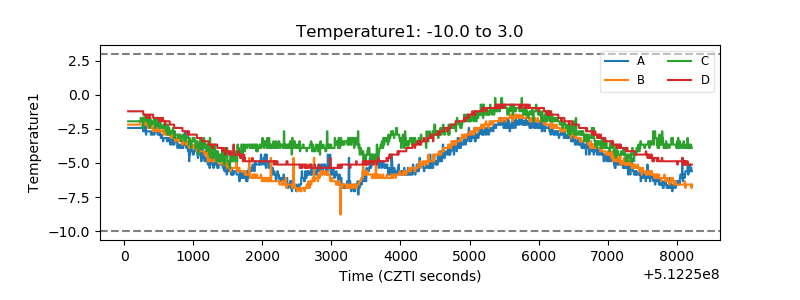 |
| Veto HV Monitor | 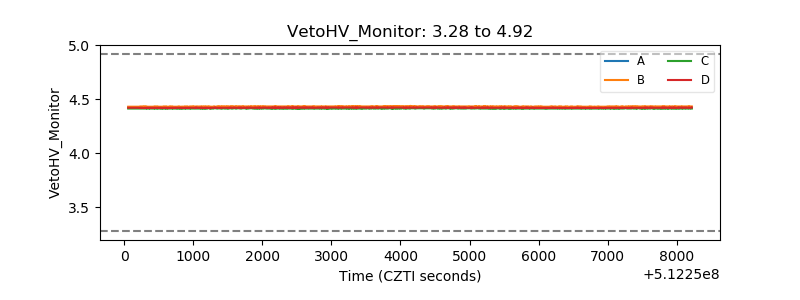 |
| Veto LLD | 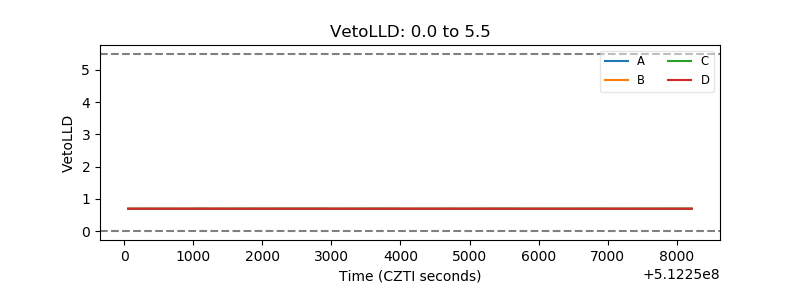 |
| Alpha Counter | 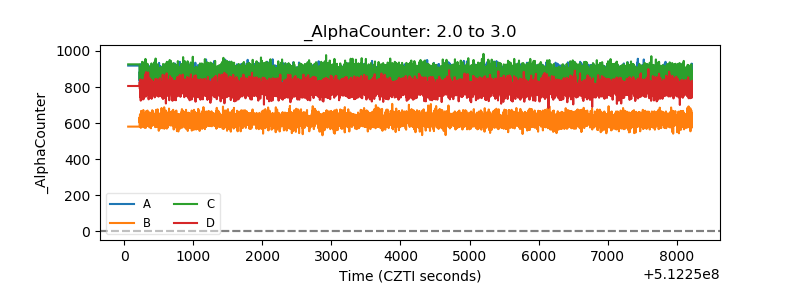 |
| _CPM_Rate | 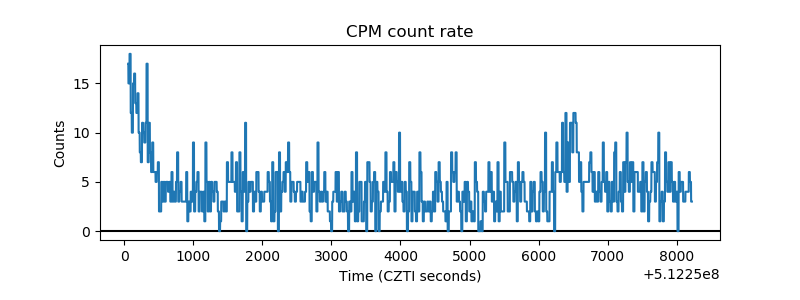 |
| CZT Counter | 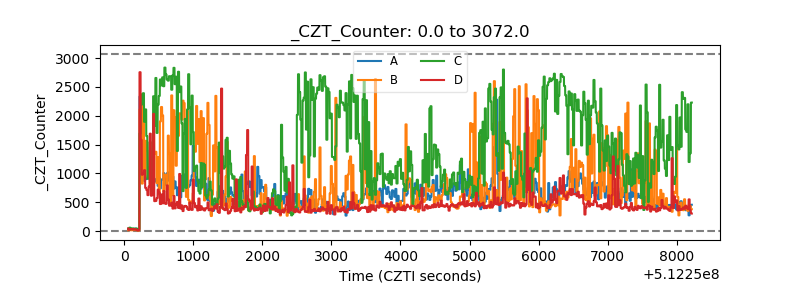 |
| +2.5 Volts monitor |  |
| +5 Volts monitor |  |
| _ROLL_ROT | 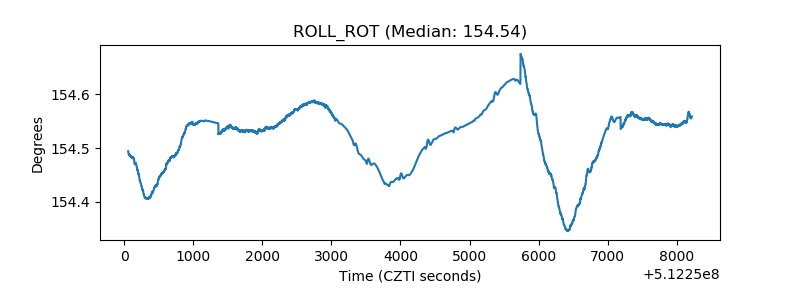 |
| _Roll_DEC | 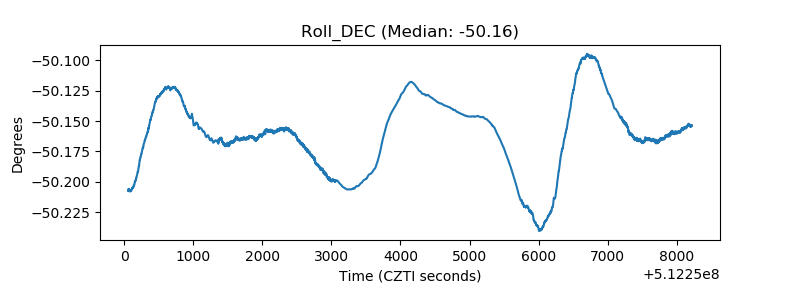 |
| _Roll_RA | 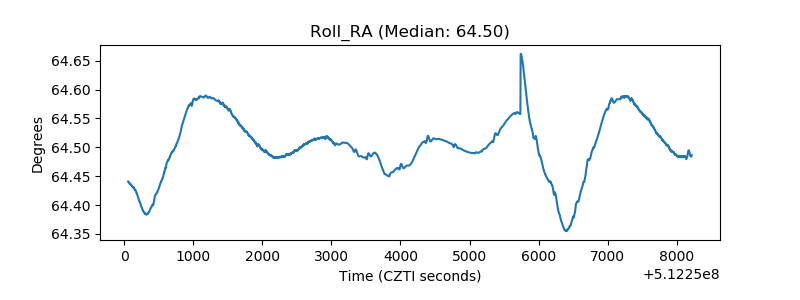 |
| Veto Counter | 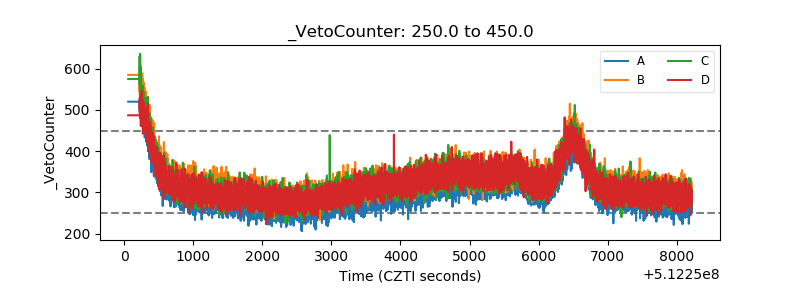 |