| Param | Original file | Final file |
|---|---|---|
| Filename | modeM0/AS1A14_083T05_9000006560_56774cztM0_level2.fits | modeM0/AS1A14_083T05_9000006560_56774cztM0_level2_quad_clean.evt |
| Size (bytes) | 762,287,040 | 110,197,440 |
| Size | 727.0 MB | 105.1 MB |
| Events in quadrant A | 5,039,911 | 754,633 |
| Events in quadrant B | 6,666,739 | 749,970 |
| Events in quadrant C | 12,036,103 | 589,402 |
| Events in quadrant D | 3,846,683 | 677,549 |
| Mode SS | |||
|---|---|---|---|
| Quadrant | BADHDUFLAG | Total packets | Discarded packets |
| A | 0 | 164 | 0 |
| B | 0 | 164 | 0 |
| C | 0 | 164 | 0 |
| D | 0 | 164 | 0 |
| Mode M0 | |||
|---|---|---|---|
| Quadrant | BADHDUFLAG | Total packets | Discarded packets |
| A | 0 | 20481 | 0 |
| B | 0 | 25604 | 0 |
| C | 0 | 41468 | 0 |
| D | 0 | 17660 | 0 |
| Quadrant | Total seconds | Saturated seconds | Saturation percentage |
|---|---|---|---|
| A | 8119 | 77 | 0.948393% |
| B | 8119 | 927 | 11.417662% |
| C | 8119 | 1811 | 22.305703% |
| D | 8118 | 41 | 0.505051% |
Noise dominated data is calculated using 1-second bins in cleaned event files. If a bin has >2000 counts, and if more than 50% of those come from <1% of pixels, then it is considered to be noise-dominated and hence unusable.
| Quadrant | # 1 sec bins | Bins with >0 counts | Bins with >2000 counts | High rate bins dominated by noise | Noise dominated (total time) | Noise dominated (detector-on time) | Marked lightcurve |
|---|---|---|---|---|---|---|---|
| A | 8119 | 8119 | 19 | 19 | 0.23% | 0.23% | 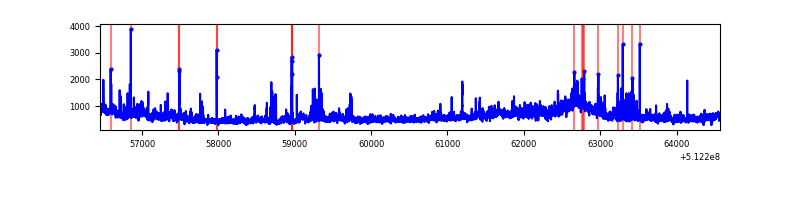 |
| B | 8119 | 8119 | 514 | 514 | 6.33% | 6.33% | 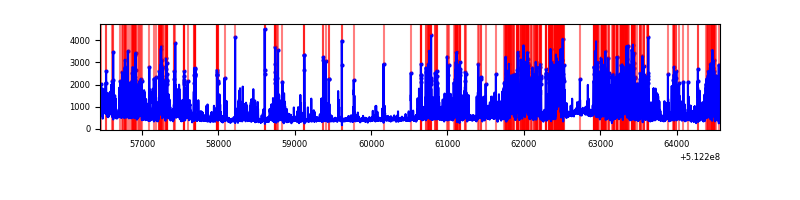 |
| C | 8119 | 8119 | 1678 | 1678 | 20.67% | 20.67% | 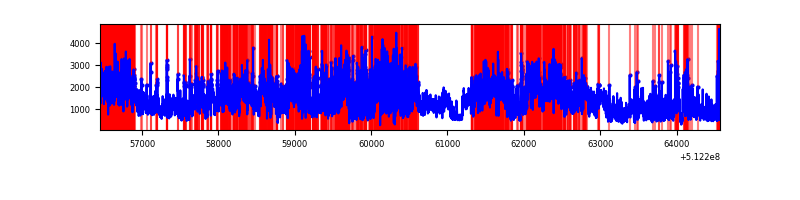 |
| D | 8118 | 8118 | 40 | 40 | 0.49% | 0.49% | 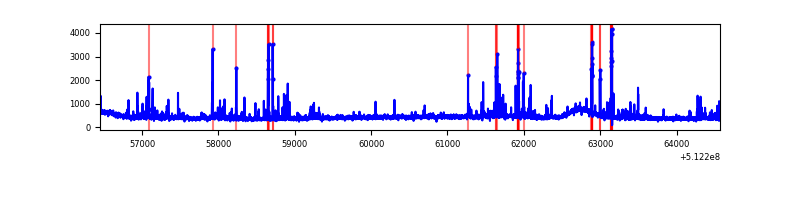 |
Top three noisy pixels from each quadrant. If the there are fewer than three noisy pixels in the level2.evt file, extra rows are filled as -1
| Pixel properties | Quadrant properties | ||||||
|---|---|---|---|---|---|---|---|
| Quadrant | DetID | PixID | Counts | Sigma | Mean | Median | Sigma |
| A | 3 | 14 | 1254971 | 5816.56 | 864 | 840 | 215.6 |
| A | 12 | 15 | 148405 | 684.4 | 864 | 840 | 215.6 |
| A | 3 | 62 | 90507 | 415.87 | 864 | 840 | 215.6 |
| B | 4 | 206 | 2625497 | 14517.4 | 832 | 798 | 180.8 |
| B | 10 | 247 | 284142 | 1567.2 | 832 | 798 | 180.8 |
| B | 5 | 185 | 113538 | 623.57 | 832 | 798 | 180.8 |
| C | 9 | 38 | 7643027 | 35978.47 | 783 | 774 | 212.4 |
| C | 15 | 230 | 647901 | 3046.57 | 783 | 774 | 212.4 |
| C | 14 | 96 | 338135 | 1588.24 | 783 | 774 | 212.4 |
| D | 2 | 249 | 280376 | 1197.24 | 831 | 792 | 233.5 |
| D | 5 | 173 | 78493 | 332.73 | 831 | 792 | 233.5 |
| D | 2 | 31 | 71773 | 303.95 | 831 | 792 | 233.5 |
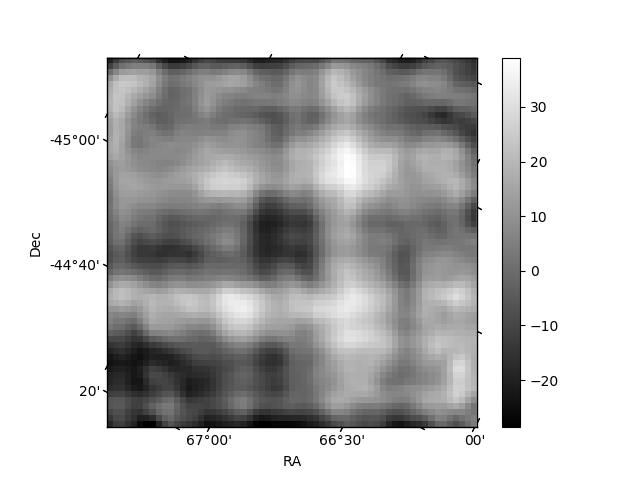
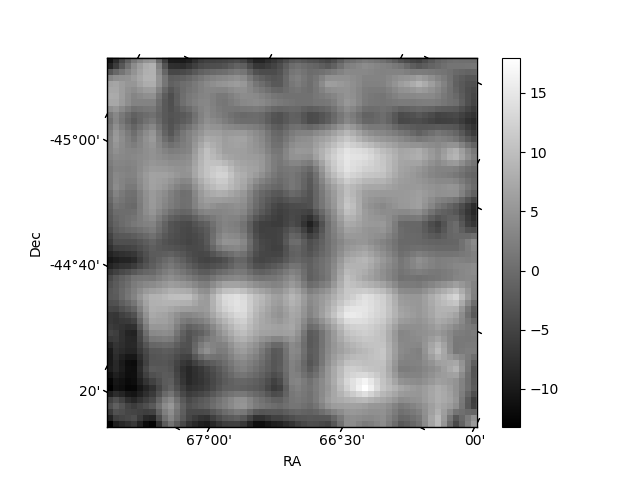
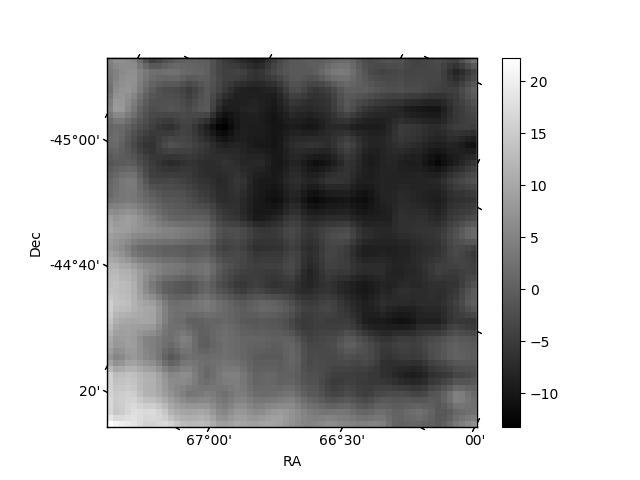
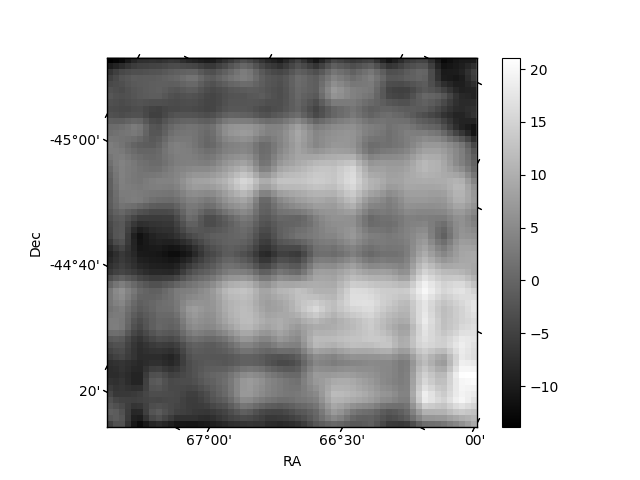
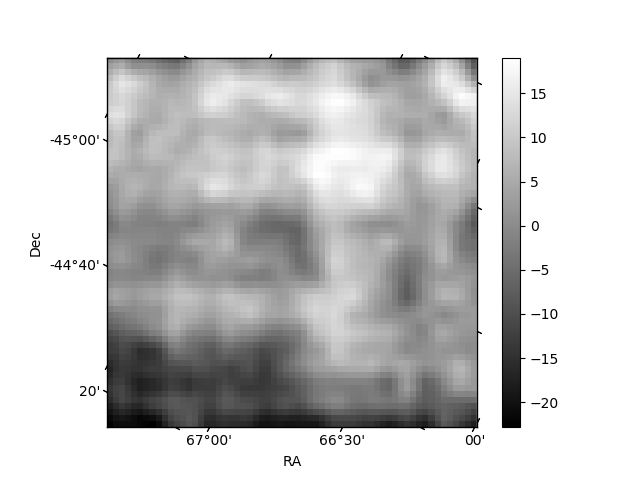
Histogram calculated using DETX and DETY for each event in the final _common_clean file
| Quadrant A | 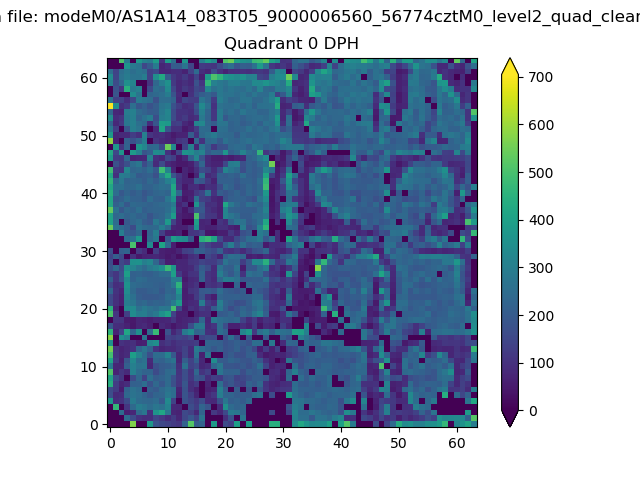 |
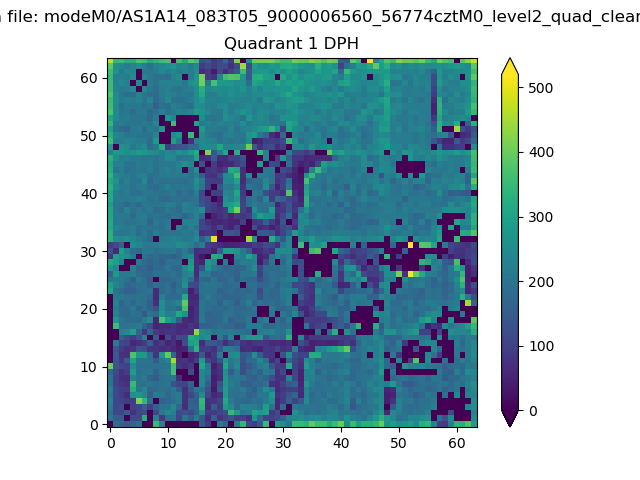 |
Quadrant B |
|---|---|---|---|
| Quadrant D | 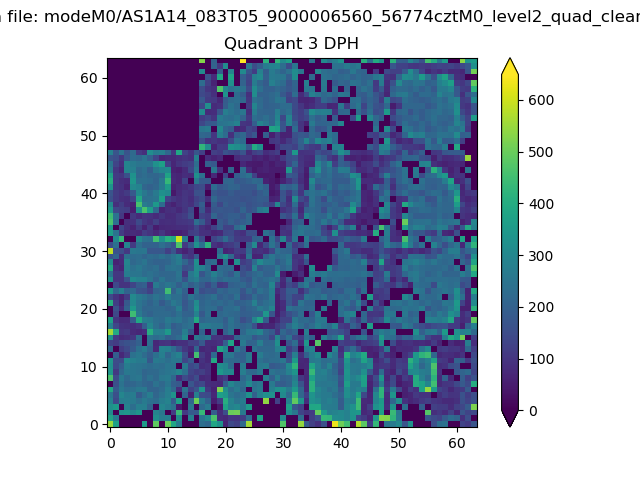 |
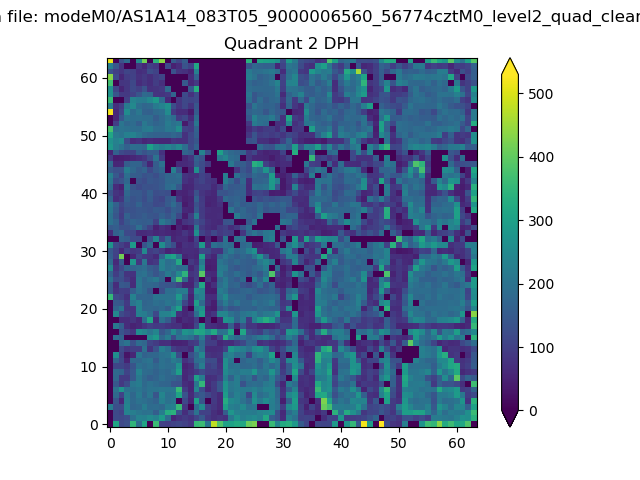 |
Quadrant C |
| Plot type | Count rate plots | Images |
|---|---|---|
| Comparison with Poisson distribution Blue bars denote a histogram of data divided into 1 sec bins. Red curve is a Poisson curve with rate = median count rate of data. |
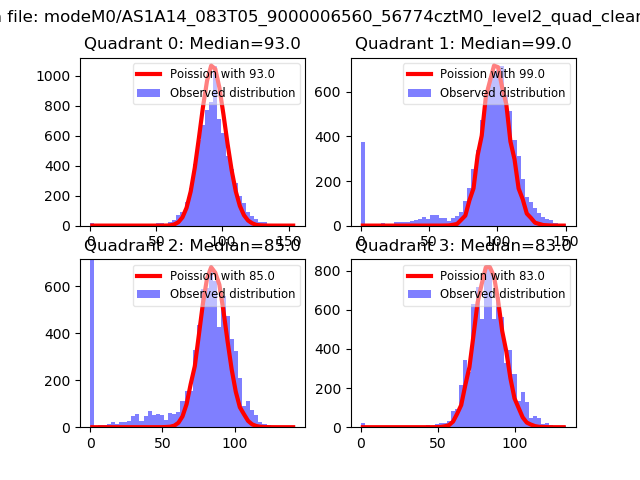 |
 |
| Quadrant-wise count rates Data is divided into 100 sec bins |
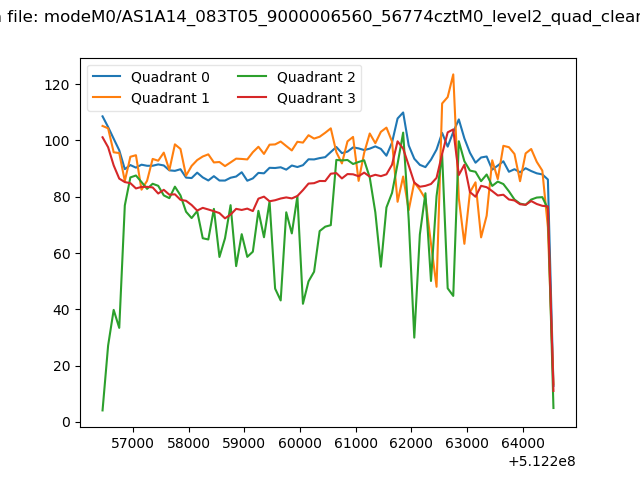 |
|
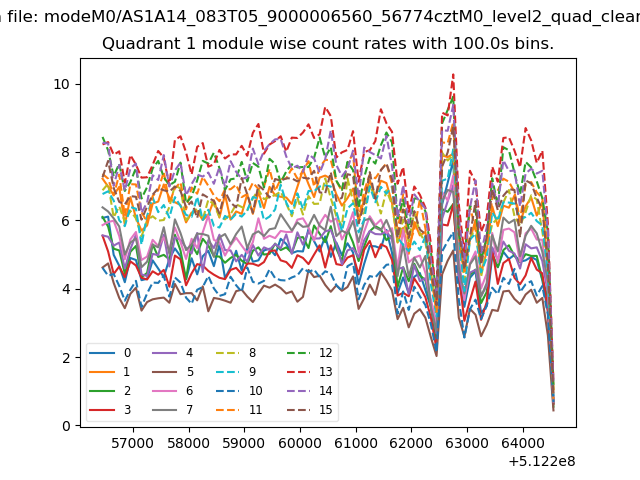
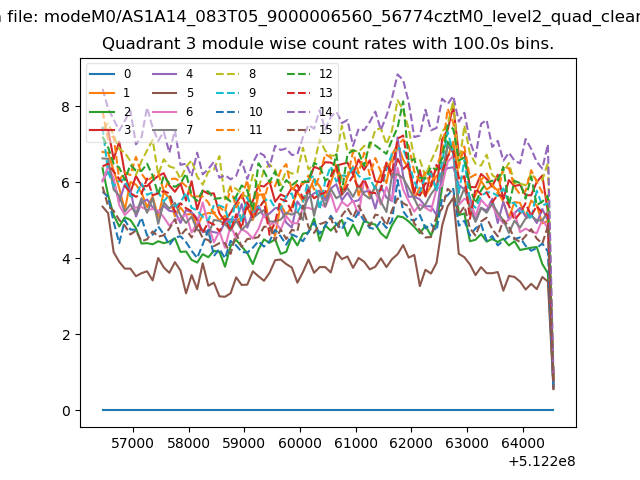
| Module-wise count rates for Quadrant A Data is divided into 100 sec bins |
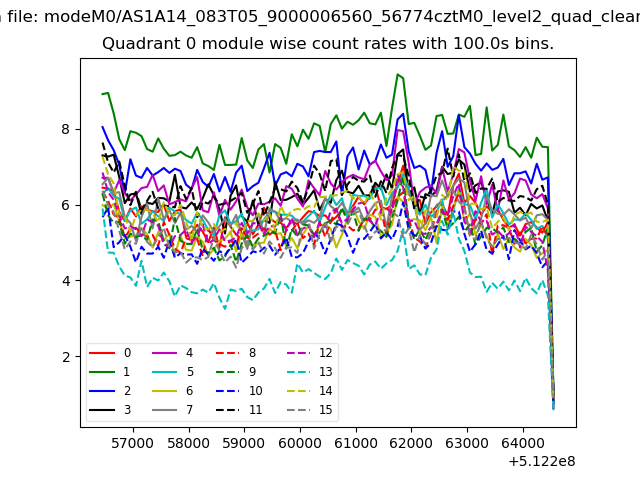 |
 |
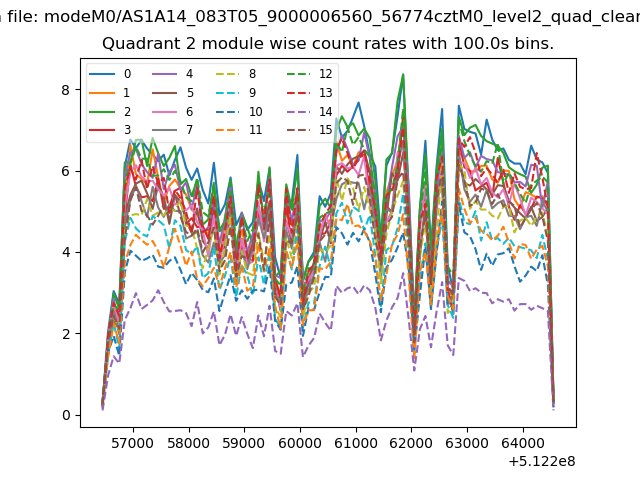
| Module-wise count rates for Quadrant B Data is divided into 100 sec bins |
 |
 |
| Module-wise count rates for Quadrant C Data is divided into 100 sec bins |
 |
 |
| Module-wise count rates for Quadrant D Data is divided into 100 sec bins |
 |
 |
| Parameter | Plot |
|---|---|
| CZT HV Monitor | 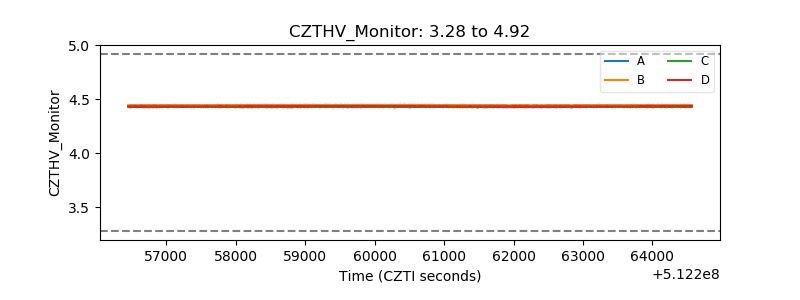 |
| D_VDD | 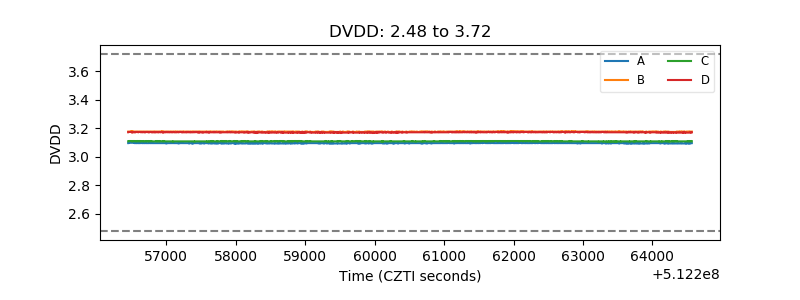 |
| Temperature 1 | 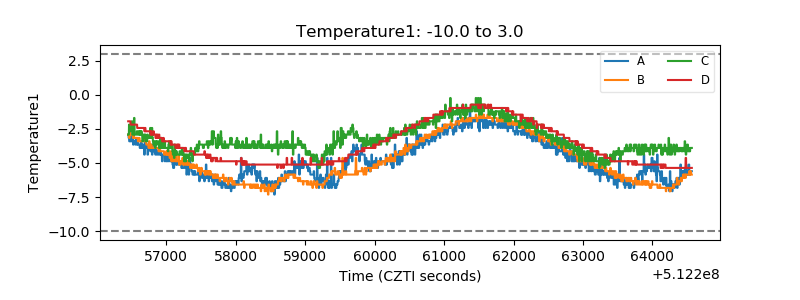 |
| Veto HV Monitor | 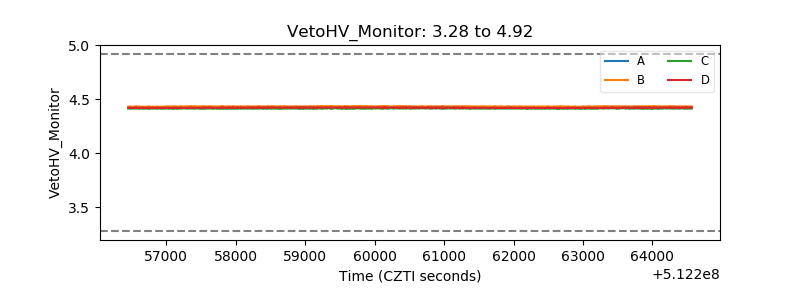 |
| Veto LLD | 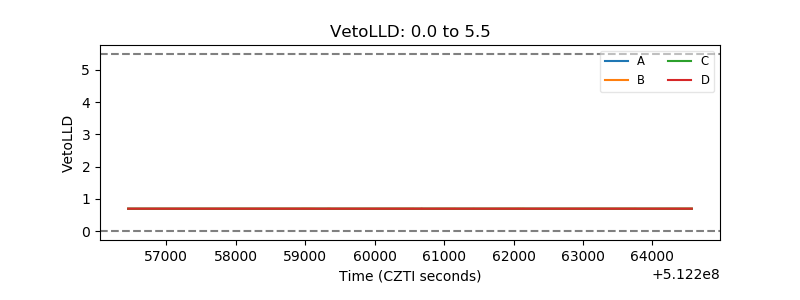 |
| Alpha Counter | 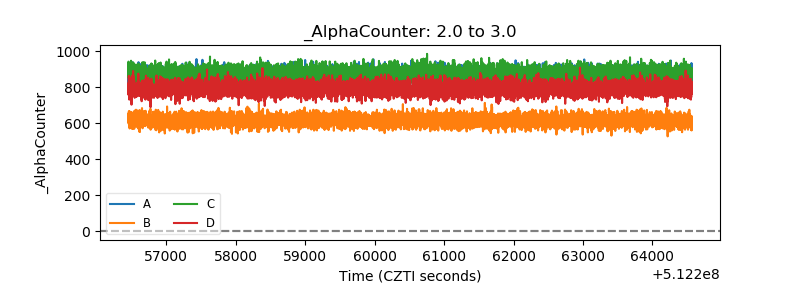 |
| _CPM_Rate | 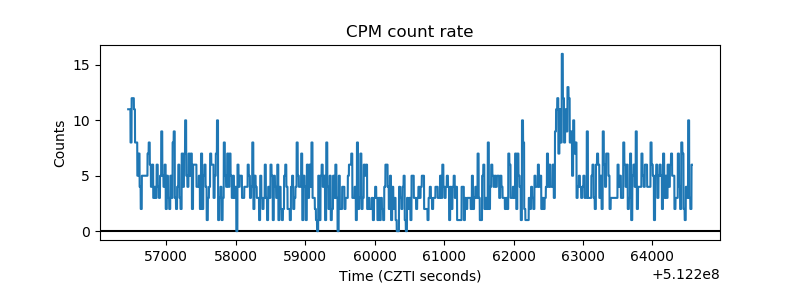 |
| CZT Counter | 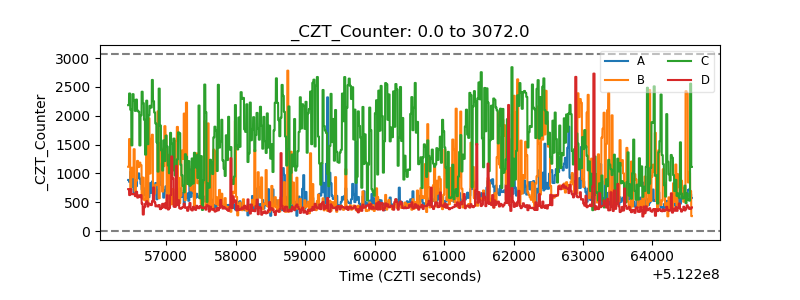 |
| +2.5 Volts monitor |  |
| +5 Volts monitor |  |
| _ROLL_ROT | 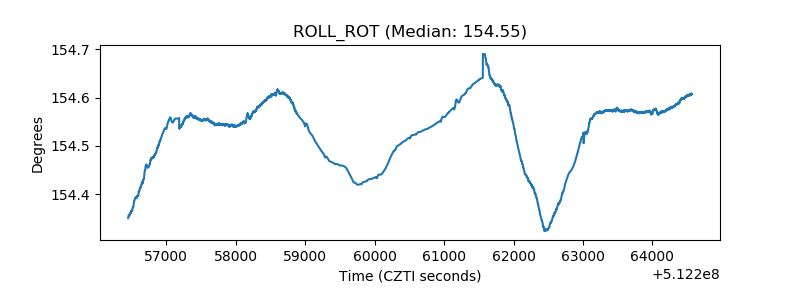 |
| _Roll_DEC | 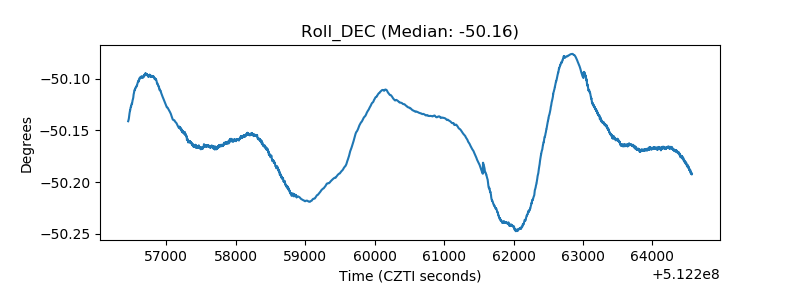 |
| _Roll_RA | 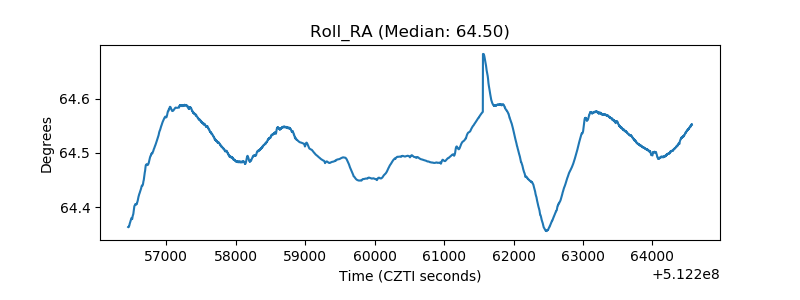 |
| Veto Counter | 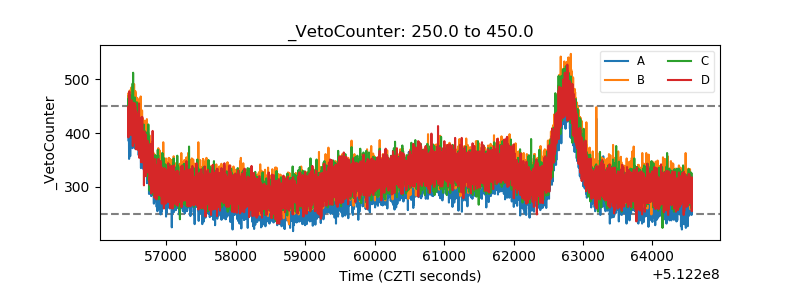 |