| Param | Original file | Final file |
|---|---|---|
| Filename | modeM0/AS1A14_083T03_9000006562cztM0_level2.fits | modeM0/AS1A14_083T03_9000006562cztM0_level2_quad_clean.evt |
| Size (bytes) | 4,348,471,680 | 2,091,674,880 |
| Size | 4.0 GB | 1.9 GB |
| Events in quadrant A | 26,023,668 | 7,394,415 |
| Events in quadrant B | 23,281,180 | 7,007,791 |
| Events in quadrant C | 24,592,296 | 6,711,193 |
| Events in quadrant D | 21,967,662 | 6,435,473 |
| Mode M9 | |||
|---|---|---|---|
| Quadrant | BADHDUFLAG | Total packets | Discarded packets |
| A | 0 | 616 | 0 |
| B | 0 | 616 | 0 |
| C | 0 | 616 | 0 |
| D | 0 | 616 | 0 |
| Mode SS | |||
|---|---|---|---|
| Quadrant | BADHDUFLAG | Total packets | Discarded packets |
| A | 0 | 10516 | 0 |
| B | 0 | 10516 | 0 |
| C | 0 | 10514 | 0 |
| D | 0 | 10516 | 0 |
| Mode M0 | |||
|---|---|---|---|
| Quadrant | BADHDUFLAG | Total packets | Discarded packets |
| A | 0 | 1424553 | 0 |
| B | 0 | 1540564 | 0 |
| C | 0 | 1409457 | 0 |
| D | 0 | 1378521 | 0 |
| Quadrant | Total seconds | Saturated seconds | Saturation percentage |
|---|---|---|---|
| A | 522607 | 22257 | 4.258841% |
| B | 522610 | 55447 | 10.609632% |
| C | 522603 | 36725 | 7.027323% |
| D | 522610 | 26735 | 5.115669% |
Noise dominated data is calculated using 1-second bins in cleaned event files. If a bin has >2000 counts, and if more than 50% of those come from <1% of pixels, then it is considered to be noise-dominated and hence unusable.
| Quadrant | # 1 sec bins | Bins with >0 counts | Bins with >2000 counts | High rate bins dominated by noise | Noise dominated (total time) | Noise dominated (detector-on time) | Marked lightcurve |
|---|---|---|---|---|---|---|---|
| A | 603667 | 522303 | 0 | 0 | 0.00% | 0.00% | 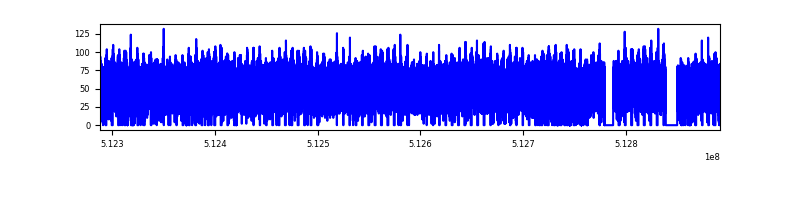 |
| B | 603667 | 520533 | 0 | 0 | 0.00% | 0.00% | 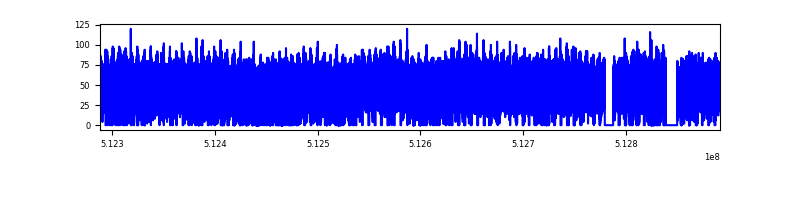 |
| C | 603667 | 521398 | 0 | 0 | 0.00% | 0.00% | 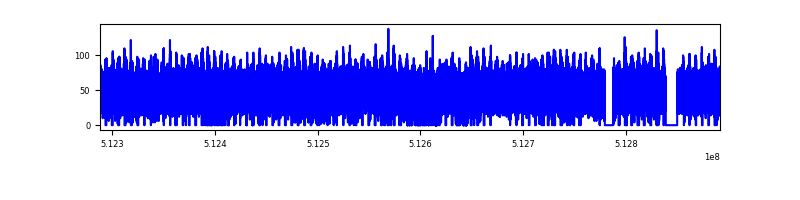 |
| D | 603668 | 522156 | 0 | 0 | 0.00% | 0.00% | 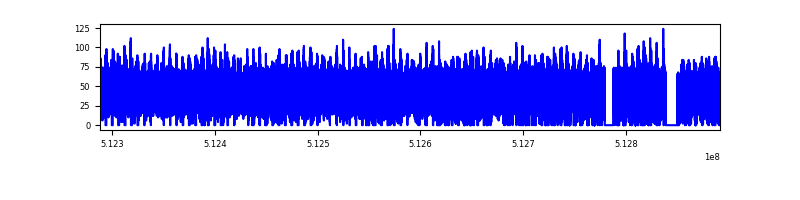 |
Top three noisy pixels from each quadrant. If the there are fewer than three noisy pixels in the level2.evt file, extra rows are filled as -1
| Pixel properties | Quadrant properties | ||||||
|---|---|---|---|---|---|---|---|
| Quadrant | DetID | PixID | Counts | Sigma | Mean | Median | Sigma |
| A | 14 | 188 | 29458 | 10.09 | 6825 | 6285 | 2296.7 |
| A | 9 | 255 | 26097 | 8.63 | 6825 | 6285 | 2296.7 |
| A | 14 | 204 | 24354 | 7.87 | 6825 | 6285 | 2296.7 |
| B | 3 | 25 | 19671 | 9.7 | 6168 | 5836 | 1426.4 |
| B | 9 | 173 | 18519 | 8.89 | 6168 | 5836 | 1426.4 |
| B | 3 | 17 | 18305 | 8.74 | 6168 | 5836 | 1426.4 |
| C | 15 | 175 | 20900 | 6.61 | 6571 | 5955 | 2259.5 |
| C | 2 | 31 | 19859 | 6.15 | 6571 | 5955 | 2259.5 |
| C | 15 | 127 | 19591 | 6.04 | 6571 | 5955 | 2259.5 |
| D | 6 | 218 | 27240 | 10.29 | 6261 | 5560 | 2107.7 |
| D | 15 | 11 | 21365 | 7.5 | 6261 | 5560 | 2107.7 |
| D | 8 | 12 | 20162 | 6.93 | 6261 | 5560 | 2107.7 |
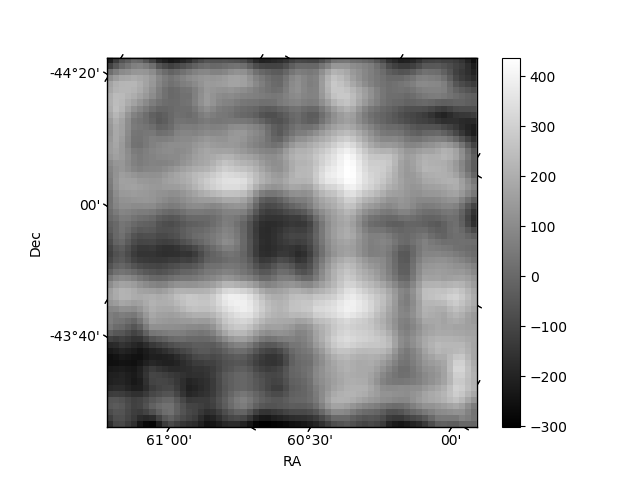
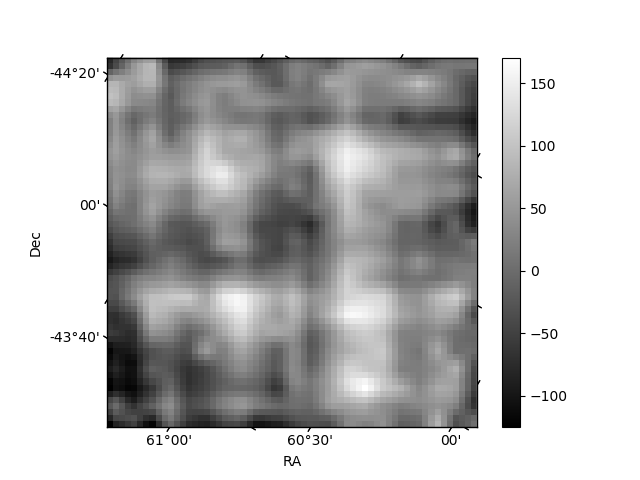
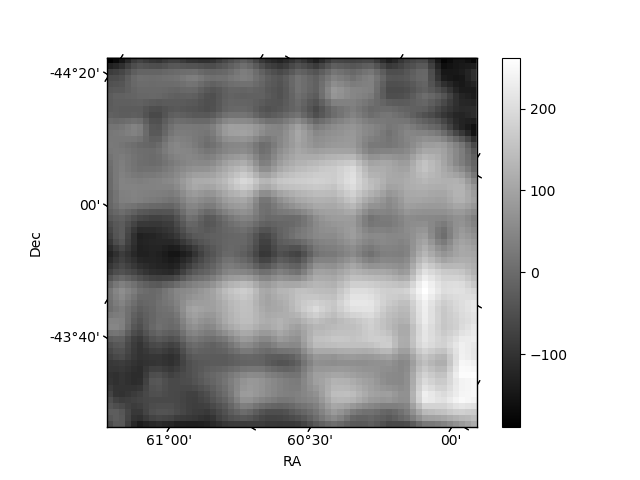
Histogram calculated using DETX and DETY for each event in the final _common_clean file
| Quadrant A | 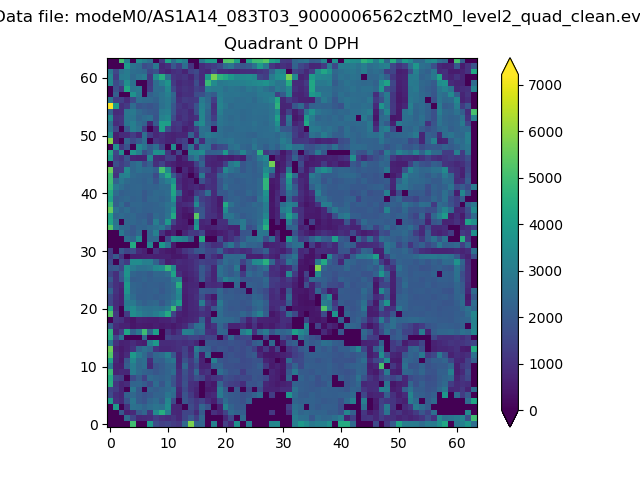 |
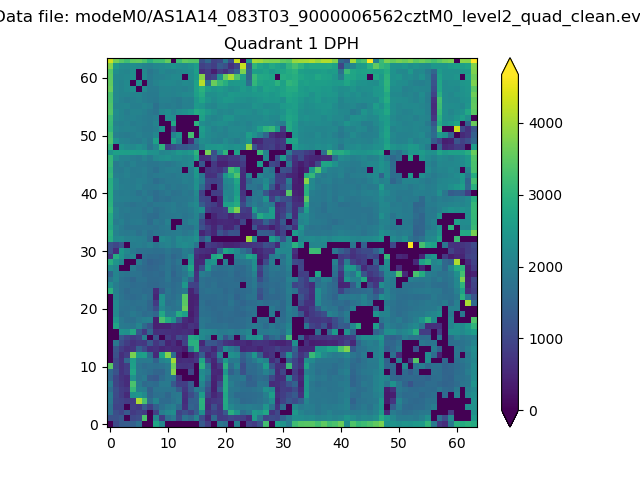 |
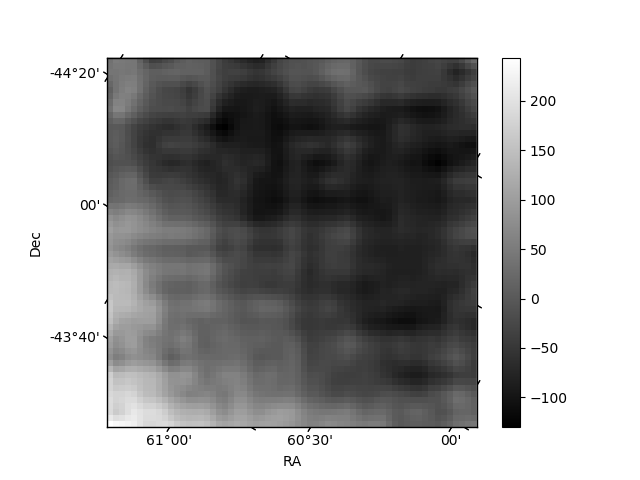
Quadrant B |
|---|---|---|---|
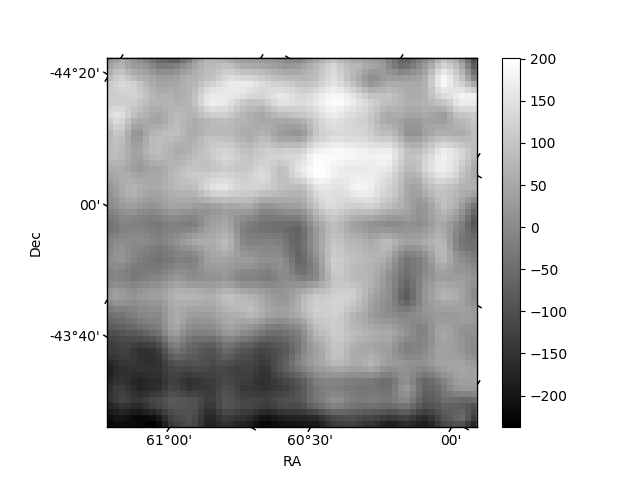
| Quadrant D | 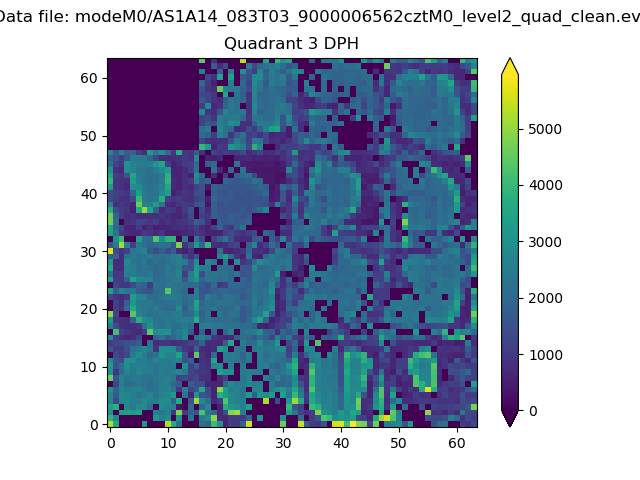 |
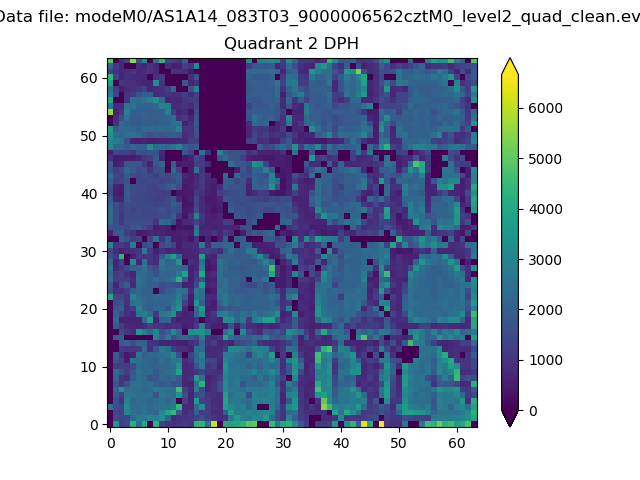 |
Quadrant C |
| Plot type | Count rate plots | Images |
|---|---|---|
| Comparison with Poisson distribution Blue bars denote a histogram of data divided into 1 sec bins. Red curve is a Poisson curve with rate = median count rate of data. |
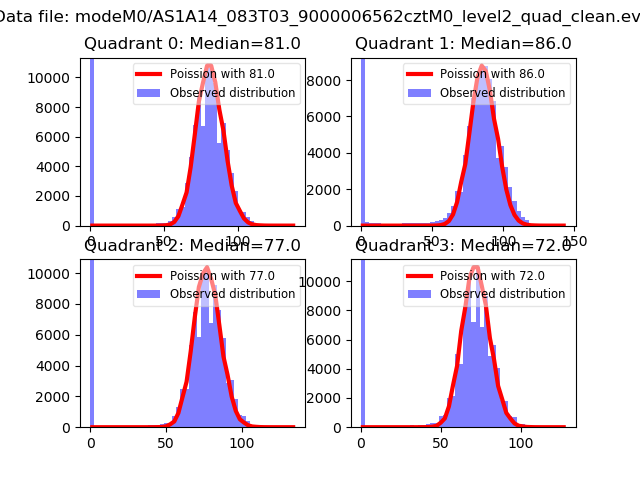 |
 |
| Quadrant-wise count rates Data is divided into 100 sec bins |
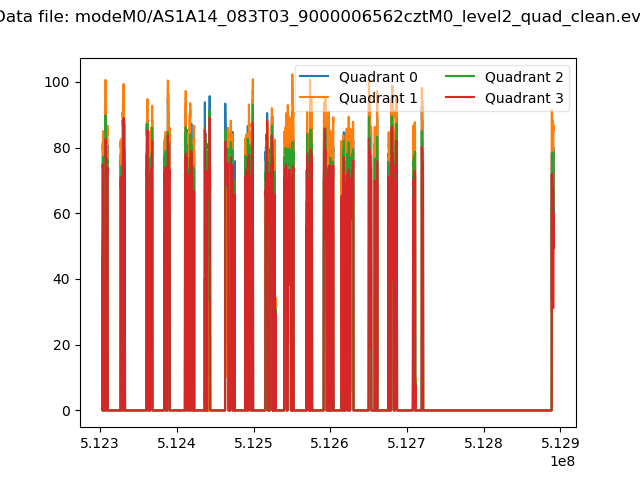 |
|
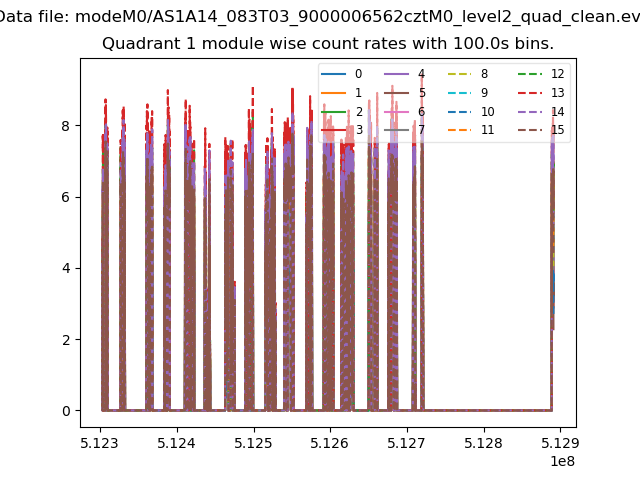
| Module-wise count rates for Quadrant A Data is divided into 100 sec bins |
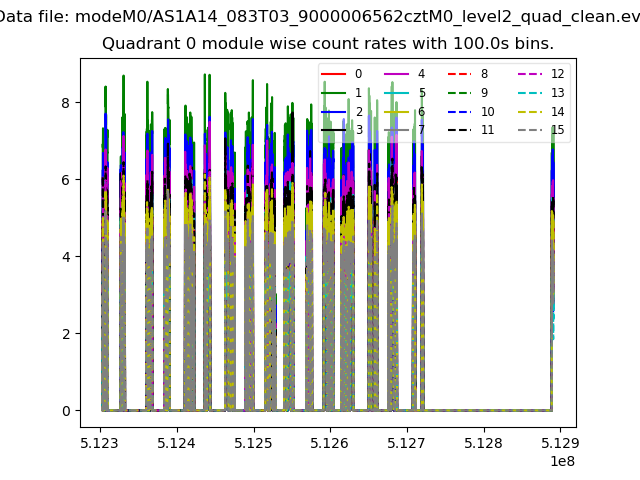 |
 |
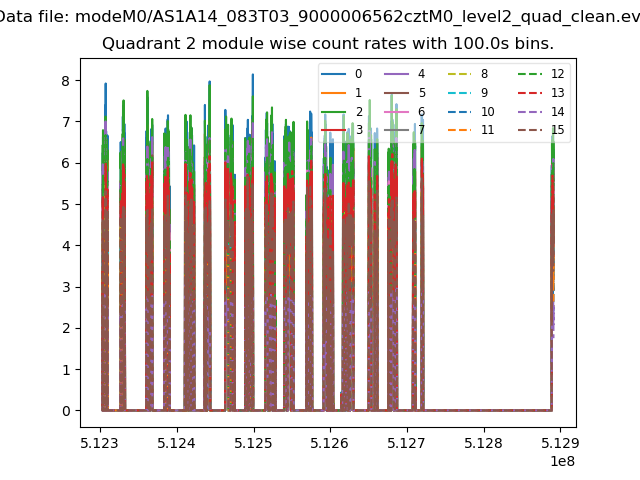
| Module-wise count rates for Quadrant B Data is divided into 100 sec bins |
 |
 |
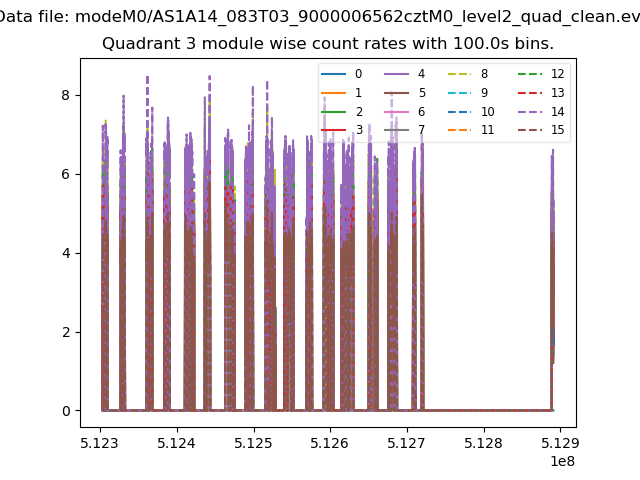
| Module-wise count rates for Quadrant C Data is divided into 100 sec bins |
 |
 |
| Module-wise count rates for Quadrant D Data is divided into 100 sec bins |
 |
 |
| Parameter | Plot |
|---|---|
| CZT HV Monitor | 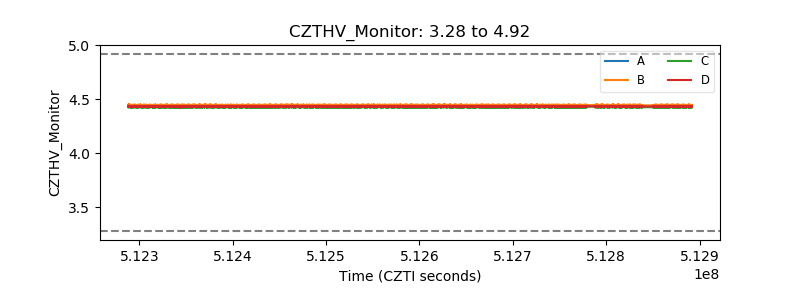 |
| D_VDD | 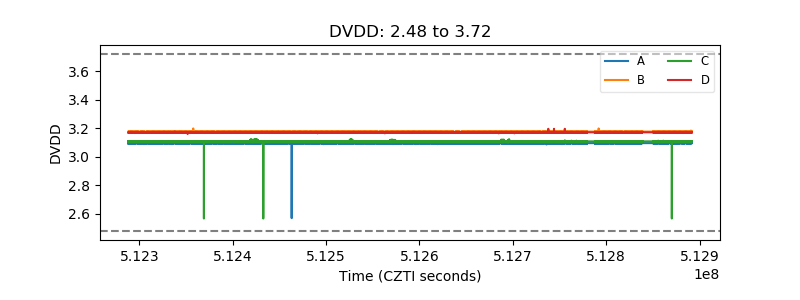 |
| Temperature 1 | 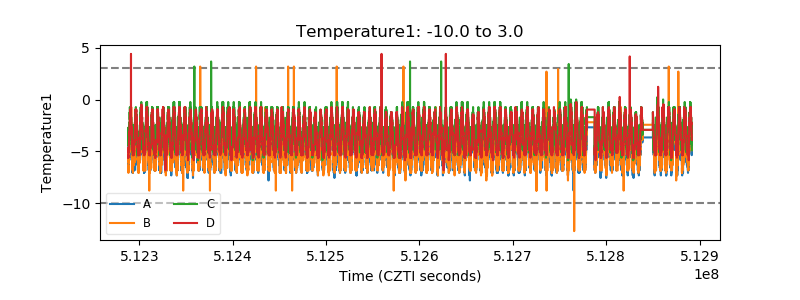 |
| Veto HV Monitor | 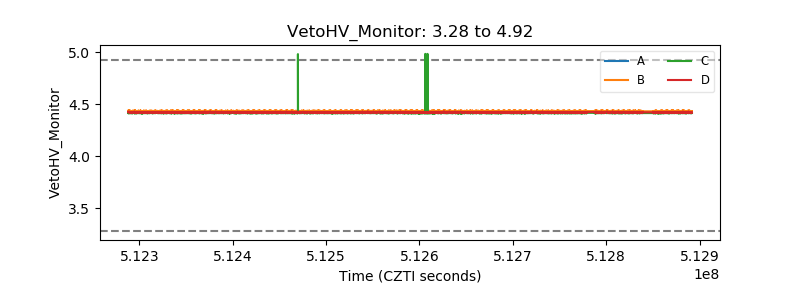 |
| Veto LLD | 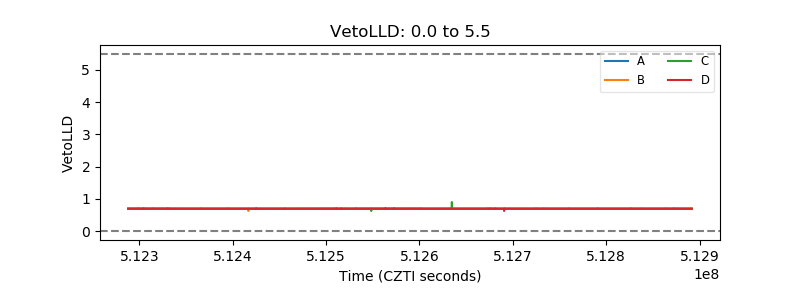 |
| Alpha Counter | 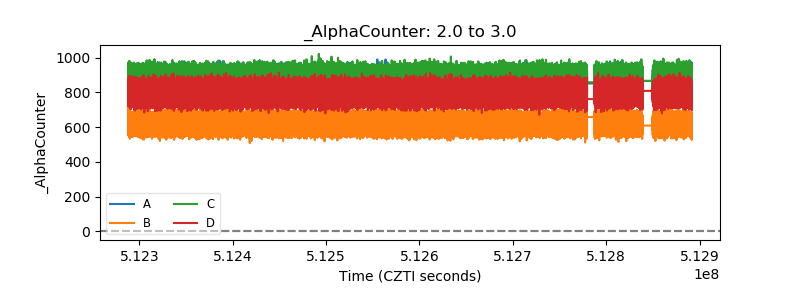 |
| _CPM_Rate | 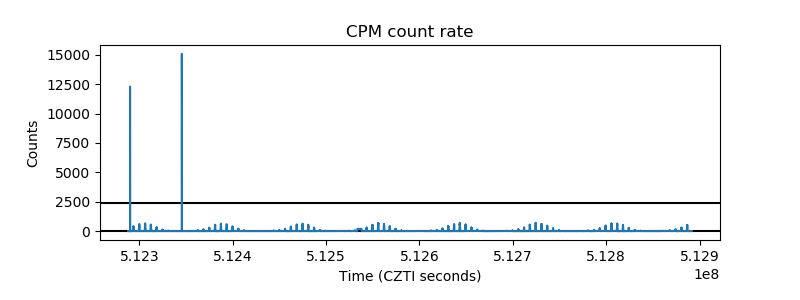 |
| CZT Counter | 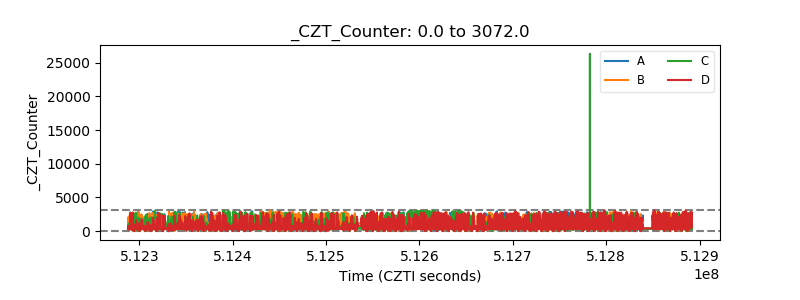 |
| +2.5 Volts monitor | 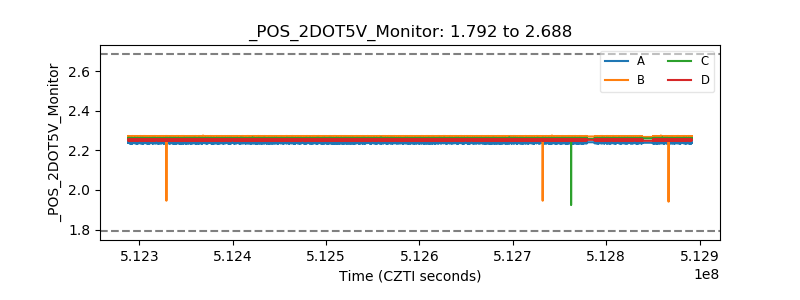 |
| +5 Volts monitor | 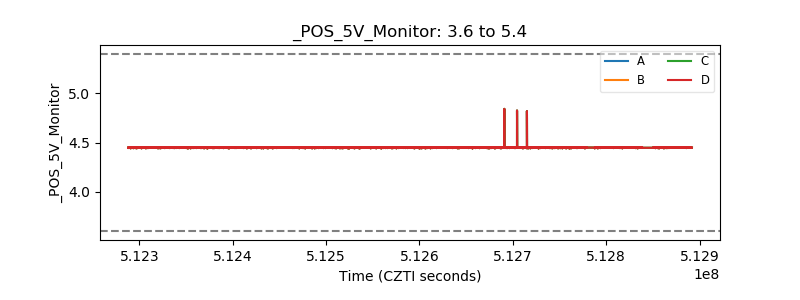 |
| _ROLL_ROT | 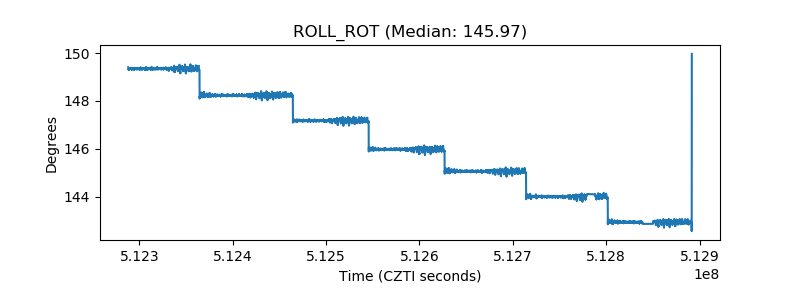 |
| _Roll_DEC | 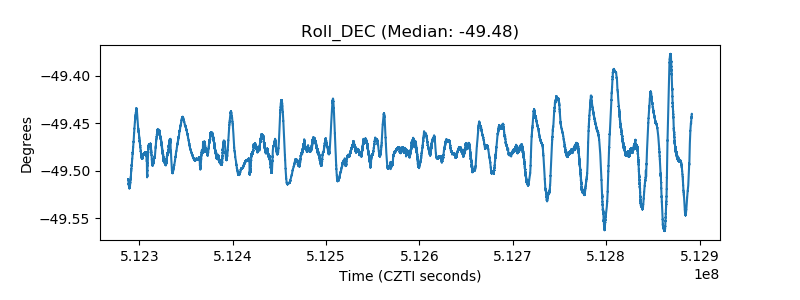 |
| _Roll_RA | 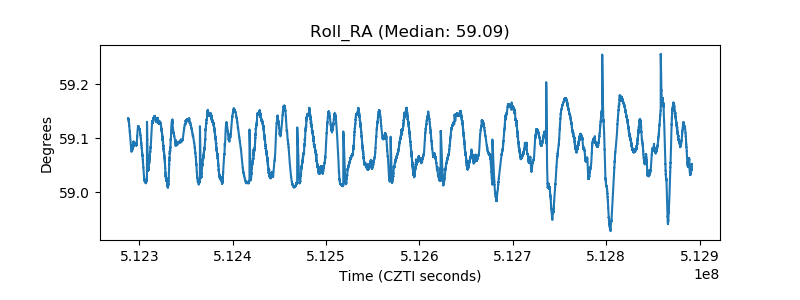 |
| Veto Counter | 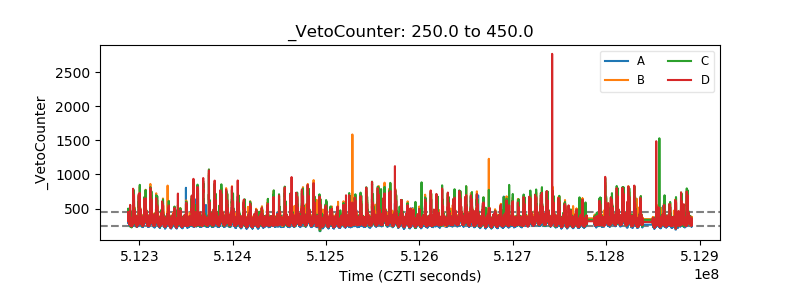 |