| Param | Original file | Final file |
|---|---|---|
| Filename | modeM0/AS1A14_083T03_9000006562_56780cztM0_level2.fits | modeM0/AS1A14_083T03_9000006562_56780cztM0_level2_quad_clean.evt |
| Size (bytes) | 512,997,120 | 97,128,000 |
| Size | 489.2 MB | 92.6 MB |
| Events in quadrant A | 5,782,139 | 626,411 |
| Events in quadrant B | 4,746,344 | 662,152 |
| Events in quadrant C | 4,350,912 | 606,201 |
| Events in quadrant D | 3,590,574 | 578,914 |
| Mode M9 | |||
|---|---|---|---|
| Quadrant | BADHDUFLAG | Total packets | Discarded packets |
| A | 0 | 9 | 0 |
| B | 0 | 9 | 0 |
| C | 0 | 9 | 0 |
| D | 0 | 9 | 0 |
| Mode SS | |||
|---|---|---|---|
| Quadrant | BADHDUFLAG | Total packets | Discarded packets |
| A | 0 | 138 | 0 |
| B | 0 | 138 | 0 |
| C | 0 | 138 | 0 |
| D | 0 | 138 | 0 |
| Mode M0 | |||
|---|---|---|---|
| Quadrant | BADHDUFLAG | Total packets | Discarded packets |
| A | 0 | 22257 | 1 |
| B | 0 | 18757 | 1 |
| C | 0 | 17421 | 1 |
| D | 0 | 15443 | 1 |
| Quadrant | Total seconds | Saturated seconds | Saturation percentage |
|---|---|---|---|
| A | 6696 | 336 | 5.017921% |
| B | 6696 | 484 | 7.228196% |
| C | 6695 | 203 | 3.032114% |
| D | 6696 | 138 | 2.060932% |
Noise dominated data is calculated using 1-second bins in cleaned event files. If a bin has >2000 counts, and if more than 50% of those come from <1% of pixels, then it is considered to be noise-dominated and hence unusable.
| Quadrant | # 1 sec bins | Bins with >0 counts | Bins with >2000 counts | High rate bins dominated by noise | Noise dominated (total time) | Noise dominated (detector-on time) | Marked lightcurve |
|---|---|---|---|---|---|---|---|
| A | 7636 | 6696 | 200 | 200 | 2.62% | 2.99% | 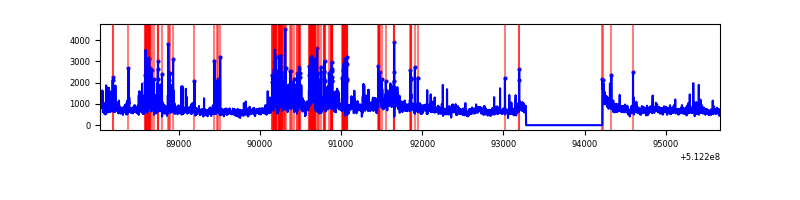 |
| B | 7636 | 6696 | 292 | 292 | 3.82% | 4.36% | 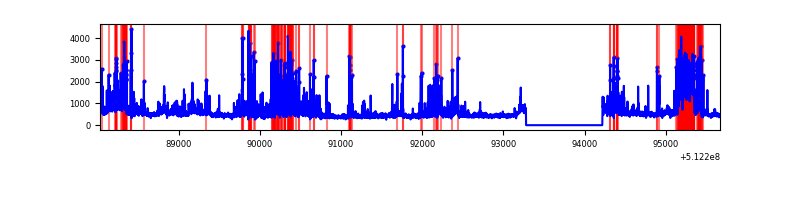 |
| C | 7635 | 6695 | 113 | 113 | 1.48% | 1.69% | 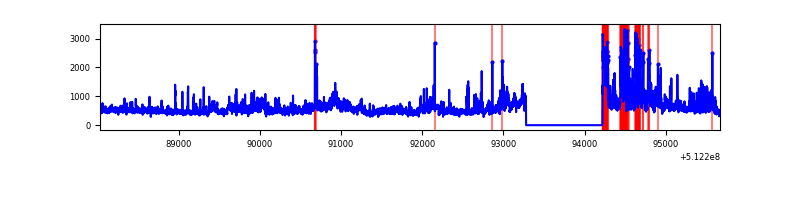 |
| D | 7636 | 6696 | 83 | 83 | 1.09% | 1.24% | 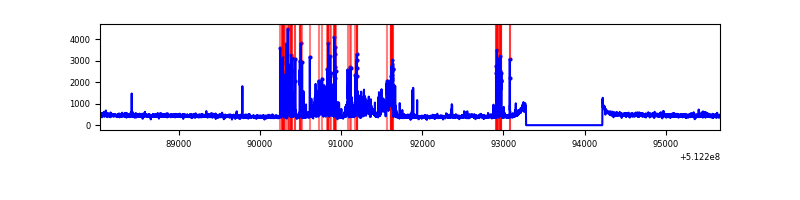 |
Top three noisy pixels from each quadrant. If the there are fewer than three noisy pixels in the level2.evt file, extra rows are filled as -1
| Pixel properties | Quadrant properties | ||||||
|---|---|---|---|---|---|---|---|
| Quadrant | DetID | PixID | Counts | Sigma | Mean | Median | Sigma |
| A | 3 | 14 | 1833840 | 10282.55 | 719 | 700 | 178.3 |
| A | 7 | 64 | 821410 | 4603.57 | 719 | 700 | 178.3 |
| A | 10 | 251 | 286658 | 1604.01 | 719 | 700 | 178.3 |
| B | 2 | 249 | 1081718 | 7136.8 | 705 | 678 | 151.5 |
| B | 8 | 128 | 351367 | 2315.18 | 705 | 678 | 151.5 |
| B | 10 | 247 | 226833 | 1493.03 | 705 | 678 | 151.5 |
| C | 9 | 38 | 570586 | 2967.12 | 703 | 693 | 192.1 |
| C | 15 | 230 | 477991 | 2485.03 | 703 | 693 | 192.1 |
| C | 14 | 96 | 406764 | 2114.19 | 703 | 693 | 192.1 |
| D | 2 | 249 | 674220 | 3350.73 | 709 | 676 | 201.0 |
| D | 5 | 173 | 55562 | 273.05 | 709 | 676 | 201.0 |
| D | 2 | 236 | 42567 | 208.4 | 709 | 676 | 201.0 |
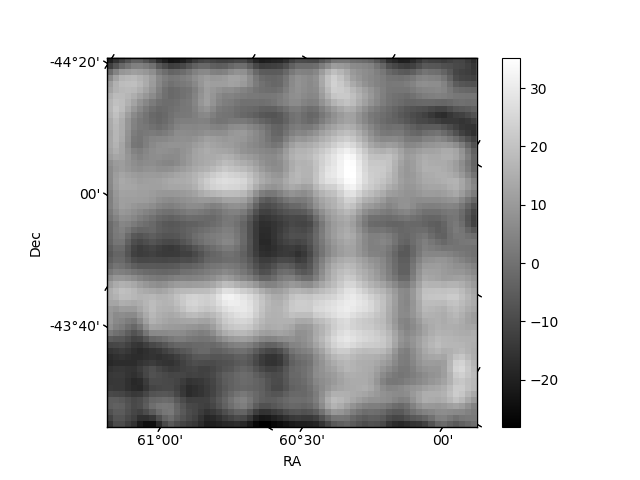
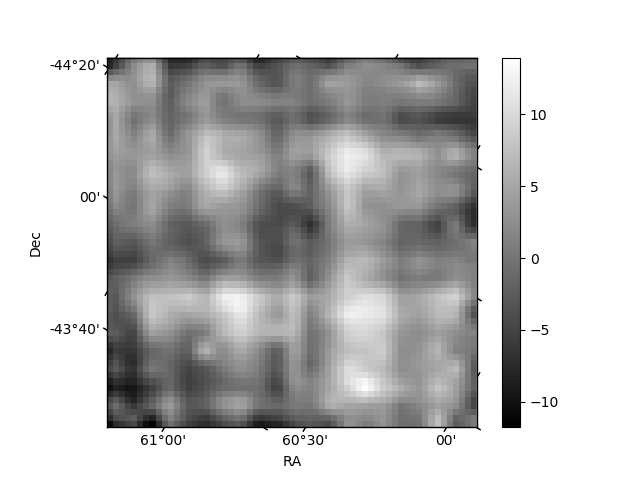
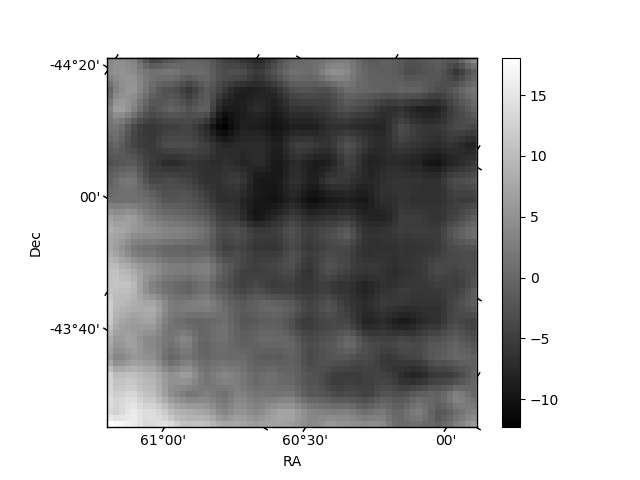
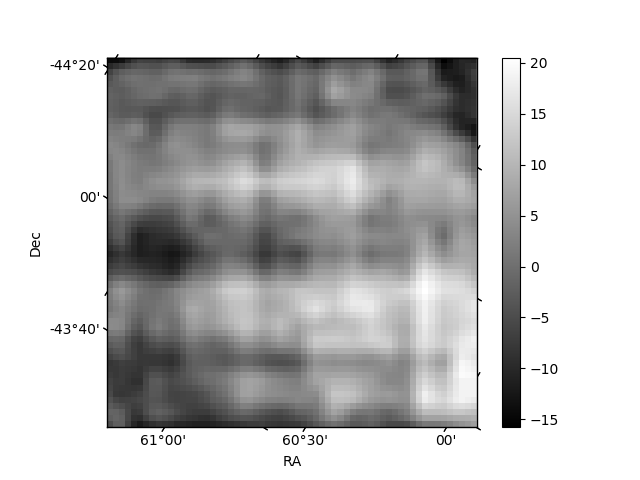
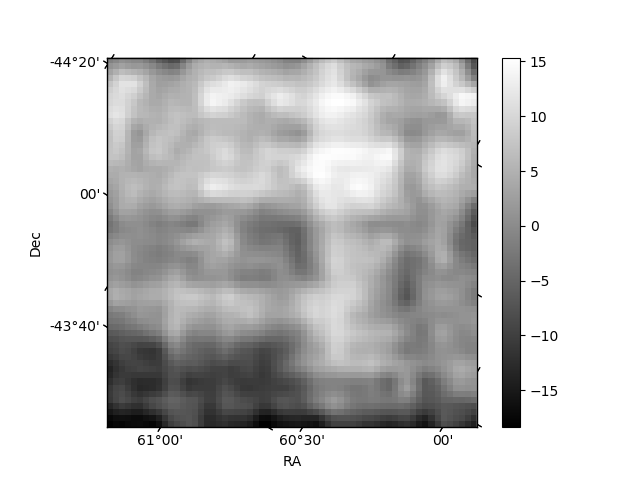
Histogram calculated using DETX and DETY for each event in the final _common_clean file
| Quadrant A | 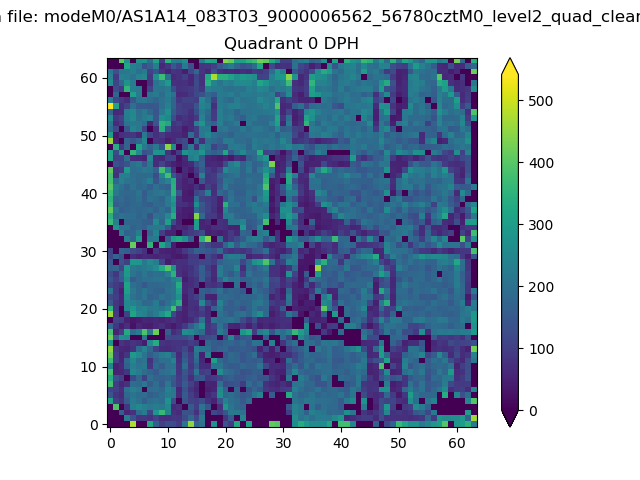 |
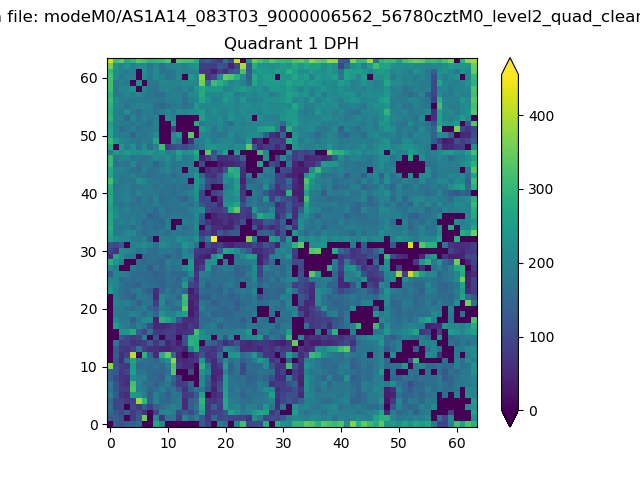 |
Quadrant B |
|---|---|---|---|
| Quadrant D | 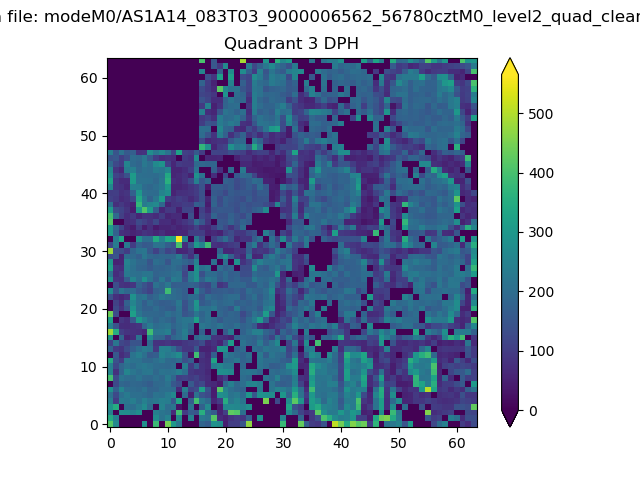 |
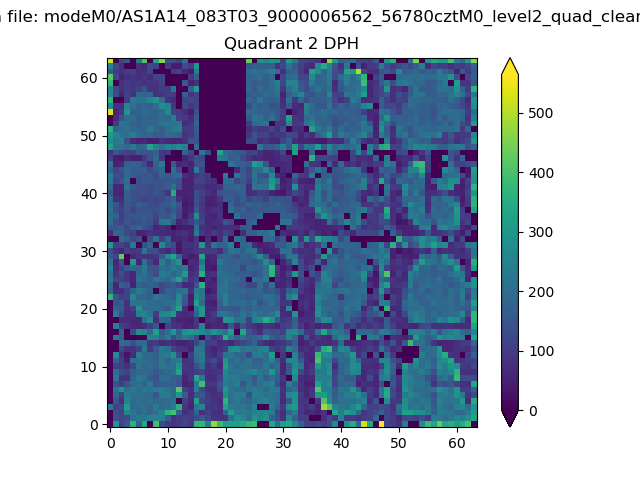 |
Quadrant C |
| Plot type | Count rate plots | Images |
|---|---|---|
| Comparison with Poisson distribution Blue bars denote a histogram of data divided into 1 sec bins. Red curve is a Poisson curve with rate = median count rate of data. |
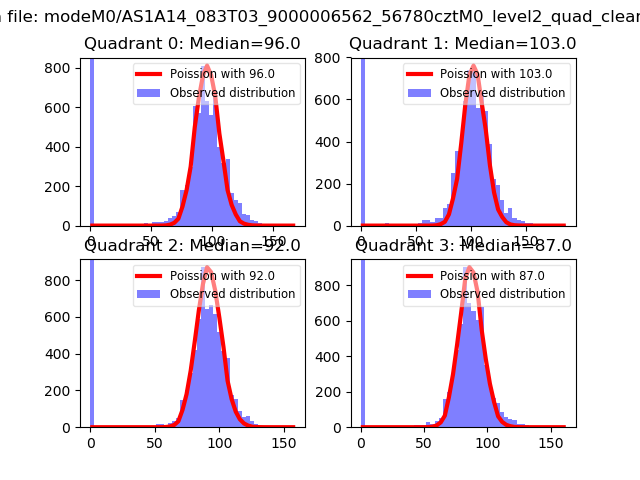 |
 |
| Quadrant-wise count rates Data is divided into 100 sec bins |
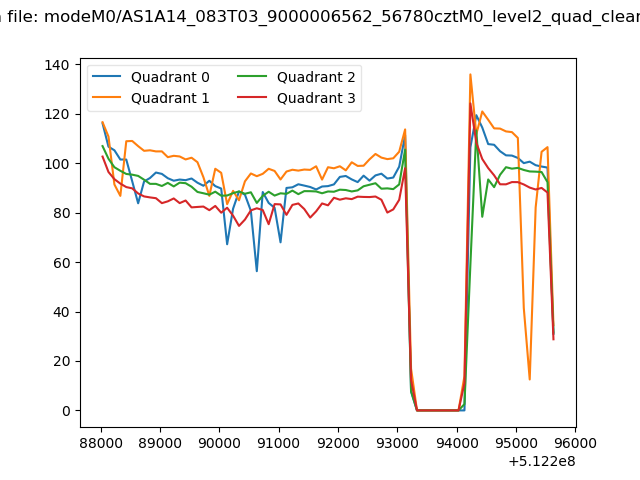 |
|
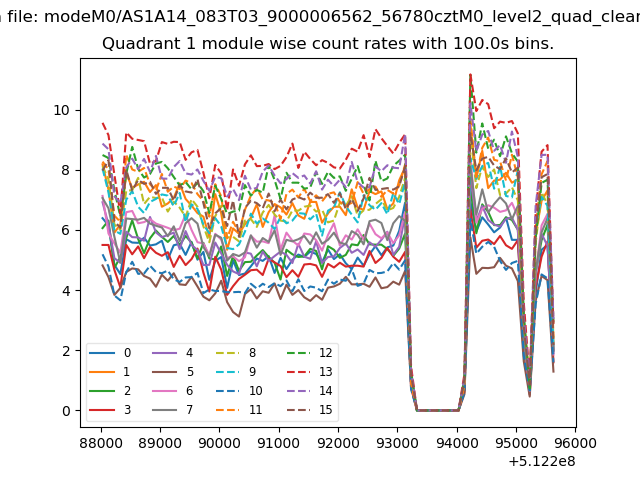
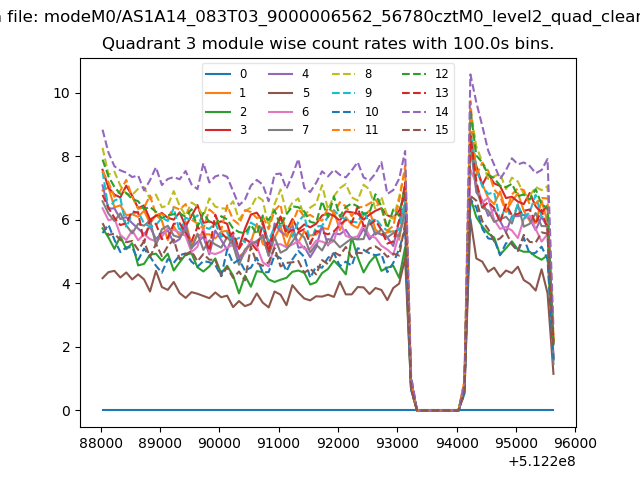
| Module-wise count rates for Quadrant A Data is divided into 100 sec bins |
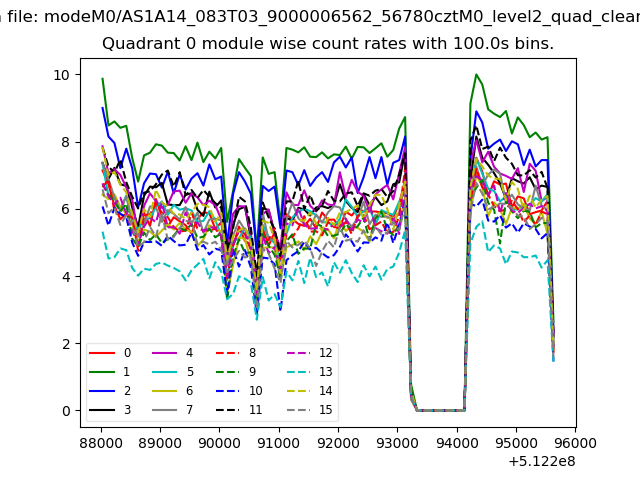 |
 |
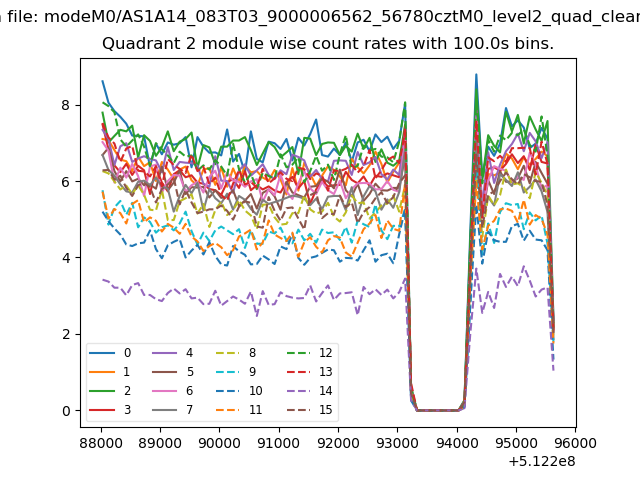
| Module-wise count rates for Quadrant B Data is divided into 100 sec bins |
 |
 |
| Module-wise count rates for Quadrant C Data is divided into 100 sec bins |
 |
 |
| Module-wise count rates for Quadrant D Data is divided into 100 sec bins |
 |
 |
| Parameter | Plot |
|---|---|
| CZT HV Monitor | 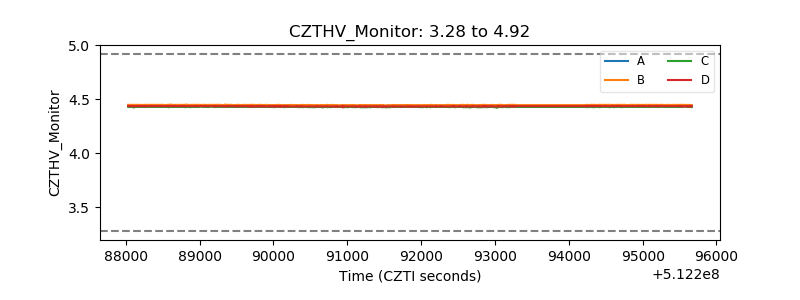 |
| D_VDD | 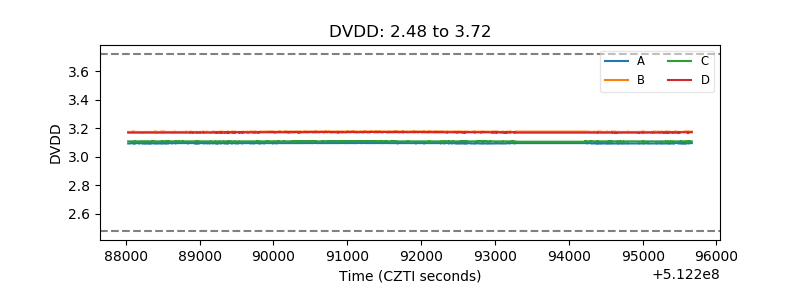 |
| Temperature 1 | 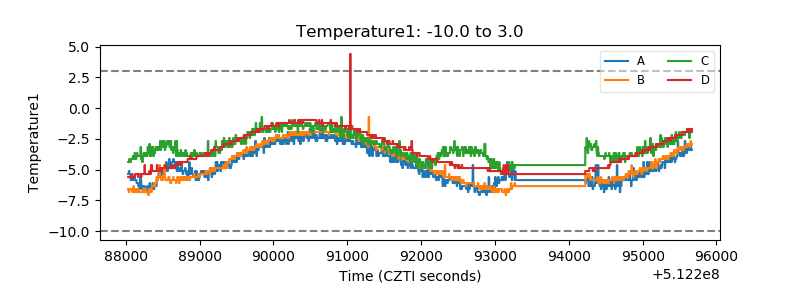 |
| Veto HV Monitor | 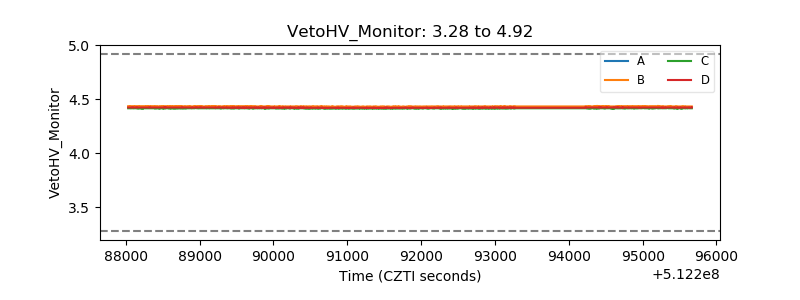 |
| Veto LLD | 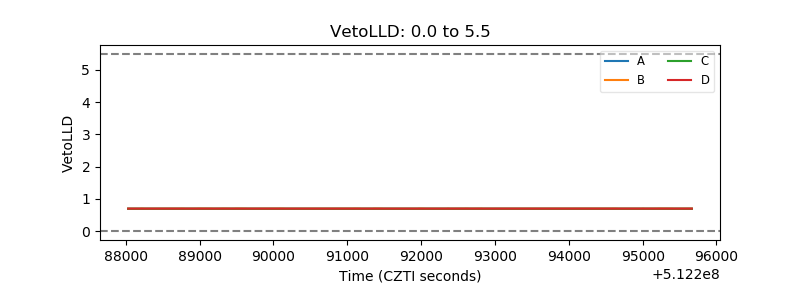 |
| Alpha Counter | 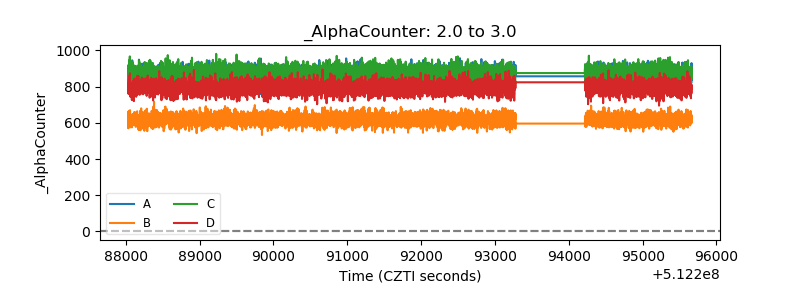 |
| _CPM_Rate | 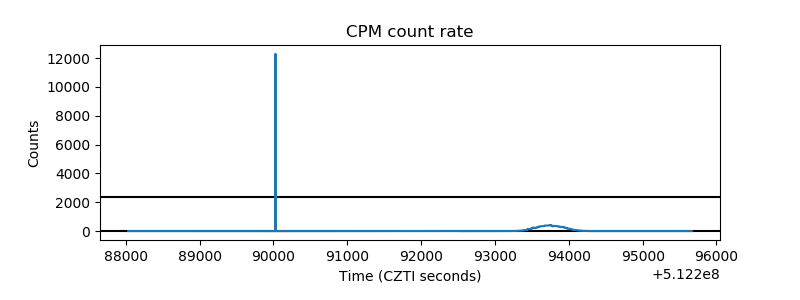 |
| CZT Counter | 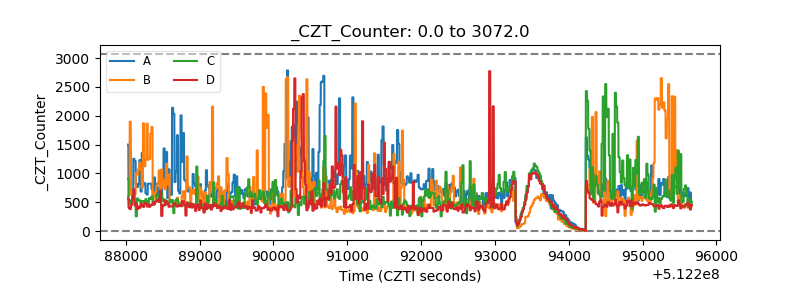 |
| +2.5 Volts monitor |  |
| +5 Volts monitor |  |
| _ROLL_ROT | 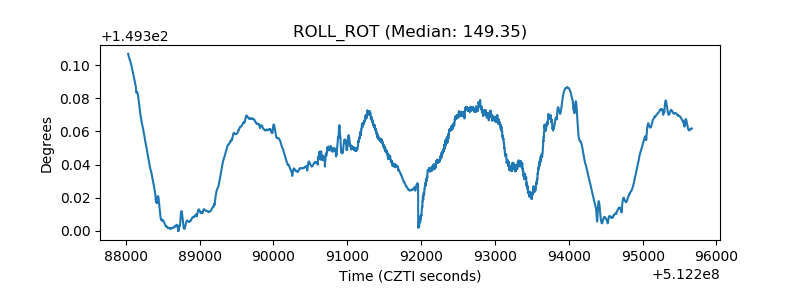 |
| _Roll_DEC | 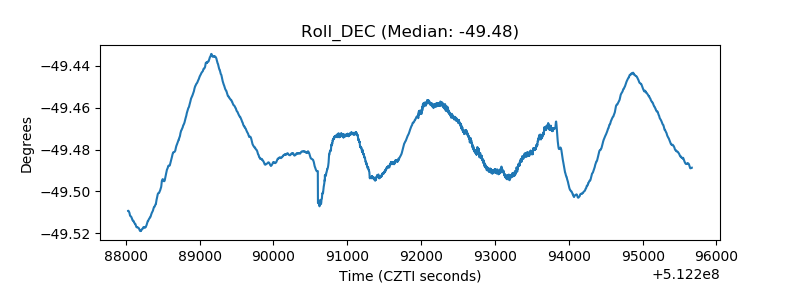 |
| _Roll_RA | 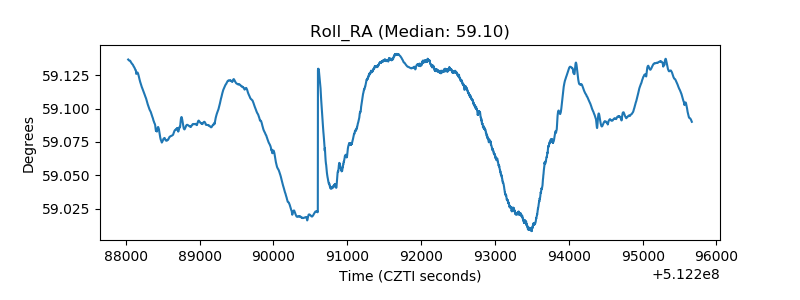 |
| Veto Counter | 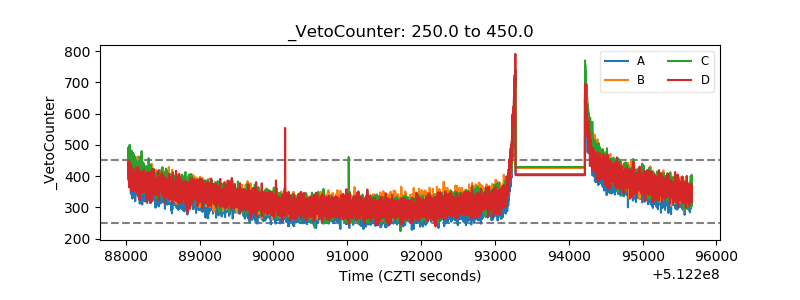 |