| Param | Original file | Final file |
|---|---|---|
| Filename | modeM0/AS1A14_083T03_9000006562_56782cztM0_level2.fits | modeM0/AS1A14_083T03_9000006562_56782cztM0_level2_quad_clean.evt |
| Size (bytes) | 443,626,560 | 89,982,720 |
| Size | 423.1 MB | 85.8 MB |
| Events in quadrant A | 4,392,270 | 598,159 |
| Events in quadrant B | 4,690,512 | 608,255 |
| Events in quadrant C | 4,035,234 | 554,245 |
| Events in quadrant D | 2,832,737 | 540,740 |
| Mode M9 | |||
|---|---|---|---|
| Quadrant | BADHDUFLAG | Total packets | Discarded packets |
| A | 0 | 11 | 0 |
| B | 0 | 11 | 0 |
| C | 0 | 11 | 0 |
| D | 0 | 11 | 0 |
| Mode SS | |||
|---|---|---|---|
| Quadrant | BADHDUFLAG | Total packets | Discarded packets |
| A | 0 | 124 | 0 |
| B | 0 | 124 | 0 |
| C | 0 | 124 | 0 |
| D | 0 | 124 | 0 |
| Mode M0 | |||
|---|---|---|---|
| Quadrant | BADHDUFLAG | Total packets | Discarded packets |
| A | 0 | 17595 | 1 |
| B | 0 | 18174 | 1 |
| C | 0 | 16359 | 1 |
| D | 0 | 12798 | 1 |
| Quadrant | Total seconds | Saturated seconds | Saturation percentage |
|---|---|---|---|
| A | 6061 | 113 | 1.864379% |
| B | 6061 | 503 | 8.298961% |
| C | 6061 | 255 | 4.207227% |
| D | 6061 | 48 | 0.791949% |
Noise dominated data is calculated using 1-second bins in cleaned event files. If a bin has >2000 counts, and if more than 50% of those come from <1% of pixels, then it is considered to be noise-dominated and hence unusable.
| Quadrant | # 1 sec bins | Bins with >0 counts | Bins with >2000 counts | High rate bins dominated by noise | Noise dominated (total time) | Noise dominated (detector-on time) | Marked lightcurve |
|---|---|---|---|---|---|---|---|
| A | 7192 | 6062 | 43 | 43 | 0.60% | 0.71% | 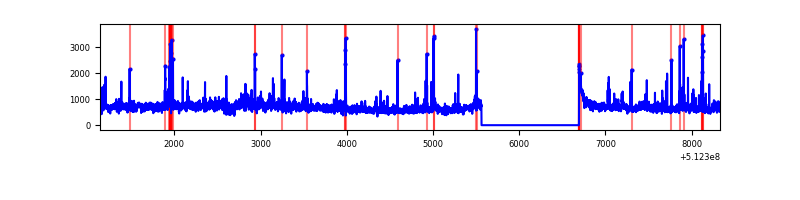 |
| B | 7192 | 6062 | 287 | 287 | 3.99% | 4.73% | 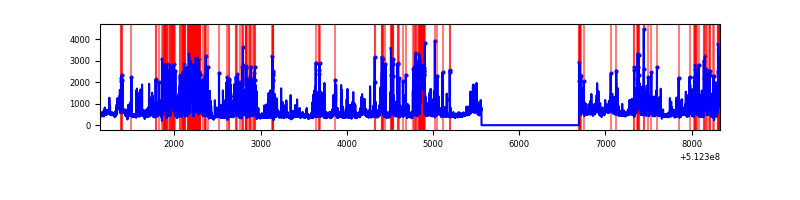 |
| C | 7192 | 6062 | 213 | 213 | 2.96% | 3.51% | 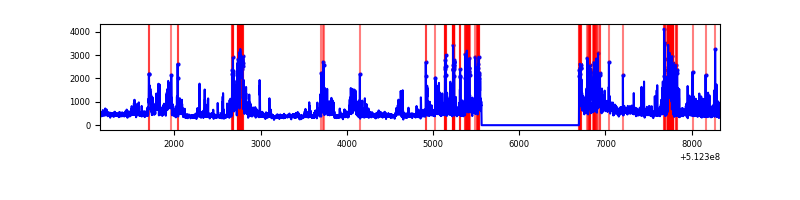 |
| D | 7192 | 6062 | 25 | 25 | 0.35% | 0.41% | 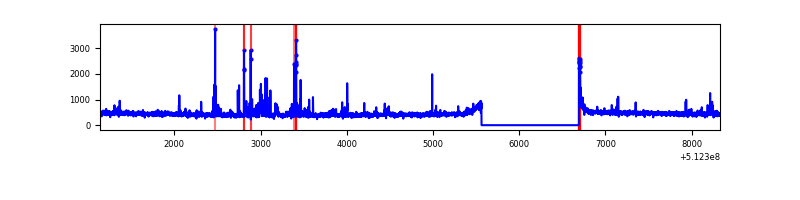 |
Top three noisy pixels from each quadrant. If the there are fewer than three noisy pixels in the level2.evt file, extra rows are filled as -1
| Pixel properties | Quadrant properties | ||||||
|---|---|---|---|---|---|---|---|
| Quadrant | DetID | PixID | Counts | Sigma | Mean | Median | Sigma |
| A | 3 | 14 | 1526409 | 9348.42 | 658 | 643 | 163.2 |
| A | 10 | 251 | 248760 | 1520.22 | 658 | 643 | 163.2 |
| A | 3 | 62 | 22821 | 135.89 | 658 | 643 | 163.2 |
| B | 4 | 206 | 1423110 | 10577.85 | 630 | 609 | 134.5 |
| B | 2 | 249 | 367274 | 2726.55 | 630 | 609 | 134.5 |
| B | 10 | 247 | 101647 | 751.33 | 630 | 609 | 134.5 |
| C | 15 | 230 | 470646 | 2738.8 | 623 | 617 | 171.6 |
| C | 9 | 38 | 375152 | 2182.37 | 623 | 617 | 171.6 |
| C | 14 | 96 | 368326 | 2142.59 | 623 | 617 | 171.6 |
| D | 2 | 249 | 169382 | 930.42 | 638 | 610 | 181.4 |
| D | 5 | 173 | 47112 | 256.36 | 638 | 610 | 181.4 |
| D | 15 | 142 | 43233 | 234.98 | 638 | 610 | 181.4 |
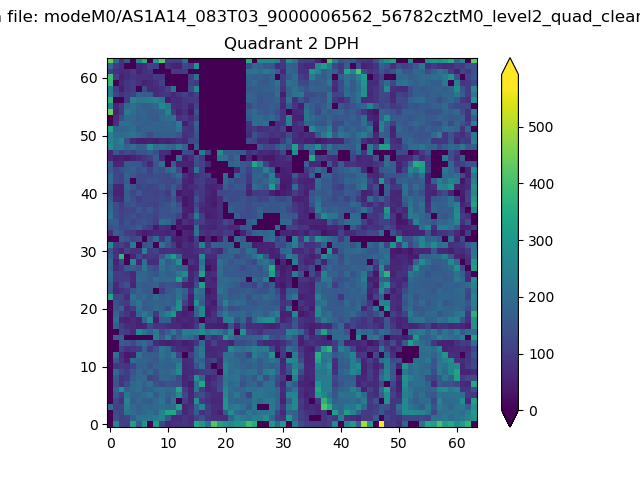
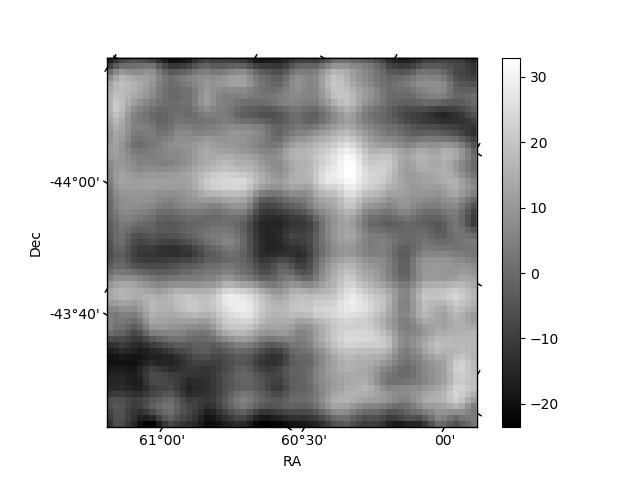
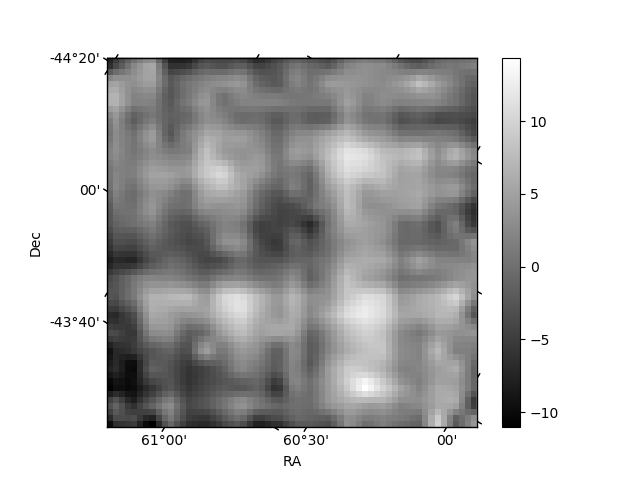
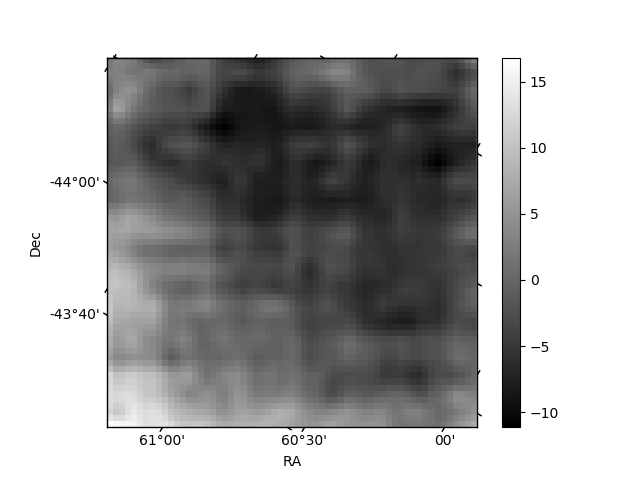
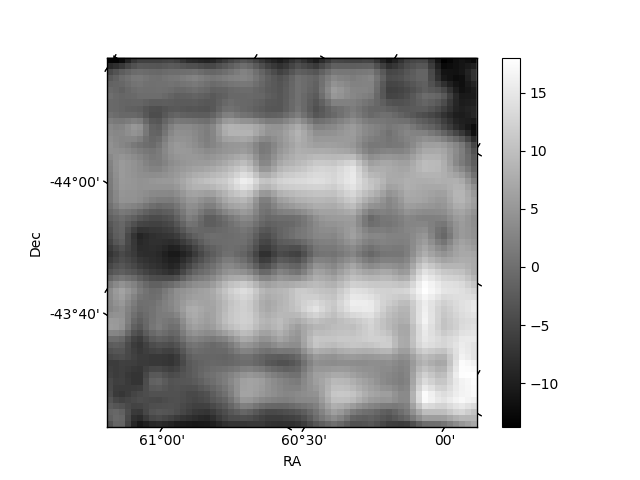
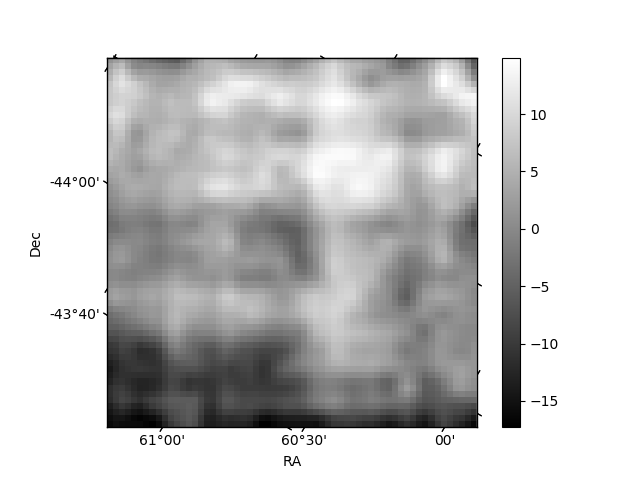
Histogram calculated using DETX and DETY for each event in the final _common_clean file
| Quadrant A | 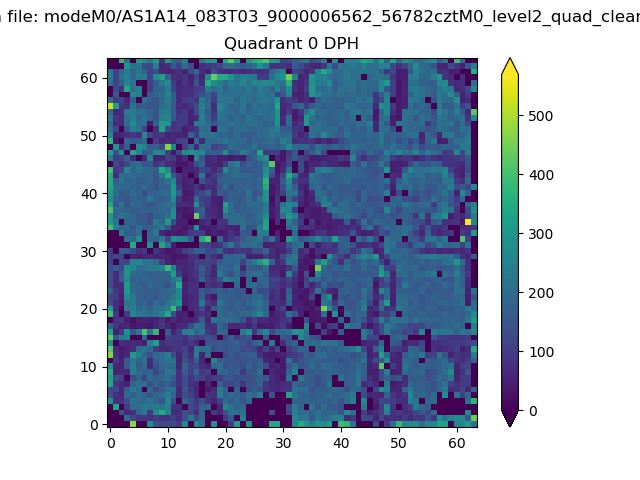 |
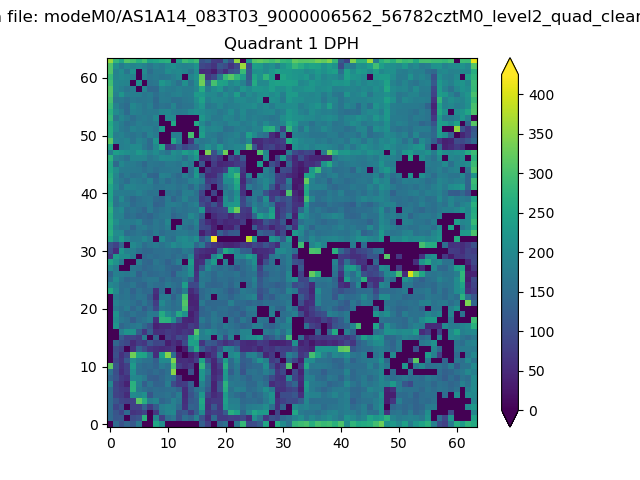 |
Quadrant B |
|---|---|---|---|
| Quadrant D | 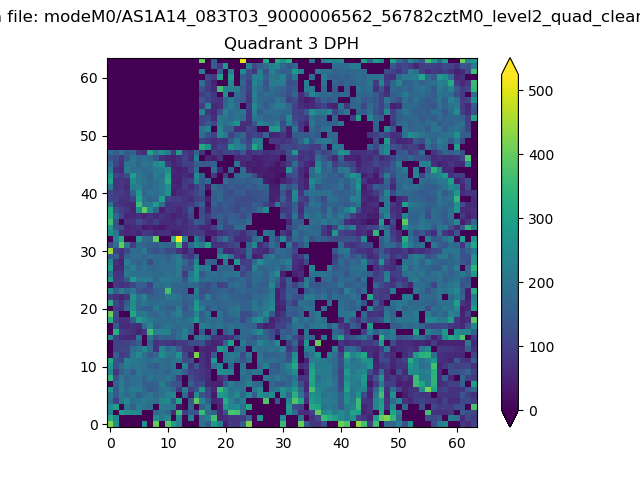 |
 |
Quadrant C |
| Plot type | Count rate plots | Images |
|---|---|---|
| Comparison with Poisson distribution Blue bars denote a histogram of data divided into 1 sec bins. Red curve is a Poisson curve with rate = median count rate of data. |
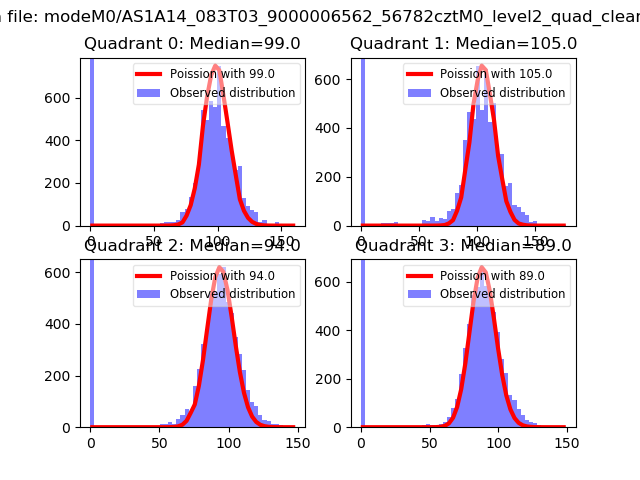 |
 |
| Quadrant-wise count rates Data is divided into 100 sec bins |
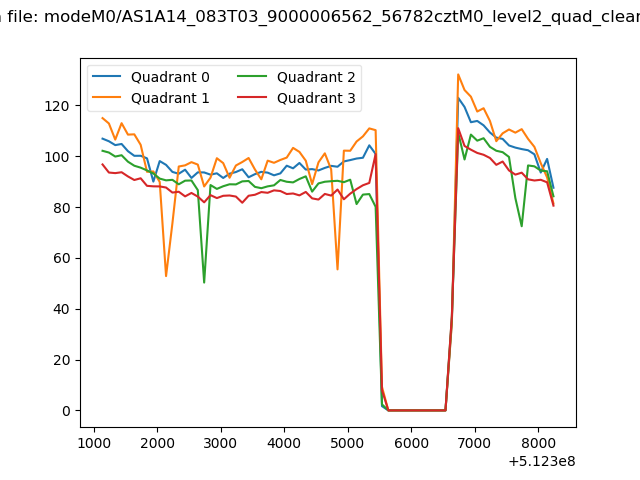 |
|
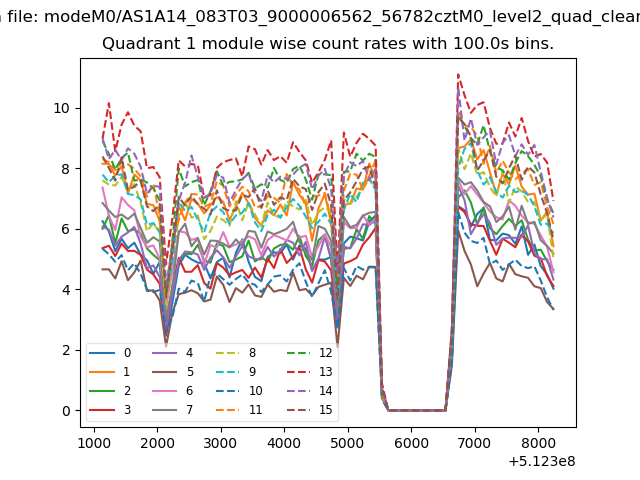
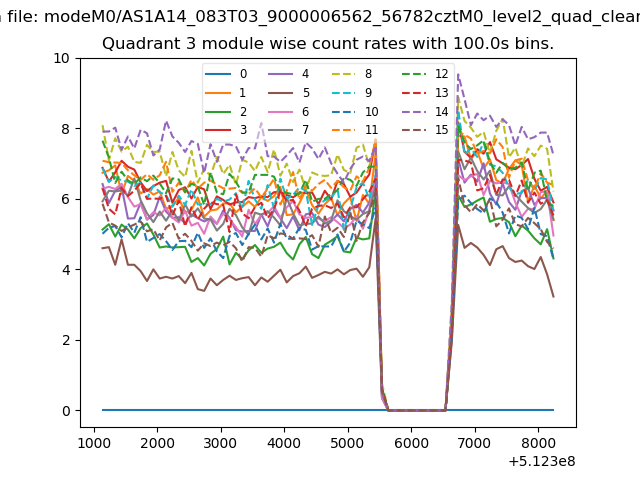
| Module-wise count rates for Quadrant A Data is divided into 100 sec bins |
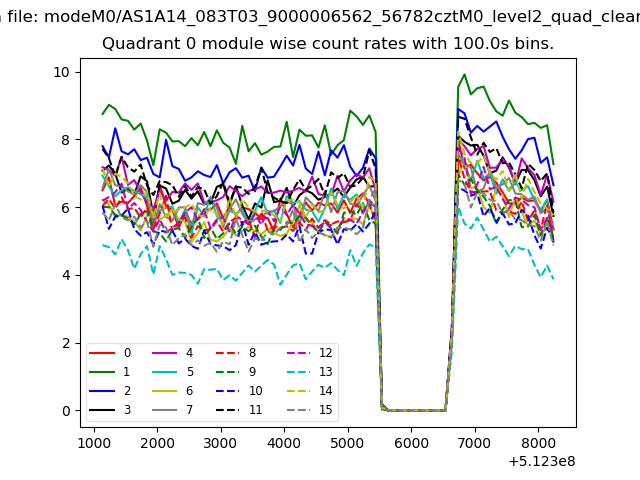 |
 |
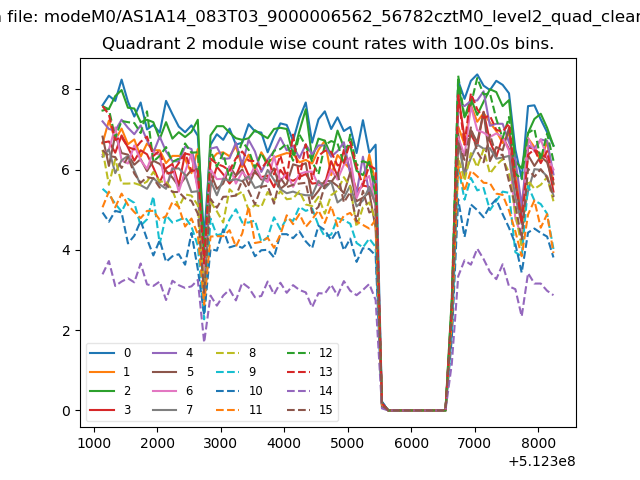
| Module-wise count rates for Quadrant B Data is divided into 100 sec bins |
 |
 |
| Module-wise count rates for Quadrant C Data is divided into 100 sec bins |
 |
 |
| Module-wise count rates for Quadrant D Data is divided into 100 sec bins |
 |
 |
| Parameter | Plot |
|---|---|
| CZT HV Monitor | 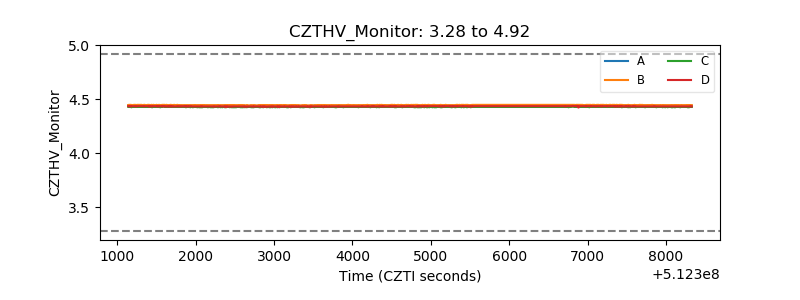 |
| D_VDD | 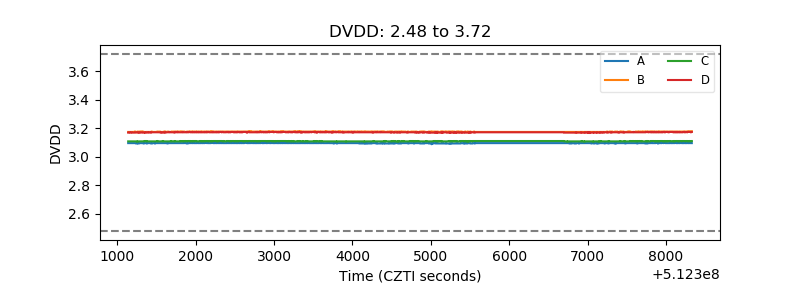 |
| Temperature 1 | 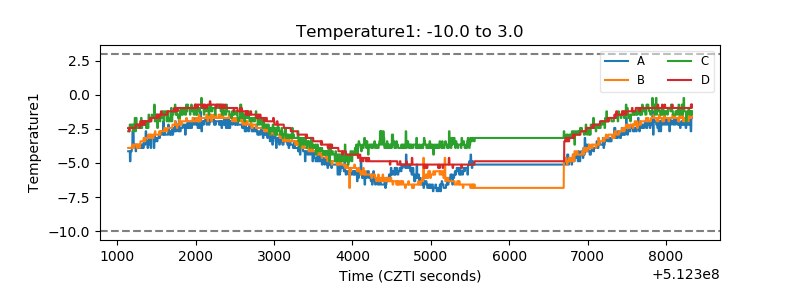 |
| Veto HV Monitor |  |
| Veto LLD | 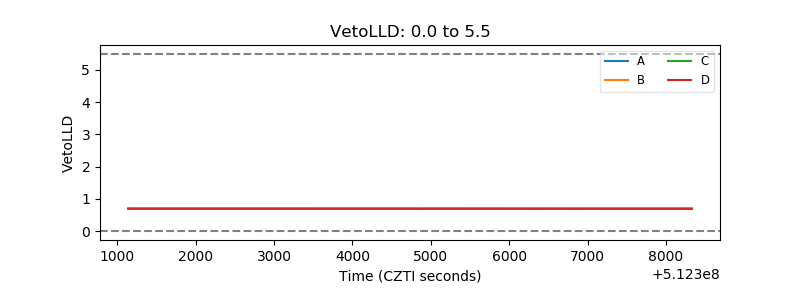 |
| Alpha Counter | 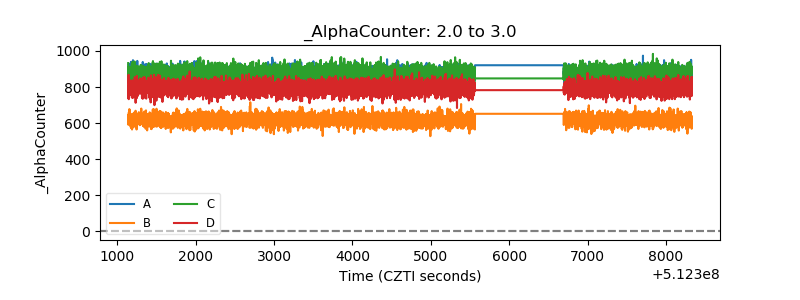 |
| _CPM_Rate | 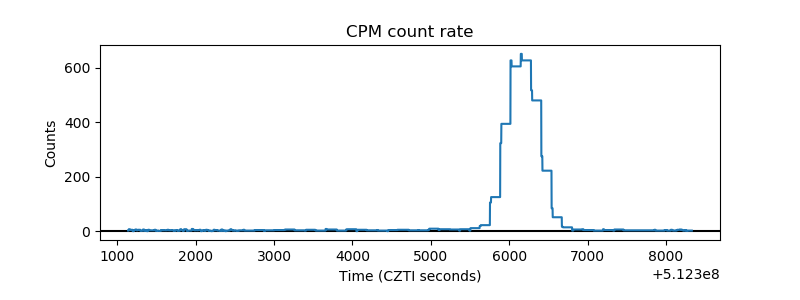 |
| CZT Counter | 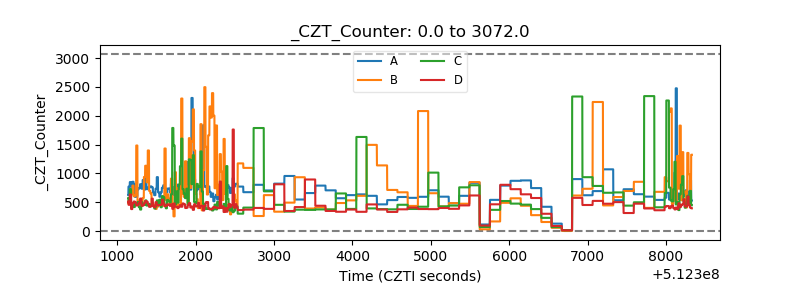 |
| +2.5 Volts monitor |  |
| +5 Volts monitor |  |
| _ROLL_ROT | 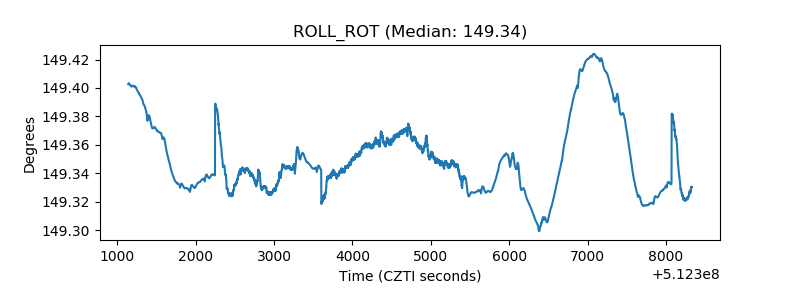 |
| _Roll_DEC | 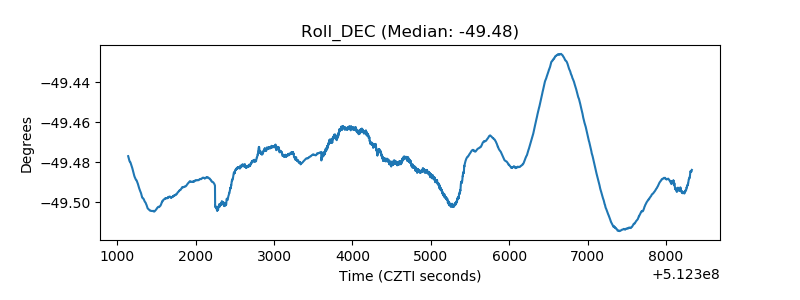 |
| _Roll_RA | 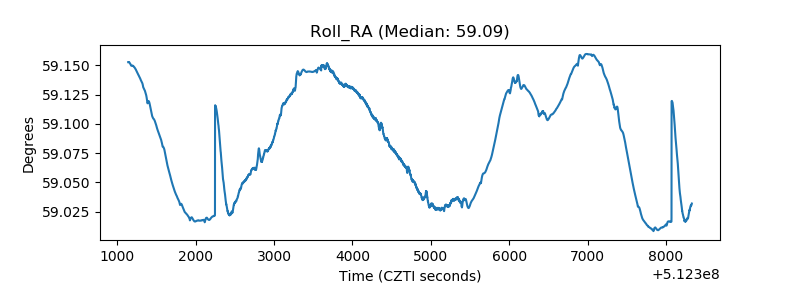 |
| Veto Counter | 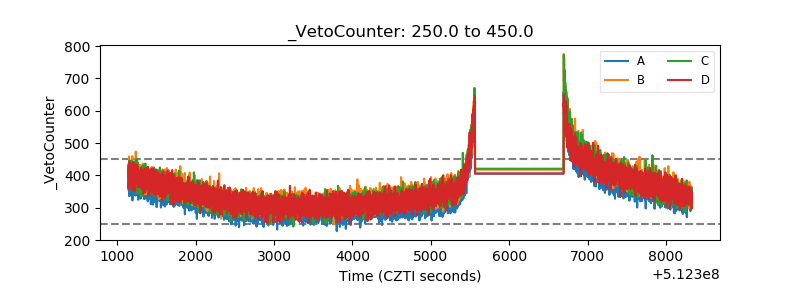 |