| Param | Original file | Final file |
|---|---|---|
| Filename | modeM0/AS1A14_083T03_9000006562_56783cztM0_level2.fits | modeM0/AS1A14_083T03_9000006562_56783cztM0_level2_quad_clean.evt |
| Size (bytes) | 411,891,840 | 90,103,680 |
| Size | 392.8 MB | 85.9 MB |
| Events in quadrant A | 4,496,392 | 583,523 |
| Events in quadrant B | 3,906,834 | 614,020 |
| Events in quadrant C | 3,609,699 | 564,021 |
| Events in quadrant D | 2,759,411 | 540,799 |
| Mode M9 | |||
|---|---|---|---|
| Quadrant | BADHDUFLAG | Total packets | Discarded packets |
| A | 0 | 11 | 0 |
| B | 0 | 11 | 0 |
| C | 0 | 11 | 0 |
| D | 0 | 11 | 0 |
| Mode SS | |||
|---|---|---|---|
| Quadrant | BADHDUFLAG | Total packets | Discarded packets |
| A | 0 | 124 | 0 |
| B | 0 | 124 | 0 |
| C | 0 | 124 | 0 |
| D | 0 | 124 | 0 |
| Mode M0 | |||
|---|---|---|---|
| Quadrant | BADHDUFLAG | Total packets | Discarded packets |
| A | 0 | 17700 | 1 |
| B | 0 | 15888 | 1 |
| C | 0 | 15013 | 1 |
| D | 0 | 12731 | 1 |
| Quadrant | Total seconds | Saturated seconds | Saturation percentage |
|---|---|---|---|
| A | 6102 | 272 | 4.457555% |
| B | 6103 | 388 | 6.357529% |
| C | 6103 | 151 | 2.474193% |
| D | 6103 | 67 | 1.097821% |
Noise dominated data is calculated using 1-second bins in cleaned event files. If a bin has >2000 counts, and if more than 50% of those come from <1% of pixels, then it is considered to be noise-dominated and hence unusable.
| Quadrant | # 1 sec bins | Bins with >0 counts | Bins with >2000 counts | High rate bins dominated by noise | Noise dominated (total time) | Noise dominated (detector-on time) | Marked lightcurve |
|---|---|---|---|---|---|---|---|
| A | 7197 | 6103 | 152 | 152 | 2.11% | 2.49% | 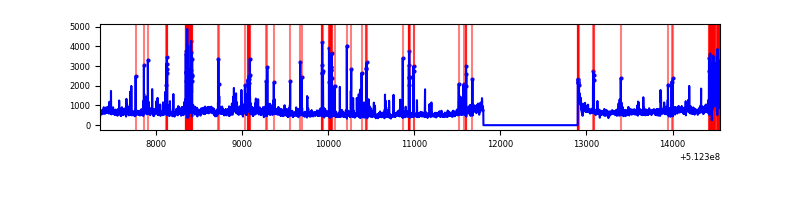 |
| B | 7198 | 6103 | 168 | 168 | 2.33% | 2.75% | 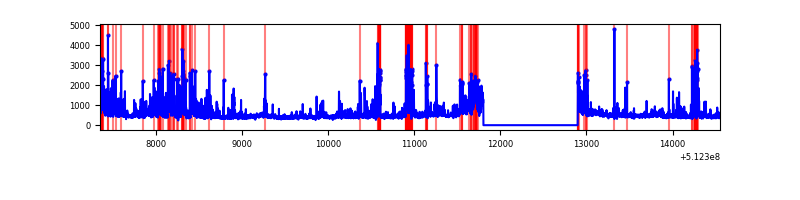 |
| C | 7198 | 6104 | 106 | 106 | 1.47% | 1.74% | 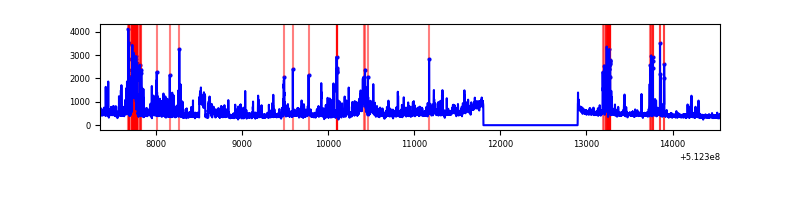 |
| D | 7198 | 6103 | 15 | 15 | 0.21% | 0.25% | 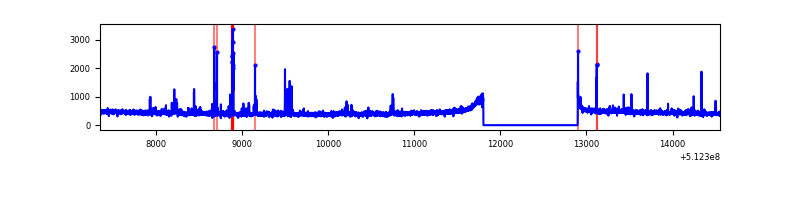 |
Top three noisy pixels from each quadrant. If the there are fewer than three noisy pixels in the level2.evt file, extra rows are filled as -1
| Pixel properties | Quadrant properties | ||||||
|---|---|---|---|---|---|---|---|
| Quadrant | DetID | PixID | Counts | Sigma | Mean | Median | Sigma |
| A | 3 | 14 | 1237221 | 7589.74 | 658 | 643 | 162.9 |
| A | 10 | 251 | 421795 | 2584.9 | 658 | 643 | 162.9 |
| A | 3 | 62 | 235509 | 1441.54 | 658 | 643 | 162.9 |
| B | 4 | 206 | 462302 | 3386.9 | 637 | 614 | 136.3 |
| B | 2 | 249 | 297729 | 2179.61 | 637 | 614 | 136.3 |
| B | 8 | 128 | 229541 | 1679.39 | 637 | 614 | 136.3 |
| C | 9 | 38 | 556887 | 3195.15 | 634 | 626 | 174.1 |
| C | 13 | 3 | 301351 | 1727.36 | 634 | 626 | 174.1 |
| C | 14 | 96 | 166691 | 953.87 | 634 | 626 | 174.1 |
| D | 2 | 249 | 87095 | 474.78 | 644 | 615 | 182.1 |
| D | 5 | 173 | 46390 | 251.31 | 644 | 615 | 182.1 |
| D | 2 | 236 | 35658 | 192.39 | 644 | 615 | 182.1 |
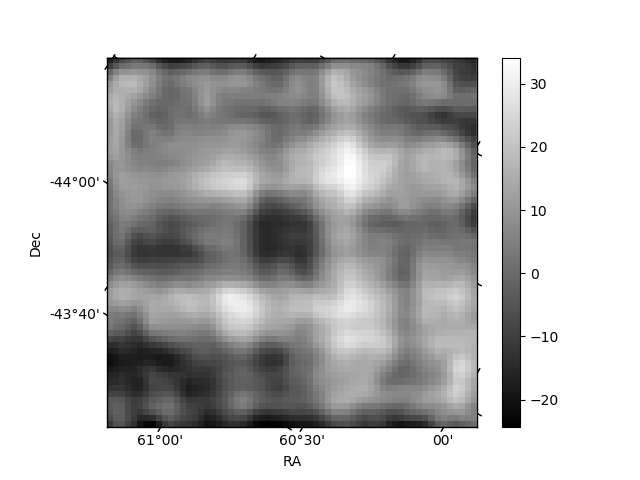
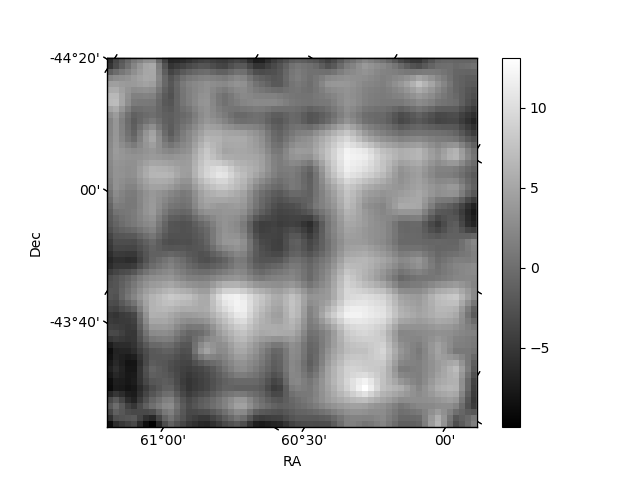
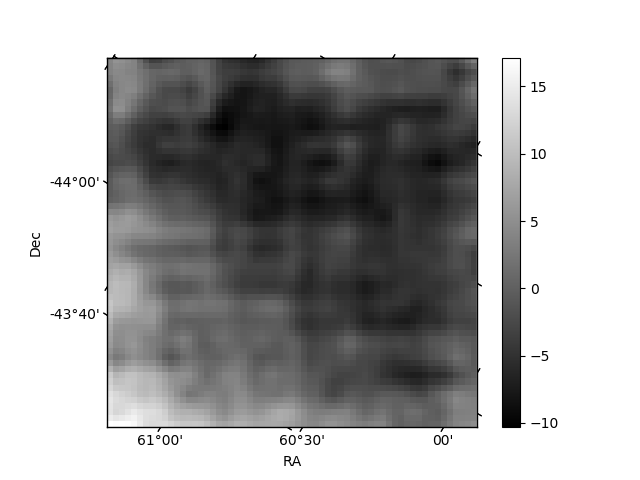
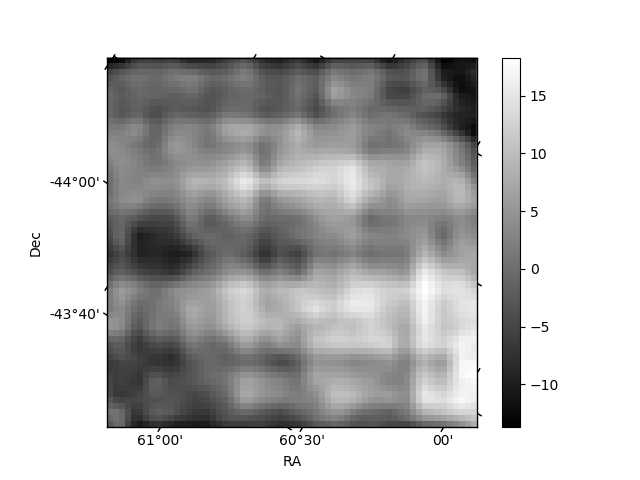
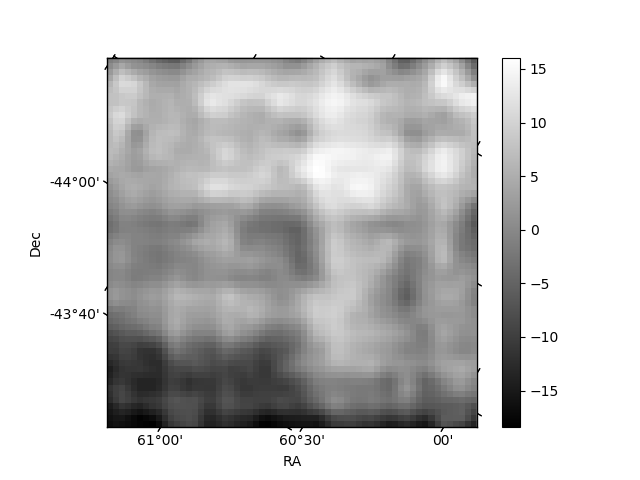
Histogram calculated using DETX and DETY for each event in the final _common_clean file
| Quadrant A | 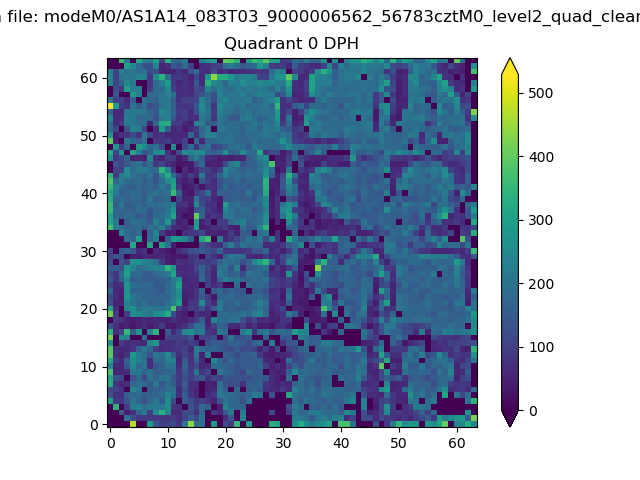 |
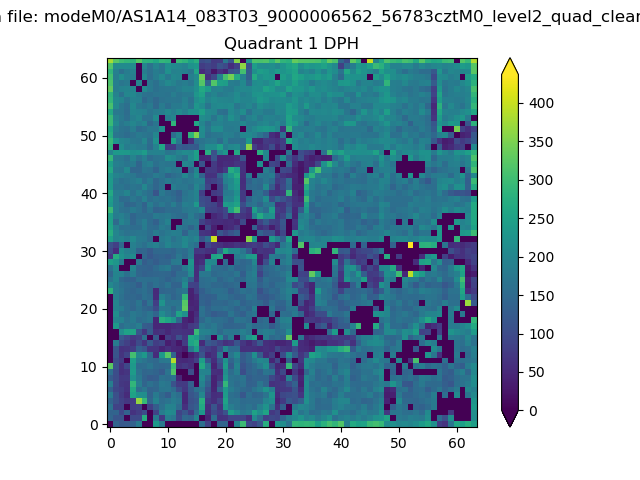 |
Quadrant B |
|---|---|---|---|
| Quadrant D | 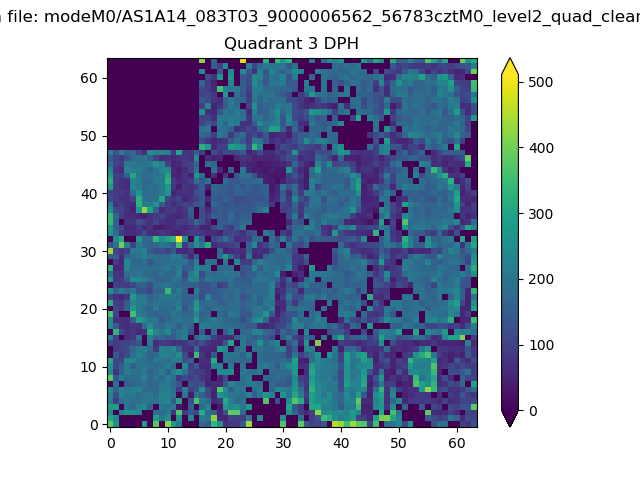 |
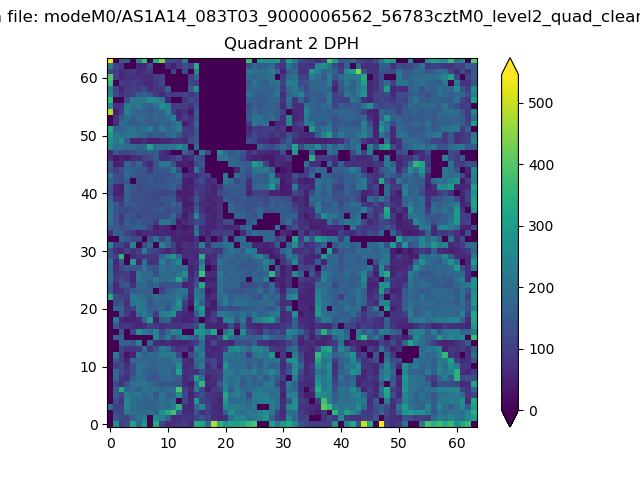 |
Quadrant C |
| Plot type | Count rate plots | Images |
|---|---|---|
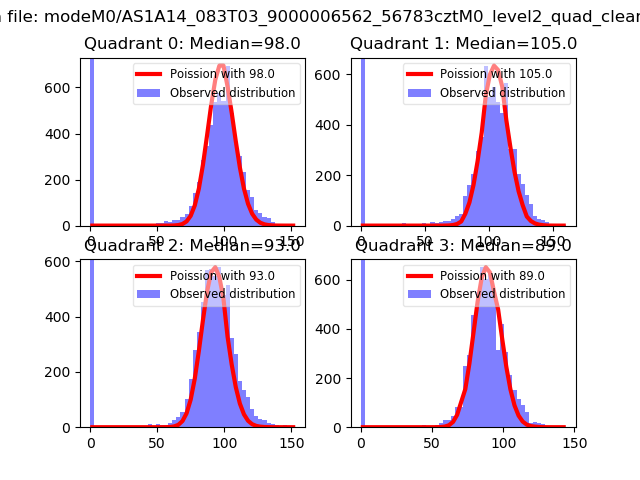
| Comparison with Poisson distribution Blue bars denote a histogram of data divided into 1 sec bins. Red curve is a Poisson curve with rate = median count rate of data. |
 |
 |
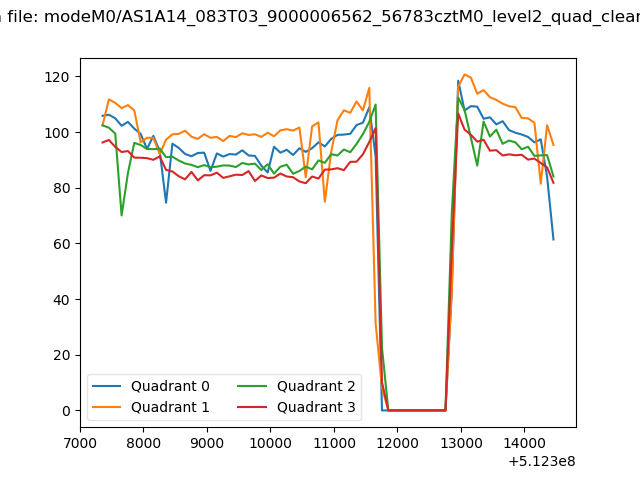
| Quadrant-wise count rates Data is divided into 100 sec bins |
 |
|
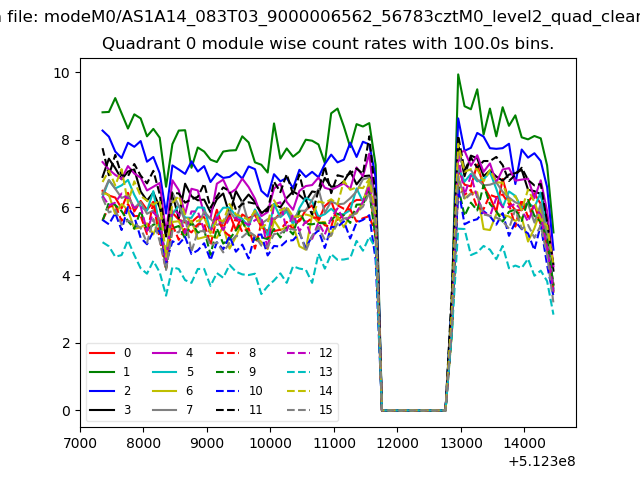
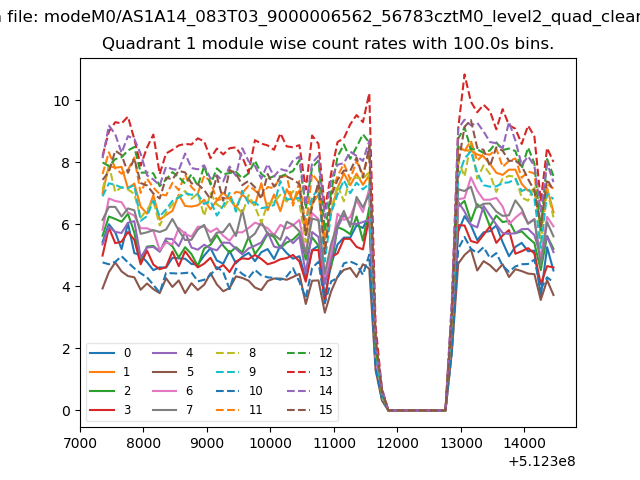
| Module-wise count rates for Quadrant A Data is divided into 100 sec bins |
 |
 |
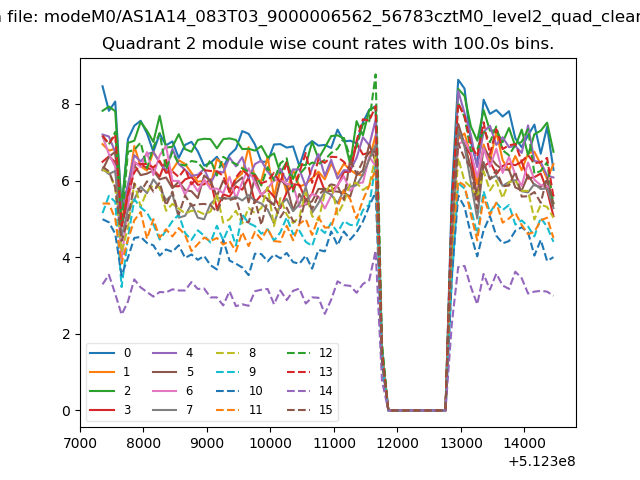
| Module-wise count rates for Quadrant B Data is divided into 100 sec bins |
 |
 |
| Module-wise count rates for Quadrant C Data is divided into 100 sec bins |
 |
 |
| Module-wise count rates for Quadrant D Data is divided into 100 sec bins |
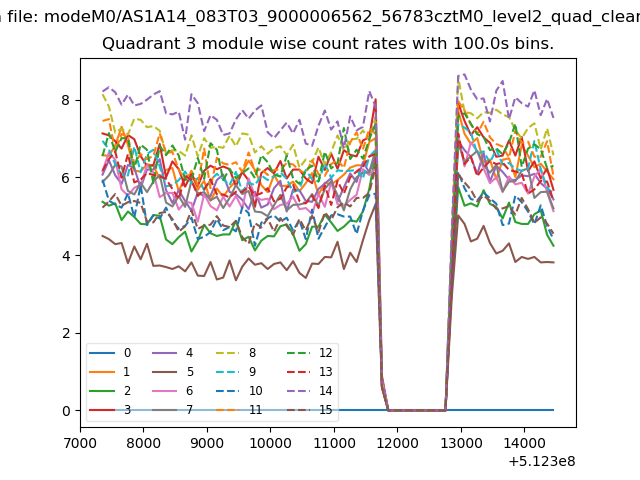 |
 |
| Parameter | Plot |
|---|---|
| CZT HV Monitor | 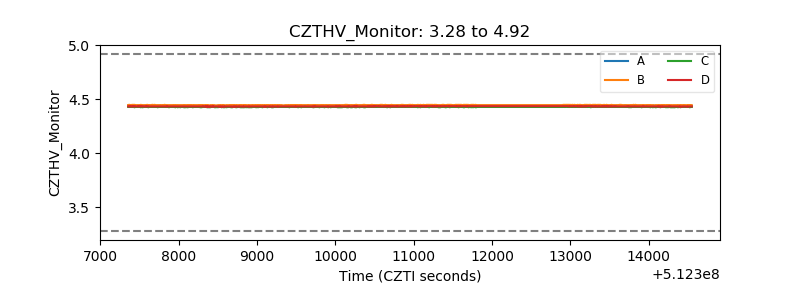 |
| D_VDD | 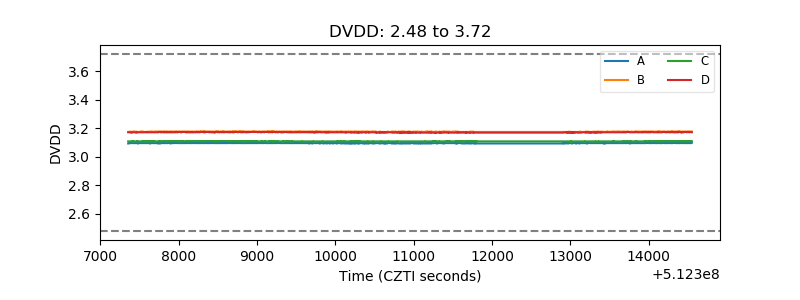 |
| Temperature 1 | 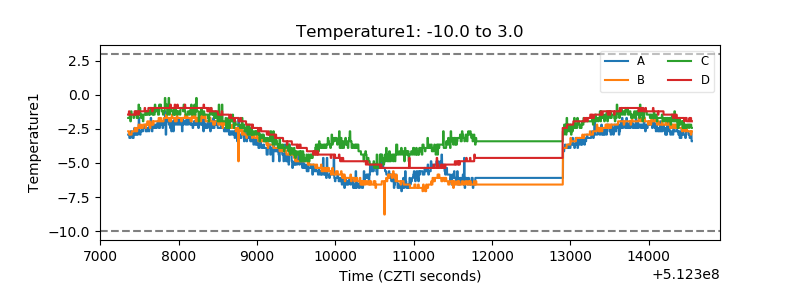 |
| Veto HV Monitor | 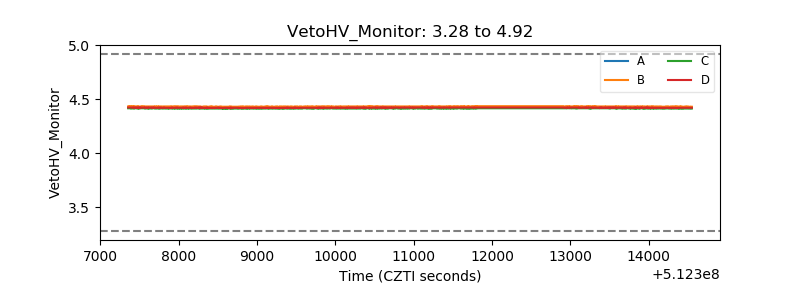 |
| Veto LLD | 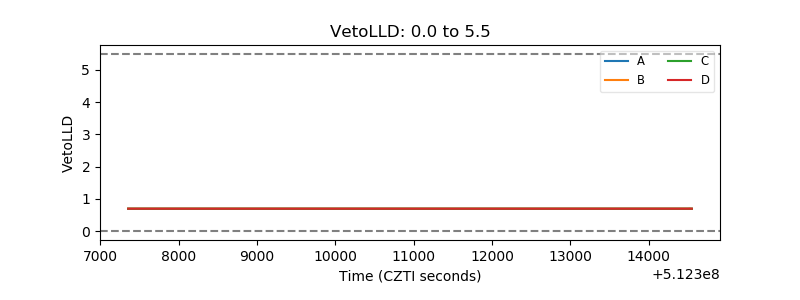 |
| Alpha Counter | 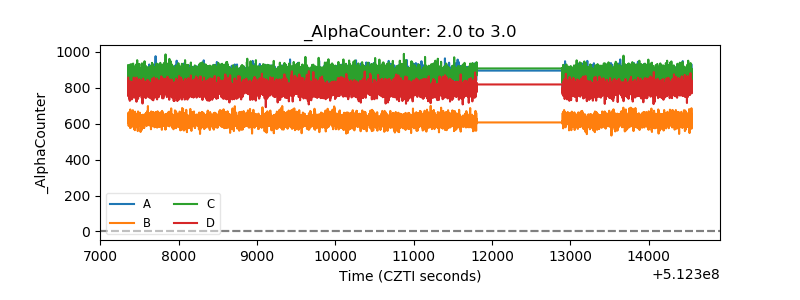 |
| _CPM_Rate | 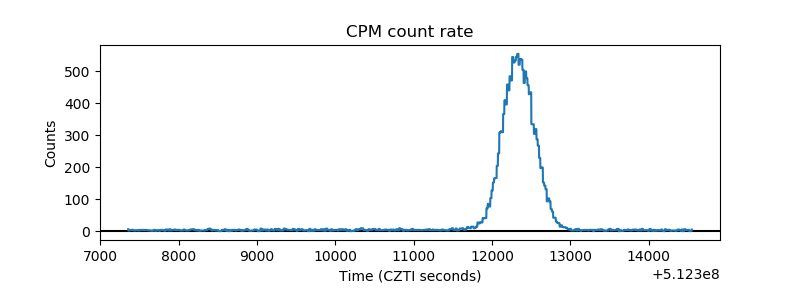 |
| CZT Counter | 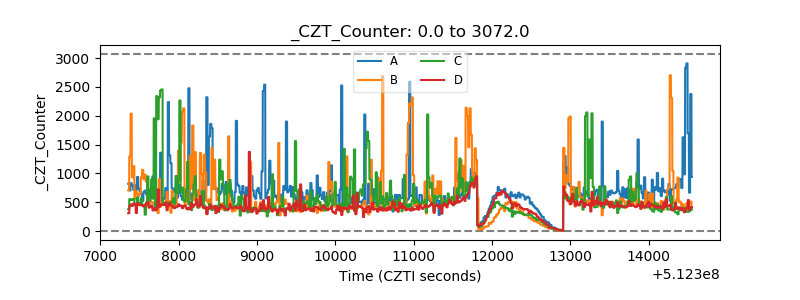 |
| +2.5 Volts monitor | 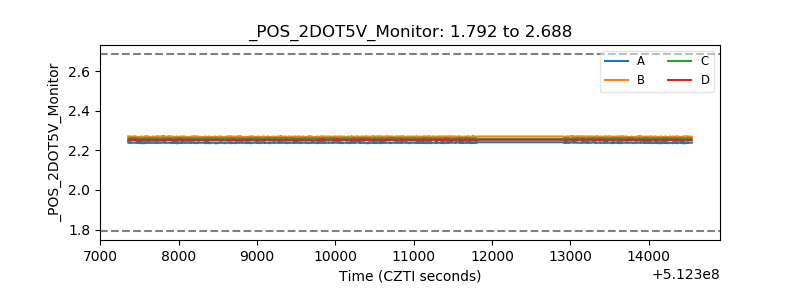 |
| +5 Volts monitor | 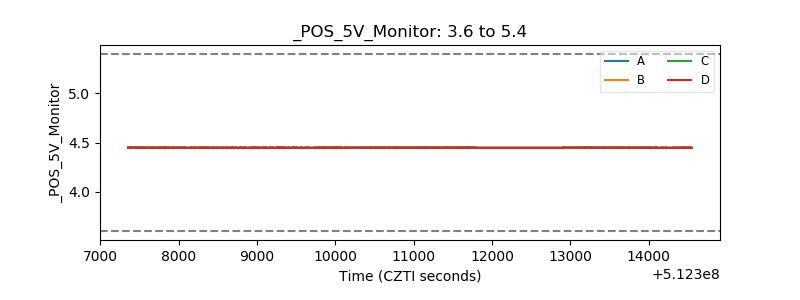 |
| _ROLL_ROT | 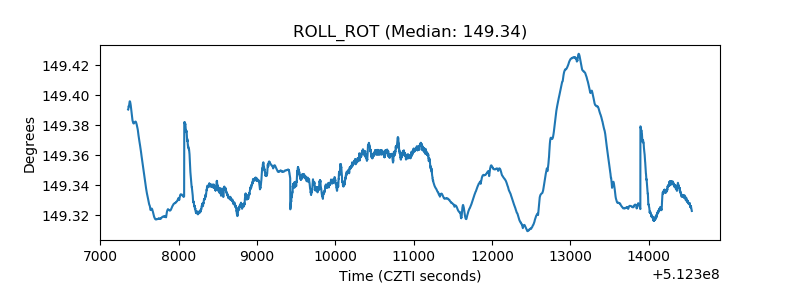 |
| _Roll_DEC | 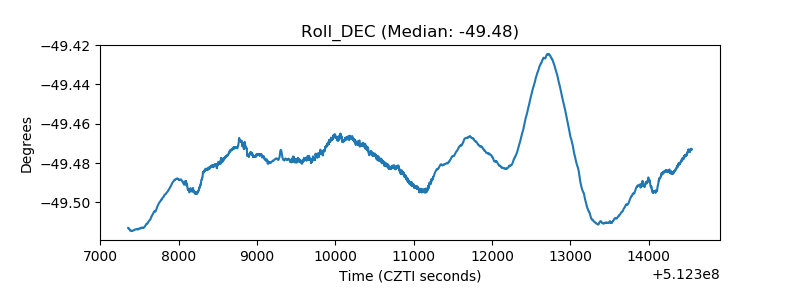 |
| _Roll_RA | 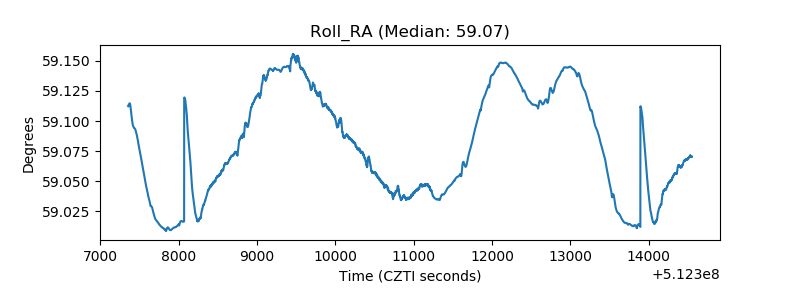 |
| Veto Counter | 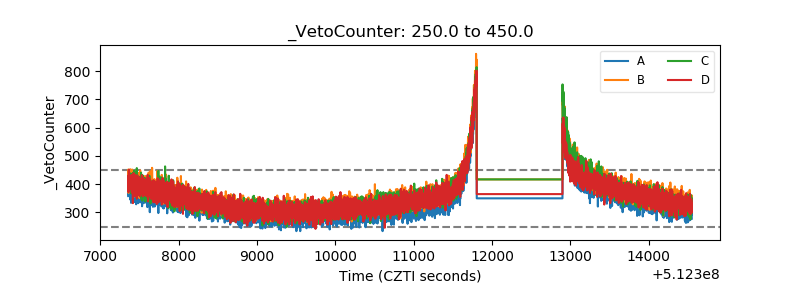 |