| Param | Original file | Final file |
|---|---|---|
| Filename | modeM0/AS1A14_083T03_9000006562_56784cztM0_level2.fits | modeM0/AS1A14_083T03_9000006562_56784cztM0_level2_quad_clean.evt |
| Size (bytes) | 422,930,880 | 84,997,440 |
| Size | 403.3 MB | 81.1 MB |
| Events in quadrant A | 5,387,359 | 516,984 |
| Events in quadrant B | 3,535,611 | 592,357 |
| Events in quadrant C | 3,041,114 | 540,011 |
| Events in quadrant D | 3,231,131 | 511,027 |
| Mode M9 | |||
|---|---|---|---|
| Quadrant | BADHDUFLAG | Total packets | Discarded packets |
| A | 0 | 11 | 0 |
| B | 0 | 11 | 0 |
| C | 0 | 11 | 0 |
| D | 0 | 11 | 0 |
| Mode SS | |||
|---|---|---|---|
| Quadrant | BADHDUFLAG | Total packets | Discarded packets |
| A | 0 | 120 | 0 |
| B | 0 | 120 | 0 |
| C | 0 | 120 | 0 |
| D | 0 | 120 | 0 |
| Mode M0 | |||
|---|---|---|---|
| Quadrant | BADHDUFLAG | Total packets | Discarded packets |
| A | 0 | 20081 | 1 |
| B | 0 | 14825 | 1 |
| C | 0 | 13520 | 1 |
| D | 0 | 14093 | 1 |
| Quadrant | Total seconds | Saturated seconds | Saturation percentage |
|---|---|---|---|
| A | 5915 | 718 | 12.138631% |
| B | 5915 | 342 | 5.781910% |
| C | 5916 | 77 | 1.301555% |
| D | 5916 | 116 | 1.960784% |
Noise dominated data is calculated using 1-second bins in cleaned event files. If a bin has >2000 counts, and if more than 50% of those come from <1% of pixels, then it is considered to be noise-dominated and hence unusable.
| Quadrant | # 1 sec bins | Bins with >0 counts | Bins with >2000 counts | High rate bins dominated by noise | Noise dominated (total time) | Noise dominated (detector-on time) | Marked lightcurve |
|---|---|---|---|---|---|---|---|
| A | 7000 | 5916 | 587 | 587 | 8.39% | 9.92% | 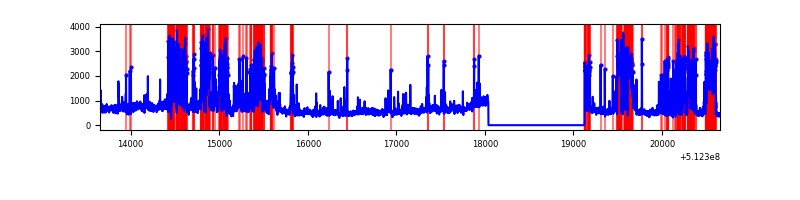 |
| B | 7000 | 5916 | 179 | 179 | 2.56% | 3.03% | 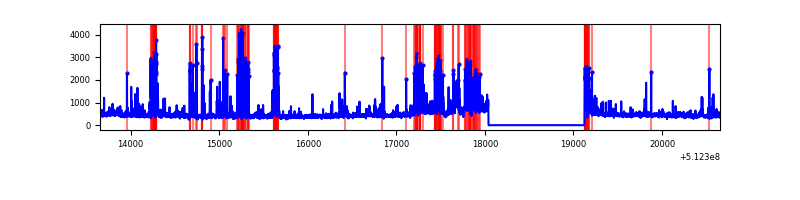 |
| C | 7001 | 5917 | 62 | 62 | 0.89% | 1.05% | 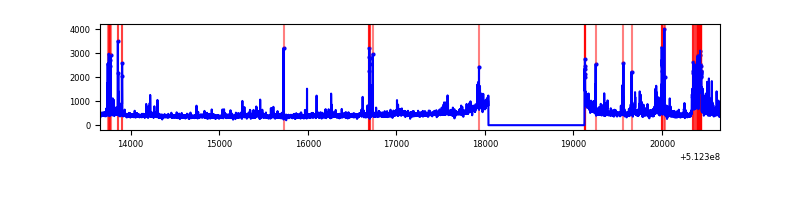 |
| D | 7001 | 5917 | 116 | 116 | 1.66% | 1.96% | 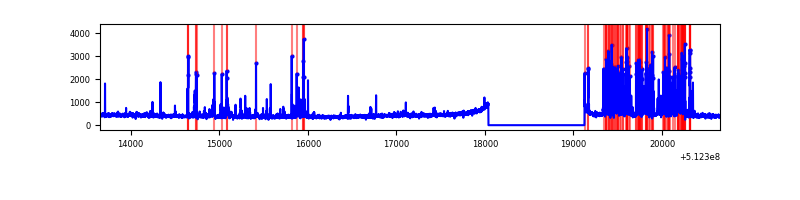 |
Top three noisy pixels from each quadrant. If the there are fewer than three noisy pixels in the level2.evt file, extra rows are filled as -1
| Pixel properties | Quadrant properties | ||||||
|---|---|---|---|---|---|---|---|
| Quadrant | DetID | PixID | Counts | Sigma | Mean | Median | Sigma |
| A | 3 | 62 | 1950793 | 12991.6 | 602 | 588 | 150.1 |
| A | 3 | 14 | 891375 | 5934.12 | 602 | 588 | 150.1 |
| A | 10 | 251 | 183652 | 1219.51 | 602 | 588 | 150.1 |
| B | 4 | 206 | 368628 | 2780.67 | 614 | 592 | 132.4 |
| B | 8 | 128 | 227376 | 1713.45 | 614 | 592 | 132.4 |
| B | 10 | 247 | 154435 | 1162.35 | 614 | 592 | 132.4 |
| C | 15 | 230 | 210555 | 1246.89 | 604 | 598 | 168.4 |
| C | 13 | 3 | 130673 | 772.49 | 604 | 598 | 168.4 |
| C | 14 | 96 | 95194 | 561.79 | 604 | 598 | 168.4 |
| D | 2 | 249 | 664626 | 3886.31 | 603 | 574 | 170.9 |
| D | 2 | 31 | 72486 | 420.86 | 603 | 574 | 170.9 |
| D | 5 | 173 | 44504 | 257.09 | 603 | 574 | 170.9 |
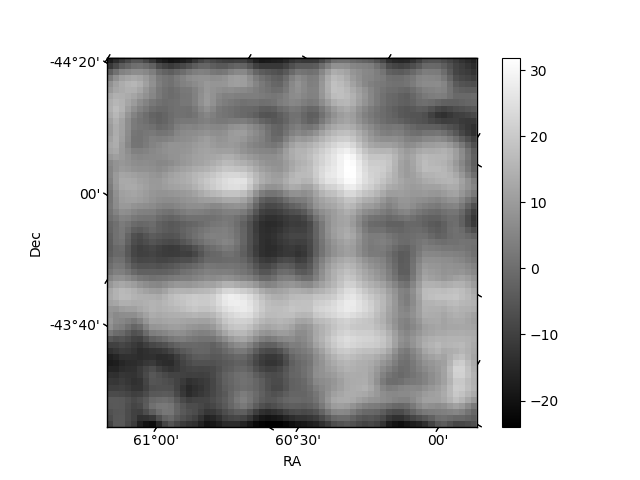
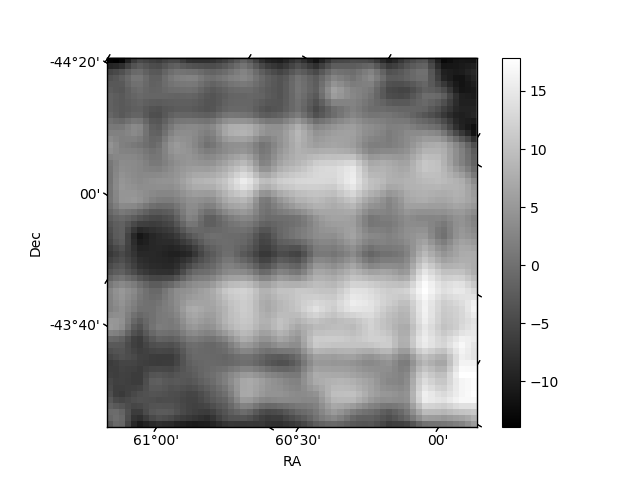
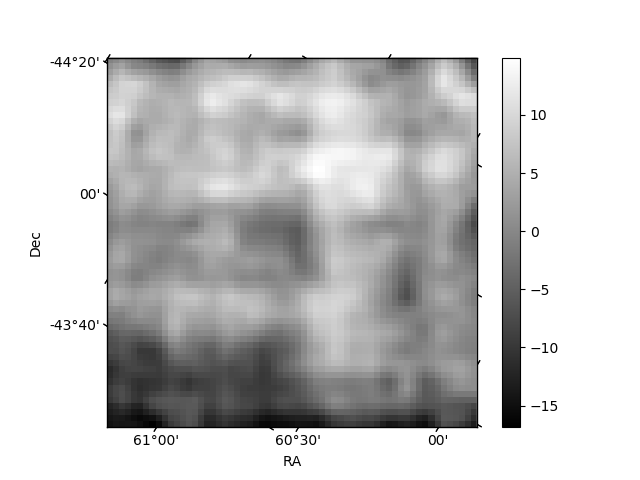
Histogram calculated using DETX and DETY for each event in the final _common_clean file
| Quadrant A | 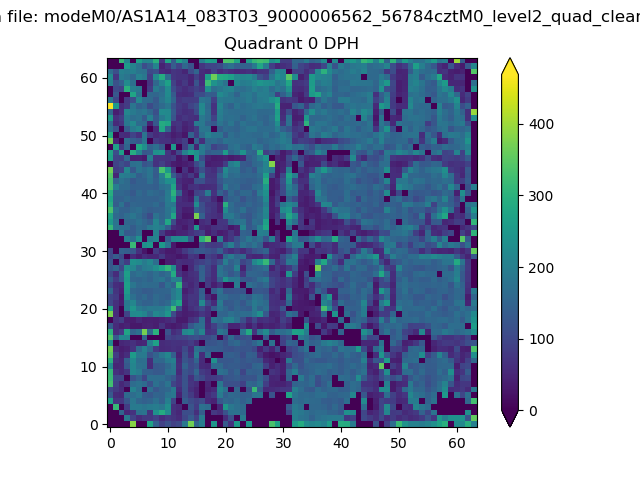 |
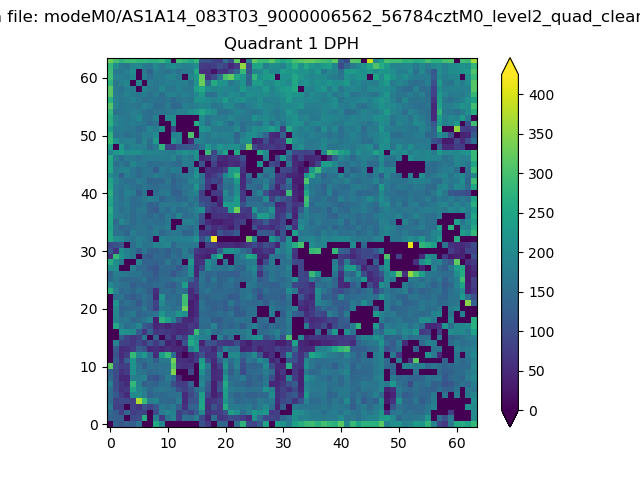 |
Quadrant B |
|---|---|---|---|
| Quadrant D | 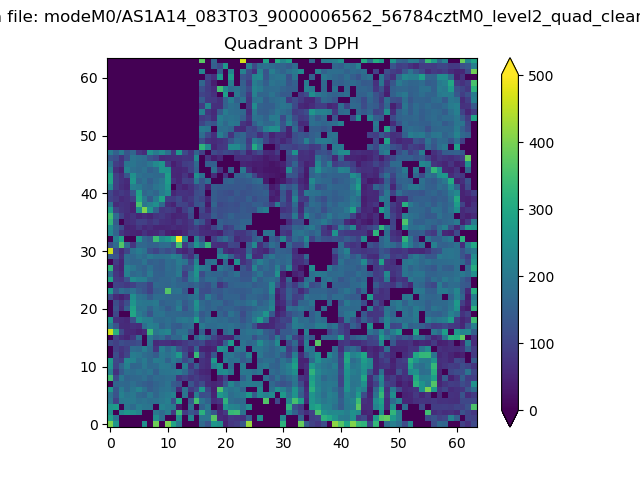 |
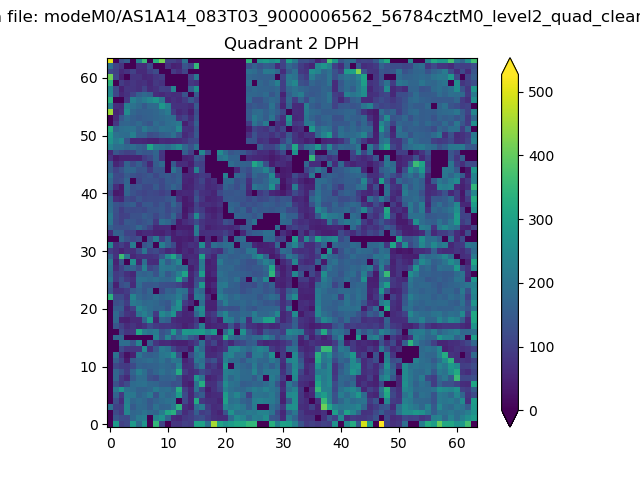 |
Quadrant C |
| Plot type | Count rate plots | Images |
|---|---|---|
| Comparison with Poisson distribution Blue bars denote a histogram of data divided into 1 sec bins. Red curve is a Poisson curve with rate = median count rate of data. |
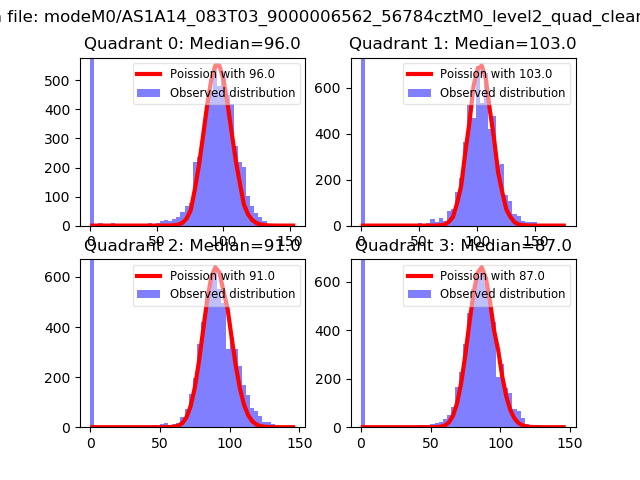 |
 |
| Quadrant-wise count rates Data is divided into 100 sec bins |
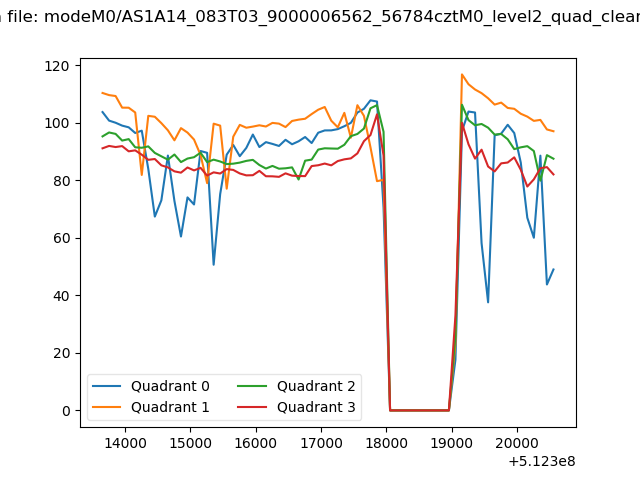 |
|
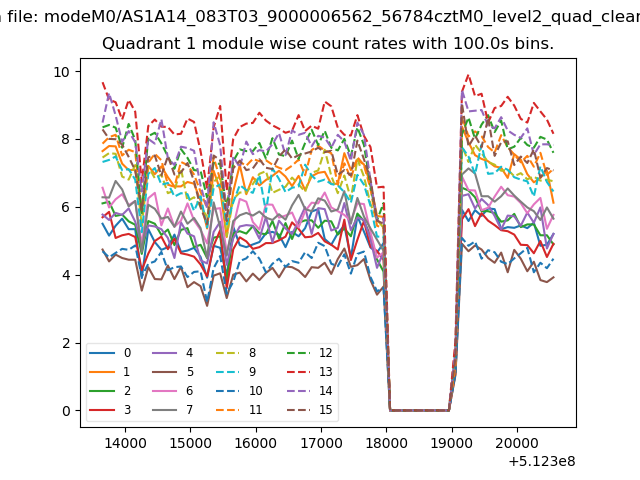
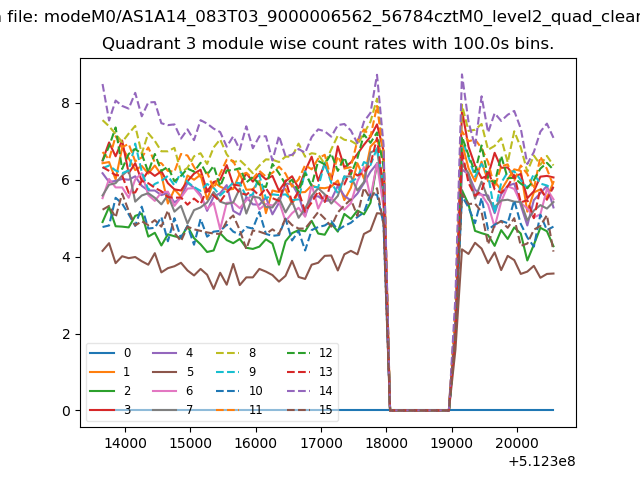
| Module-wise count rates for Quadrant A Data is divided into 100 sec bins |
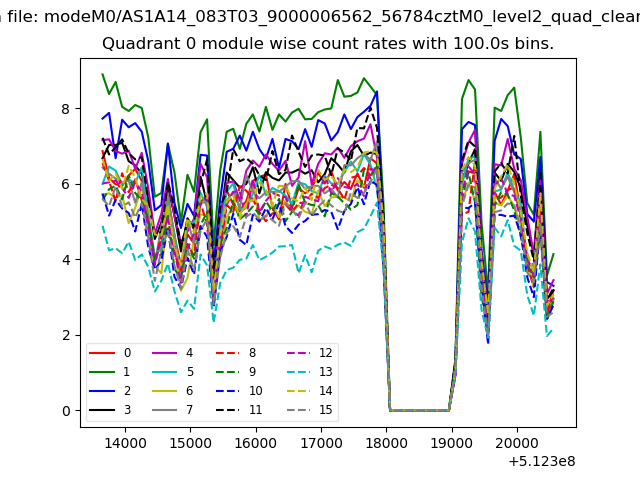 |
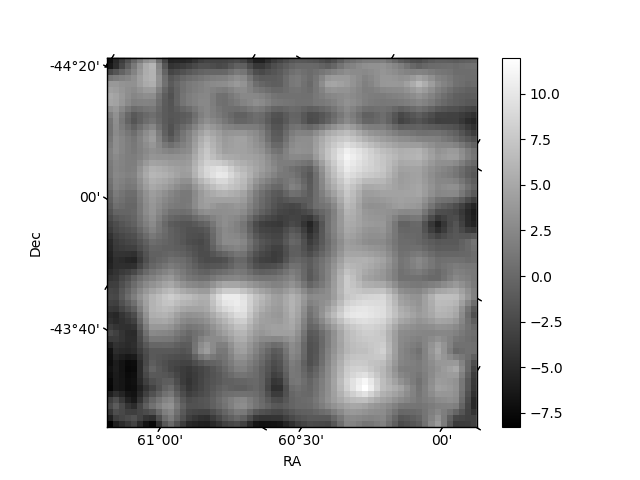 |
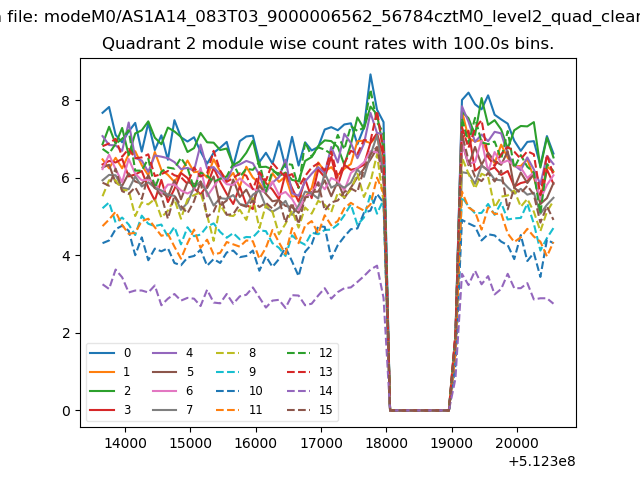
| Module-wise count rates for Quadrant B Data is divided into 100 sec bins |
 |
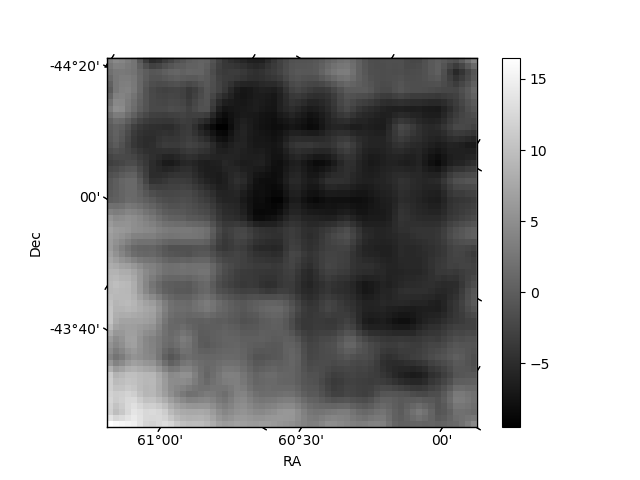 |
| Module-wise count rates for Quadrant C Data is divided into 100 sec bins |
 |
 |
| Module-wise count rates for Quadrant D Data is divided into 100 sec bins |
 |
 |
| Parameter | Plot |
|---|---|
| CZT HV Monitor | 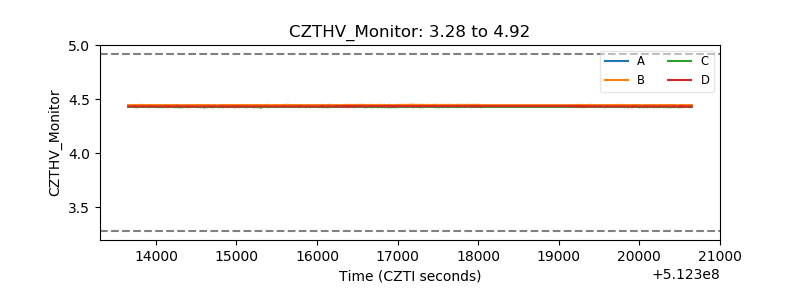 |
| D_VDD | 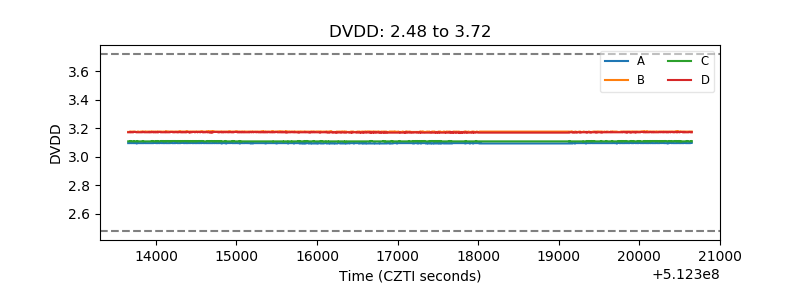 |
| Temperature 1 | 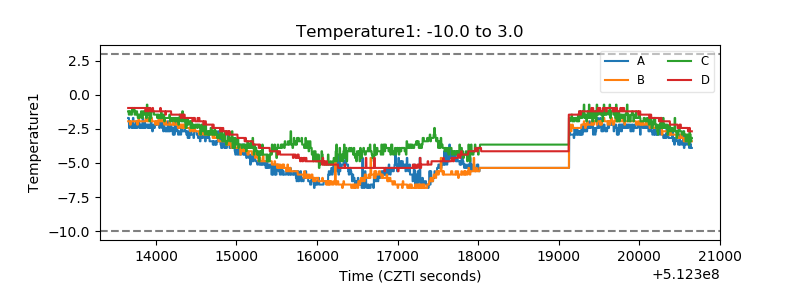 |
| Veto HV Monitor |  |
| Veto LLD | 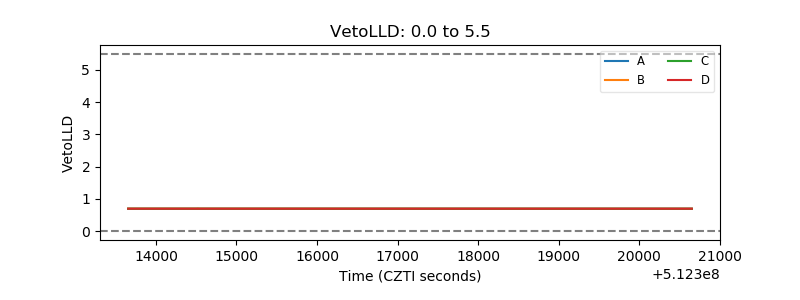 |
| Alpha Counter | 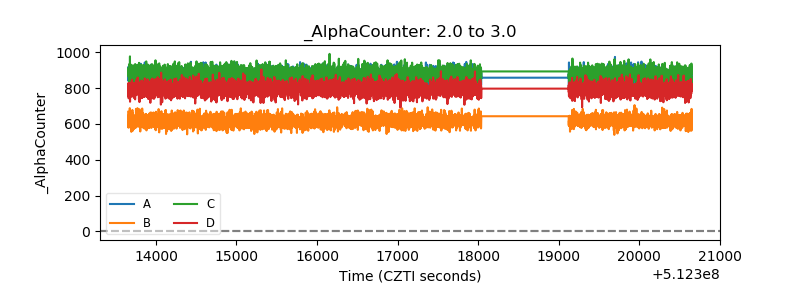 |
| _CPM_Rate | 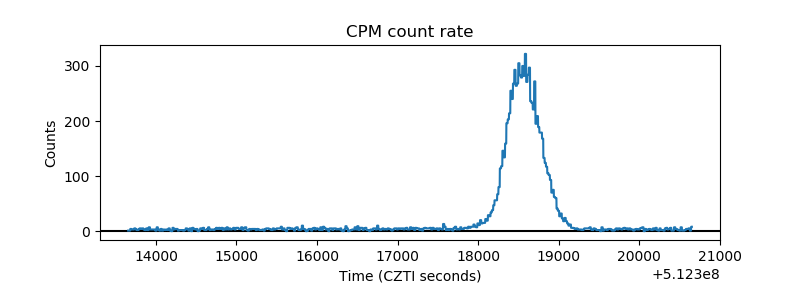 |
| CZT Counter | 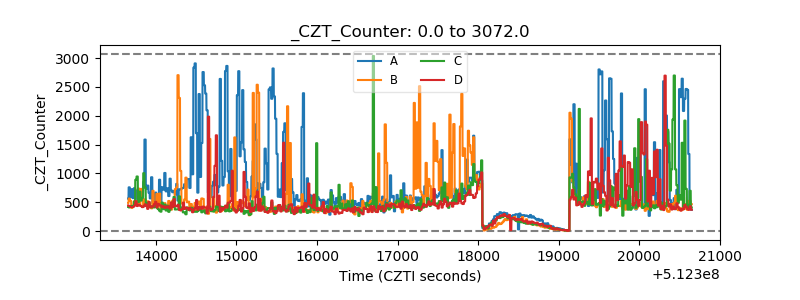 |
| +2.5 Volts monitor |  |
| +5 Volts monitor |  |
| _ROLL_ROT | 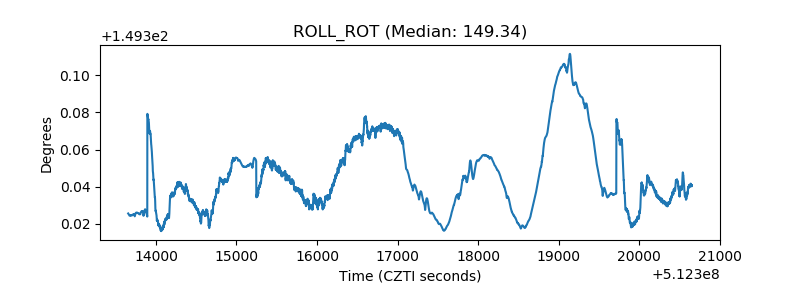 |
| _Roll_DEC | 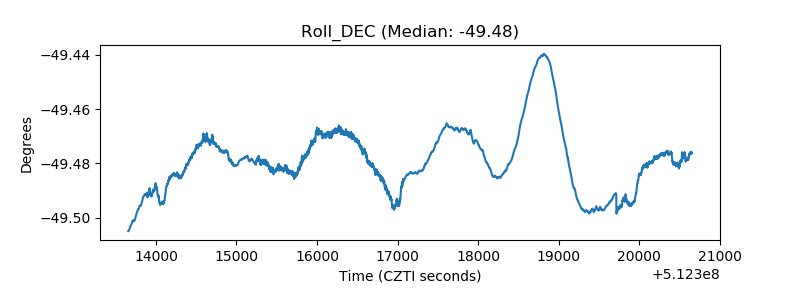 |
| _Roll_RA | 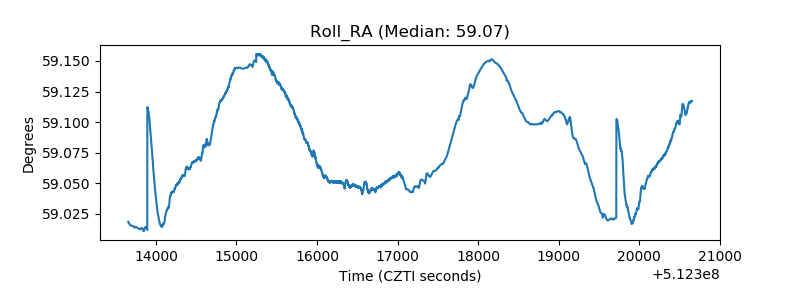 |
| Veto Counter | 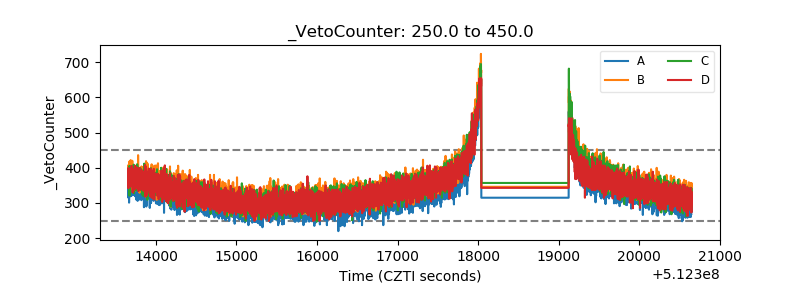 |