| Param | Original file | Final file |
|---|---|---|
| Filename | modeM0/AS1A14_083T03_9000006562_56786cztM0_level2.fits | modeM0/AS1A14_083T03_9000006562_56786cztM0_level2_quad_clean.evt |
| Size (bytes) | 495,544,320 | 100,929,600 |
| Size | 472.6 MB | 96.3 MB |
| Events in quadrant A | 5,455,022 | 645,686 |
| Events in quadrant B | 4,071,195 | 696,651 |
| Events in quadrant C | 4,817,853 | 621,301 |
| Events in quadrant D | 3,450,384 | 600,276 |
| Mode M9 | |||
|---|---|---|---|
| Quadrant | BADHDUFLAG | Total packets | Discarded packets |
| A | 0 | 6 | 0 |
| B | 0 | 7 | 0 |
| C | 0 | 7 | 0 |
| D | 0 | 7 | 0 |
| Mode SS | |||
|---|---|---|---|
| Quadrant | BADHDUFLAG | Total packets | Discarded packets |
| A | 0 | 142 | 0 |
| B | 0 | 142 | 0 |
| C | 0 | 142 | 0 |
| D | 0 | 142 | 0 |
| Mode M0 | |||
|---|---|---|---|
| Quadrant | BADHDUFLAG | Total packets | Discarded packets |
| A | 0 | 21035 | 2 |
| B | 0 | 17214 | 2 |
| C | 0 | 19363 | 2 |
| D | 0 | 15633 | 2 |
| Quadrant | Total seconds | Saturated seconds | Saturation percentage |
|---|---|---|---|
| A | 7072 | 301 | 4.256222% |
| B | 7072 | 291 | 4.114819% |
| C | 7072 | 192 | 2.714932% |
| D | 7072 | 54 | 0.763575% |
Noise dominated data is calculated using 1-second bins in cleaned event files. If a bin has >2000 counts, and if more than 50% of those come from <1% of pixels, then it is considered to be noise-dominated and hence unusable.
| Quadrant | # 1 sec bins | Bins with >0 counts | Bins with >2000 counts | High rate bins dominated by noise | Noise dominated (total time) | Noise dominated (detector-on time) | Marked lightcurve |
|---|---|---|---|---|---|---|---|
| A | 7607 | 7073 | 177 | 177 | 2.33% | 2.50% | 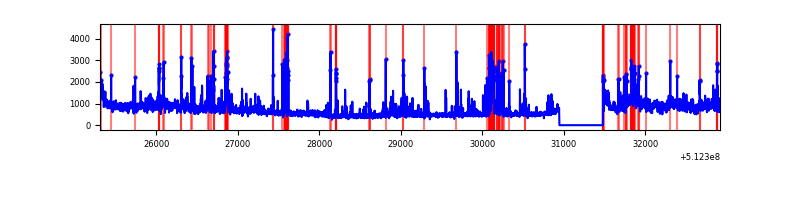 |
| B | 7607 | 7073 | 201 | 201 | 2.64% | 2.84% | 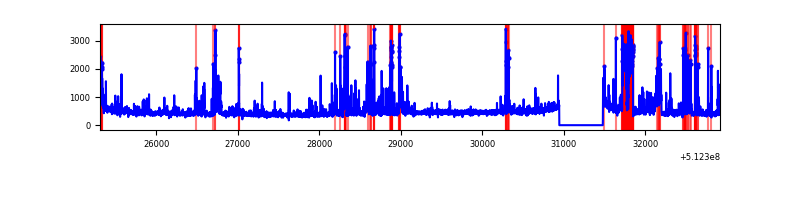 |
| C | 7607 | 7073 | 158 | 158 | 2.08% | 2.23% | 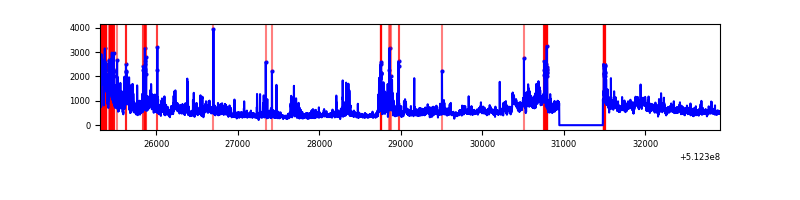 |
| D | 7607 | 7073 | 50 | 50 | 0.66% | 0.71% | 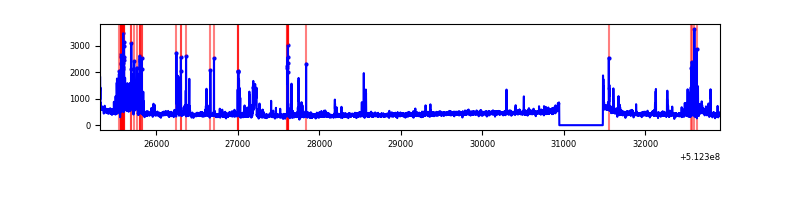 |
Top three noisy pixels from each quadrant. If the there are fewer than three noisy pixels in the level2.evt file, extra rows are filled as -1
| Pixel properties | Quadrant properties | ||||||
|---|---|---|---|---|---|---|---|
| Quadrant | DetID | PixID | Counts | Sigma | Mean | Median | Sigma |
| A | 3 | 14 | 1682247 | 9179.59 | 739 | 719 | 183.2 |
| A | 10 | 251 | 610151 | 3326.94 | 739 | 719 | 183.2 |
| A | 3 | 62 | 222864 | 1212.71 | 739 | 719 | 183.2 |
| B | 8 | 128 | 563416 | 3577.16 | 731 | 704 | 157.3 |
| B | 15 | 69 | 159636 | 1010.33 | 731 | 704 | 157.3 |
| B | 2 | 249 | 112693 | 711.91 | 731 | 704 | 157.3 |
| C | 9 | 38 | 821477 | 4194.68 | 713 | 702 | 195.7 |
| C | 15 | 230 | 585939 | 2990.94 | 713 | 702 | 195.7 |
| C | 1 | 28 | 178134 | 906.79 | 713 | 702 | 195.7 |
| D | 2 | 249 | 355640 | 1751.68 | 720 | 687 | 202.6 |
| D | 5 | 173 | 53430 | 260.28 | 720 | 687 | 202.6 |
| D | 8 | 160 | 45357 | 220.44 | 720 | 687 | 202.6 |
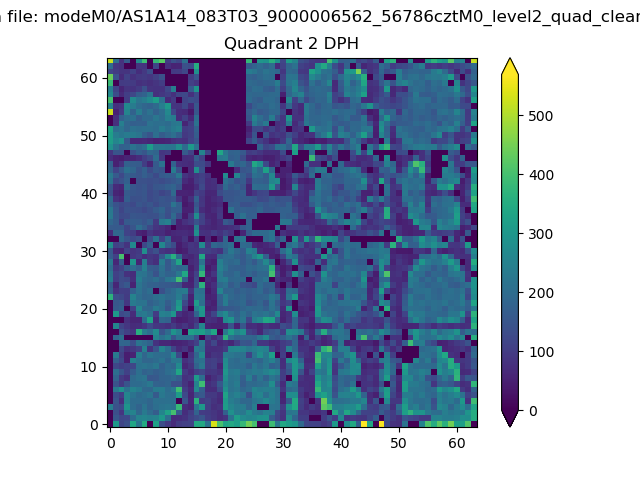
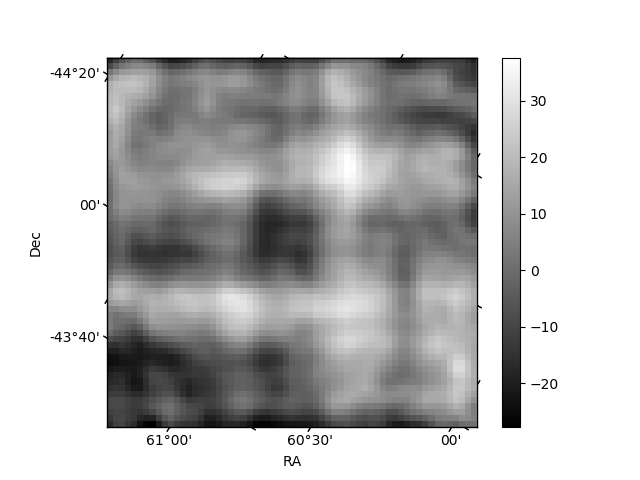
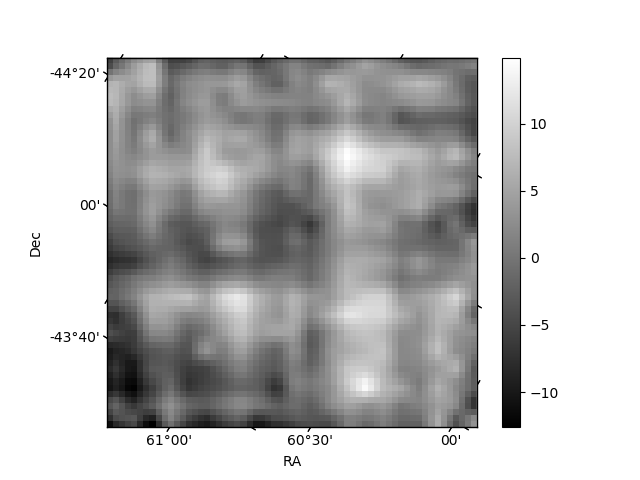
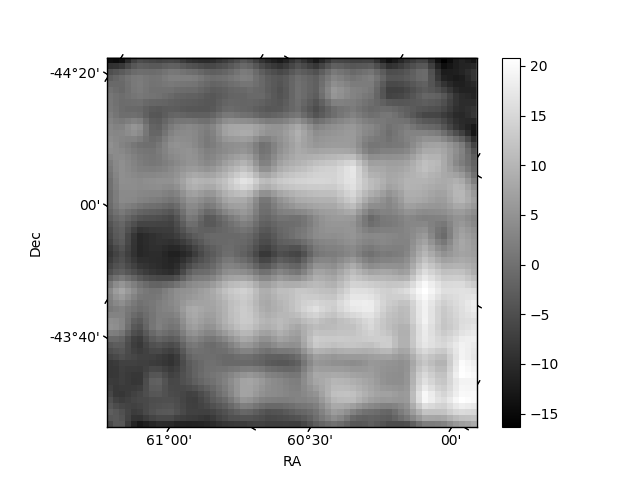
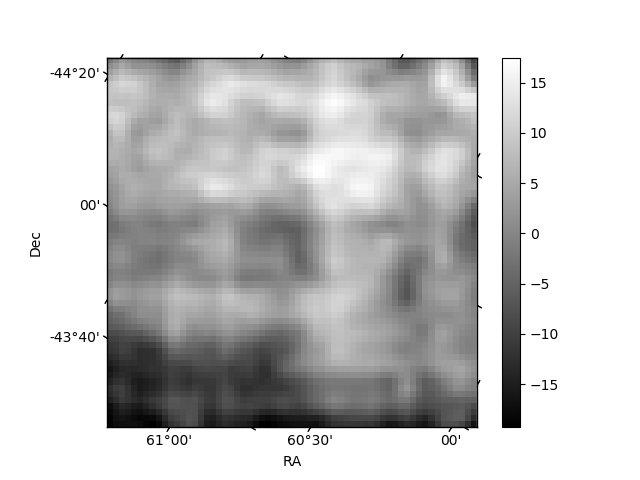
Histogram calculated using DETX and DETY for each event in the final _common_clean file
| Quadrant A | 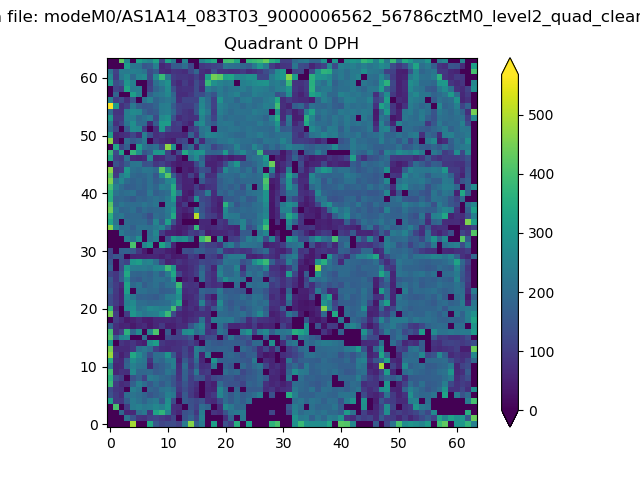 |
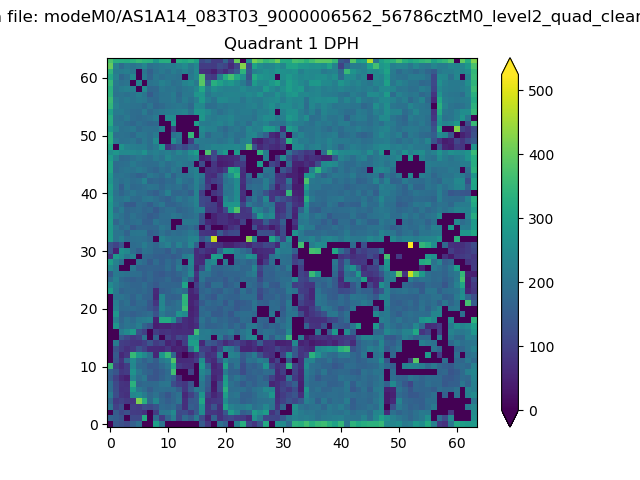 |
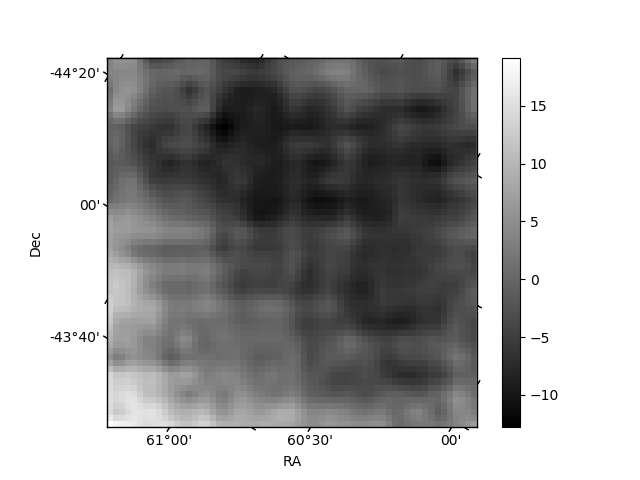
Quadrant B |
|---|---|---|---|
| Quadrant D | 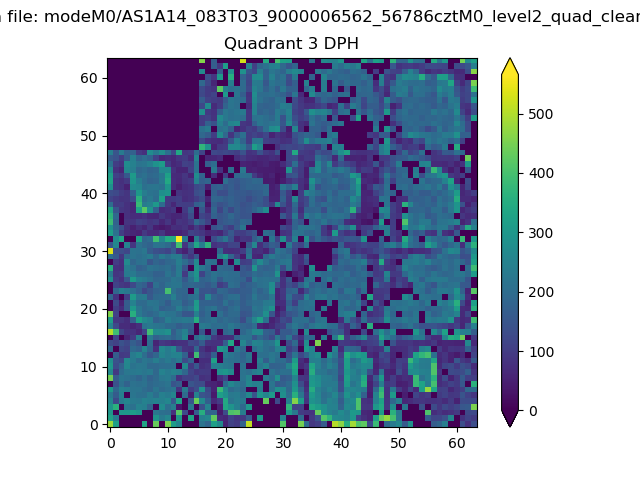 |
 |
Quadrant C |
| Plot type | Count rate plots | Images |
|---|---|---|
| Comparison with Poisson distribution Blue bars denote a histogram of data divided into 1 sec bins. Red curve is a Poisson curve with rate = median count rate of data. |
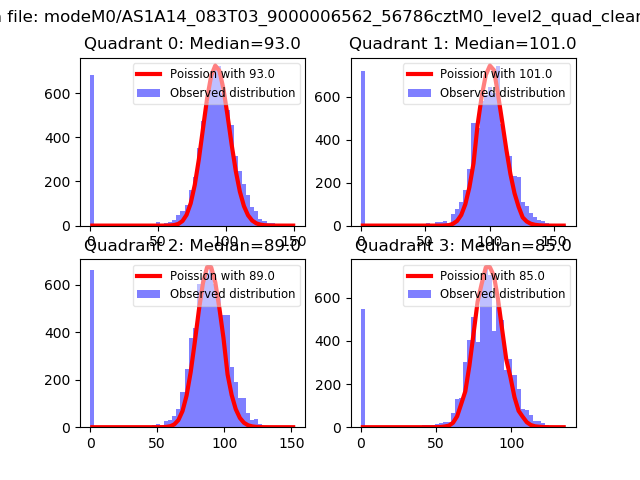 |
 |
| Quadrant-wise count rates Data is divided into 100 sec bins |
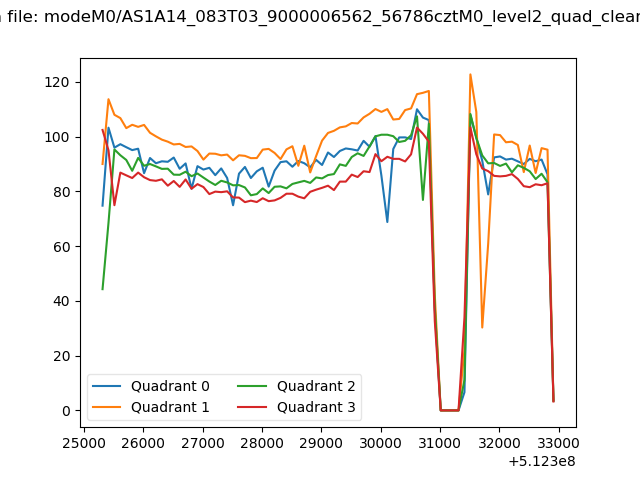 |
|
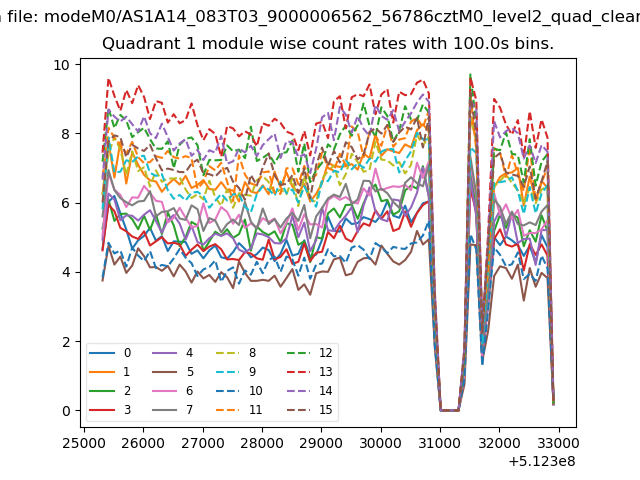
| Module-wise count rates for Quadrant A Data is divided into 100 sec bins |
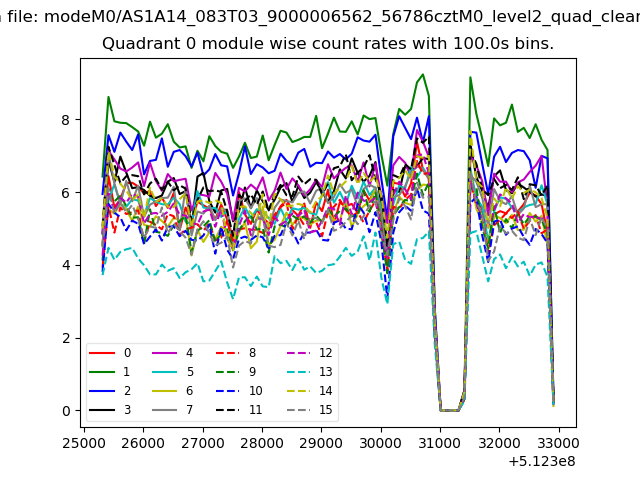 |
 |
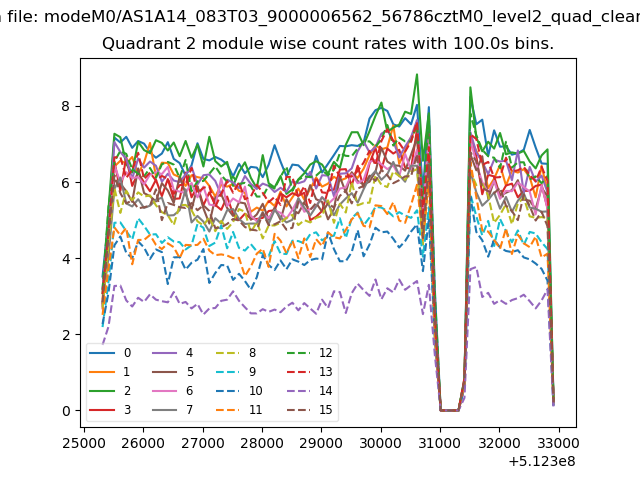
| Module-wise count rates for Quadrant B Data is divided into 100 sec bins |
 |
 |
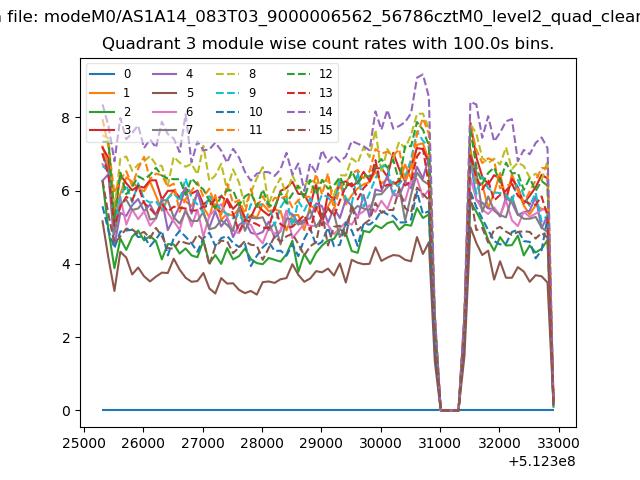
| Module-wise count rates for Quadrant C Data is divided into 100 sec bins |
 |
 |
| Module-wise count rates for Quadrant D Data is divided into 100 sec bins |
 |
 |
| Parameter | Plot |
|---|---|
| CZT HV Monitor | 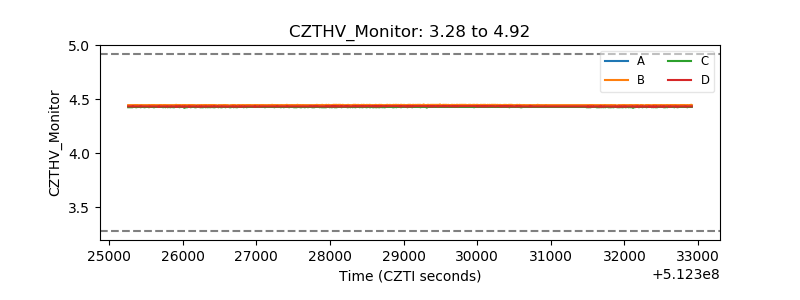 |
| D_VDD | 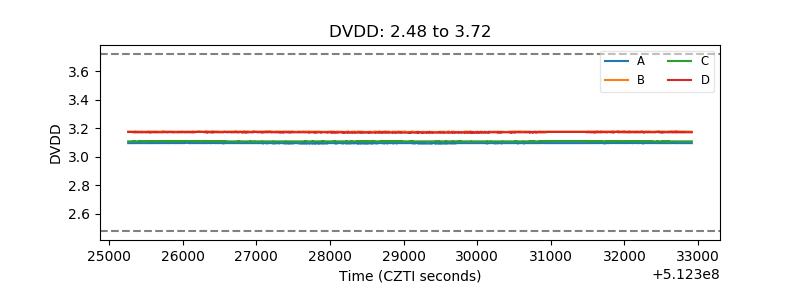 |
| Temperature 1 | 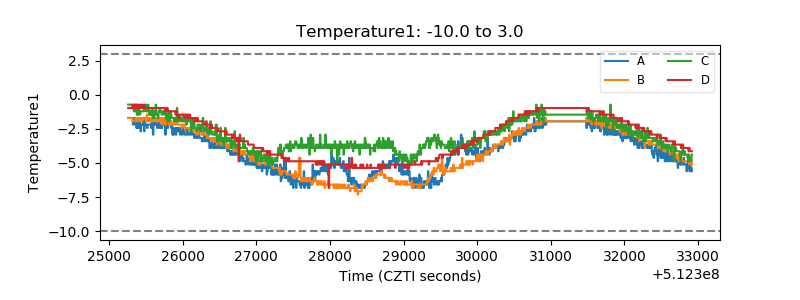 |
| Veto HV Monitor | 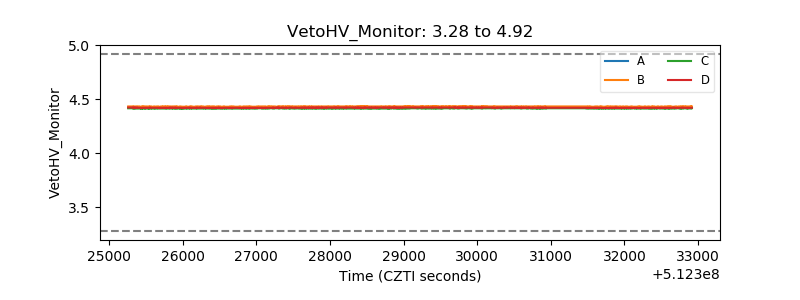 |
| Veto LLD | 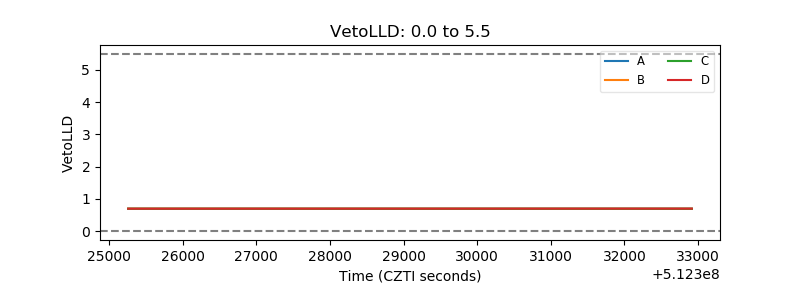 |
| Alpha Counter | 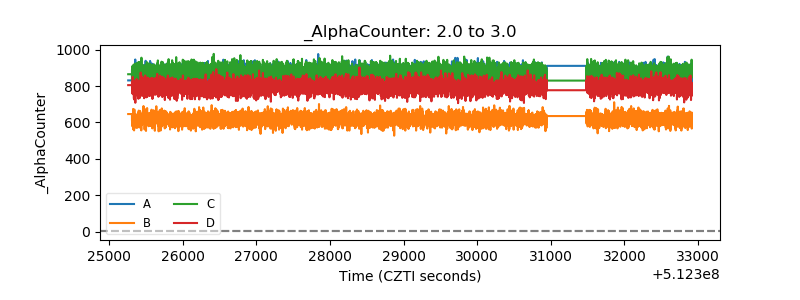 |
| _CPM_Rate | 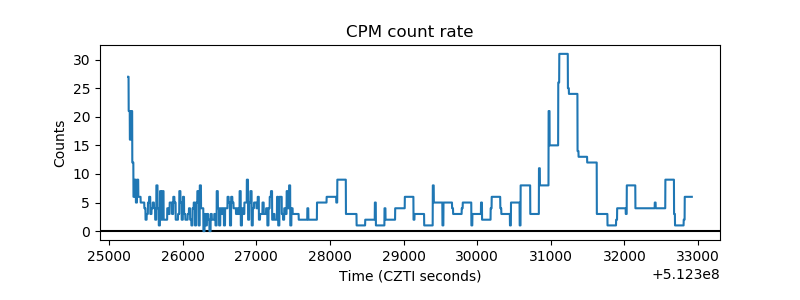 |
| CZT Counter | 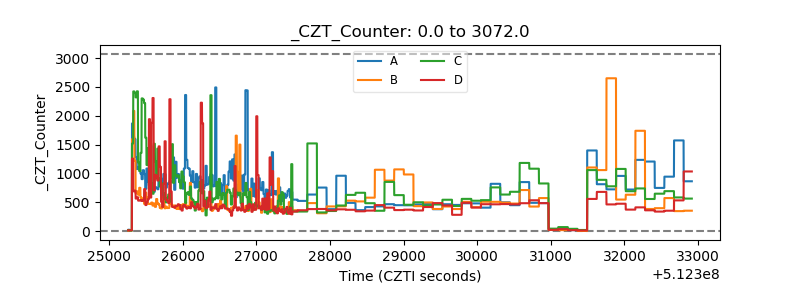 |
| +2.5 Volts monitor |  |
| +5 Volts monitor |  |
| _ROLL_ROT | 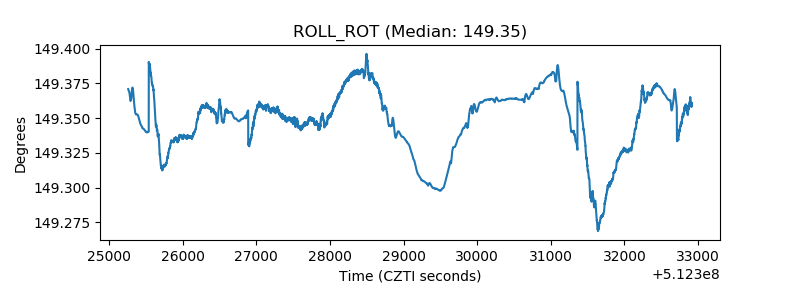 |
| _Roll_DEC | 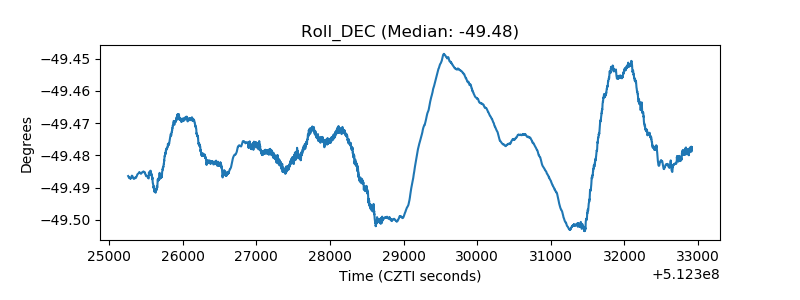 |
| _Roll_RA | 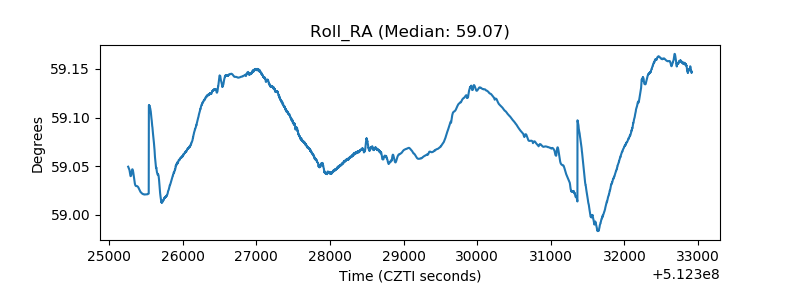 |
| Veto Counter | 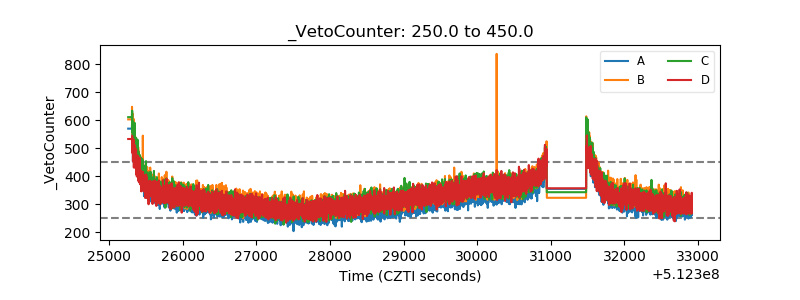 |