| Param | Original file | Final file |
|---|---|---|
| Filename | modeM0/AS1A14_083T03_9000006562_56787cztM0_level2.fits | modeM0/AS1A14_083T03_9000006562_56787cztM0_level2_quad_clean.evt |
| Size (bytes) | 525,237,120 | 110,027,520 |
| Size | 500.9 MB | 104.9 MB |
| Events in quadrant A | 5,099,715 | 714,764 |
| Events in quadrant B | 4,596,302 | 756,010 |
| Events in quadrant C | 5,468,620 | 675,595 |
| Events in quadrant D | 3,680,133 | 649,712 |
| Mode M9 | |||
|---|---|---|---|
| Quadrant | BADHDUFLAG | Total packets | Discarded packets |
| A | 0 | 2 | 0 |
| B | 0 | 3 | 0 |
| C | 0 | 3 | 0 |
| D | 0 | 3 | 0 |
| Mode SS | |||
|---|---|---|---|
| Quadrant | BADHDUFLAG | Total packets | Discarded packets |
| A | 0 | 154 | 0 |
| B | 0 | 154 | 0 |
| C | 0 | 154 | 0 |
| D | 0 | 154 | 0 |
| Mode M0 | |||
|---|---|---|---|
| Quadrant | BADHDUFLAG | Total packets | Discarded packets |
| A | 0 | 20279 | 2 |
| B | 0 | 19258 | 2 |
| C | 0 | 21906 | 2 |
| D | 0 | 16872 | 2 |
| Quadrant | Total seconds | Saturated seconds | Saturation percentage |
|---|---|---|---|
| A | 7703 | 196 | 2.544463% |
| B | 7703 | 327 | 4.245099% |
| C | 7703 | 184 | 2.388680% |
| D | 7703 | 70 | 0.908737% |
Noise dominated data is calculated using 1-second bins in cleaned event files. If a bin has >2000 counts, and if more than 50% of those come from <1% of pixels, then it is considered to be noise-dominated and hence unusable.
| Quadrant | # 1 sec bins | Bins with >0 counts | Bins with >2000 counts | High rate bins dominated by noise | Noise dominated (total time) | Noise dominated (detector-on time) | Marked lightcurve |
|---|---|---|---|---|---|---|---|
| A | 7718 | 7704 | 102 | 102 | 1.32% | 1.32% | 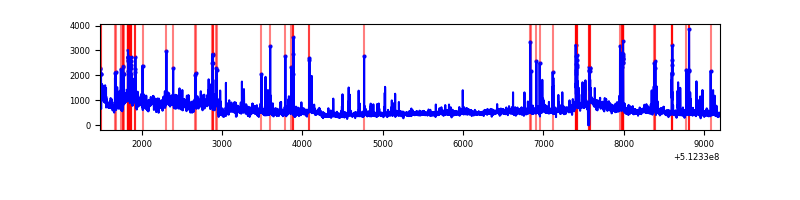 |
| B | 7718 | 7704 | 210 | 210 | 2.72% | 2.73% | 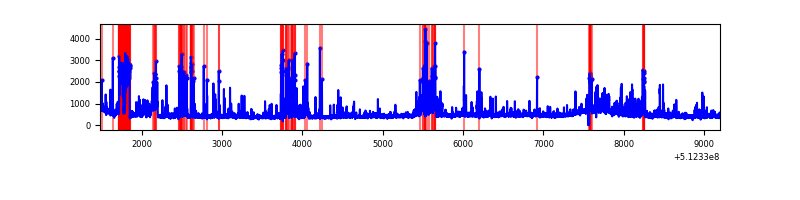 |
| C | 7718 | 7704 | 132 | 132 | 1.71% | 1.71% | 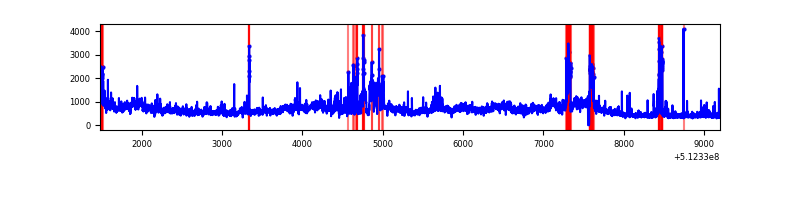 |
| D | 7718 | 7704 | 51 | 51 | 0.66% | 0.66% | 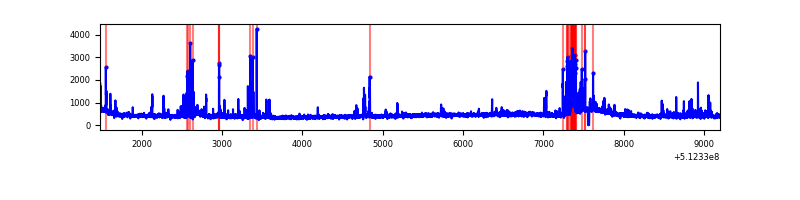 |
Top three noisy pixels from each quadrant. If the there are fewer than three noisy pixels in the level2.evt file, extra rows are filled as -1
| Pixel properties | Quadrant properties | ||||||
|---|---|---|---|---|---|---|---|
| Quadrant | DetID | PixID | Counts | Sigma | Mean | Median | Sigma |
| A | 3 | 14 | 1346922 | 6632.69 | 822 | 802 | 203.0 |
| A | 10 | 251 | 390639 | 1920.83 | 822 | 802 | 203.0 |
| A | 3 | 62 | 81064 | 395.47 | 822 | 802 | 203.0 |
| B | 8 | 128 | 523806 | 2984.92 | 809 | 780 | 175.2 |
| B | 2 | 249 | 207822 | 1181.59 | 809 | 780 | 175.2 |
| B | 5 | 185 | 178724 | 1015.53 | 809 | 780 | 175.2 |
| C | 9 | 38 | 1579512 | 7352.1 | 786 | 775 | 214.7 |
| C | 15 | 230 | 245117 | 1137.89 | 786 | 775 | 214.7 |
| C | 12 | 252 | 162750 | 754.31 | 786 | 775 | 214.7 |
| D | 2 | 249 | 233073 | 1044.17 | 794 | 760 | 222.5 |
| D | 2 | 31 | 83678 | 372.69 | 794 | 760 | 222.5 |
| D | 5 | 32 | 69200 | 307.62 | 794 | 760 | 222.5 |
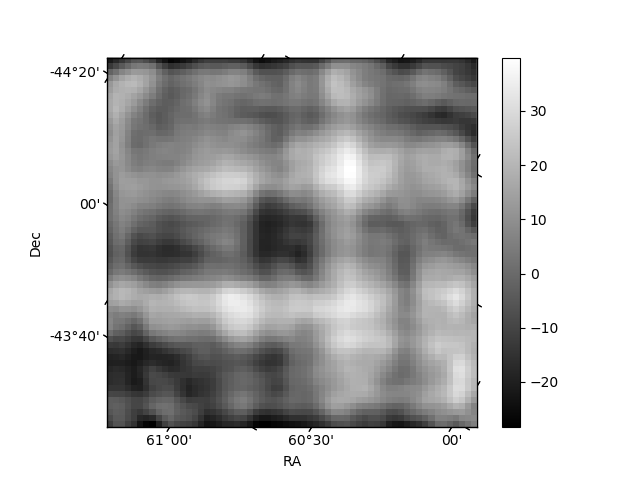
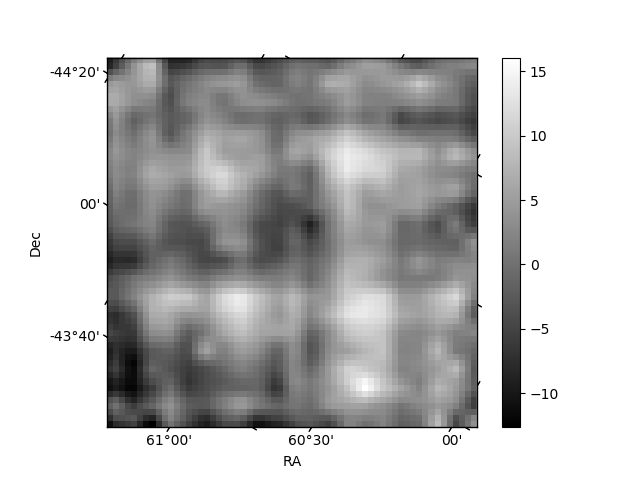
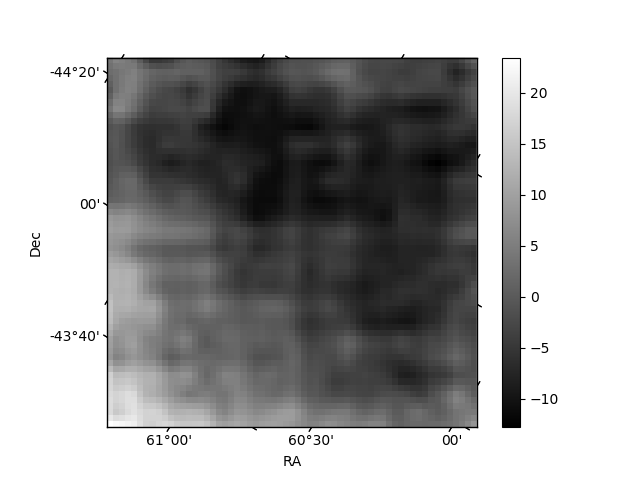
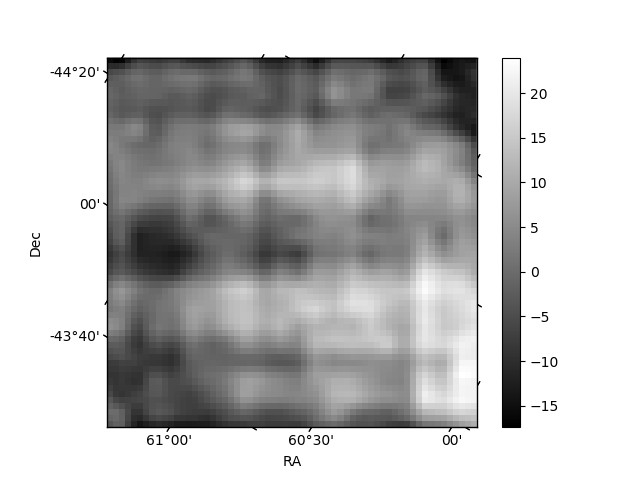
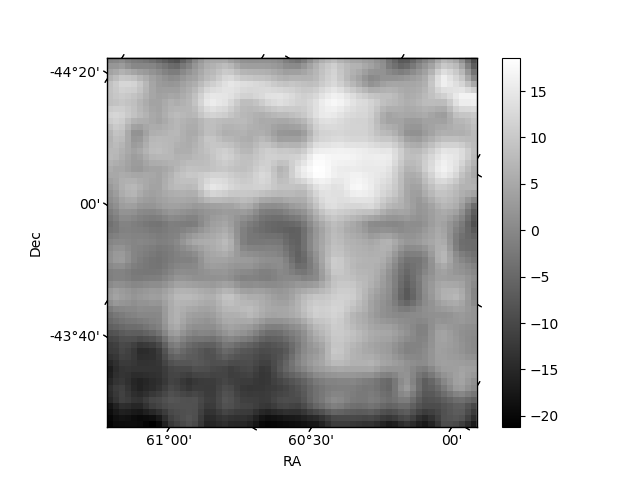
Histogram calculated using DETX and DETY for each event in the final _common_clean file
| Quadrant A | 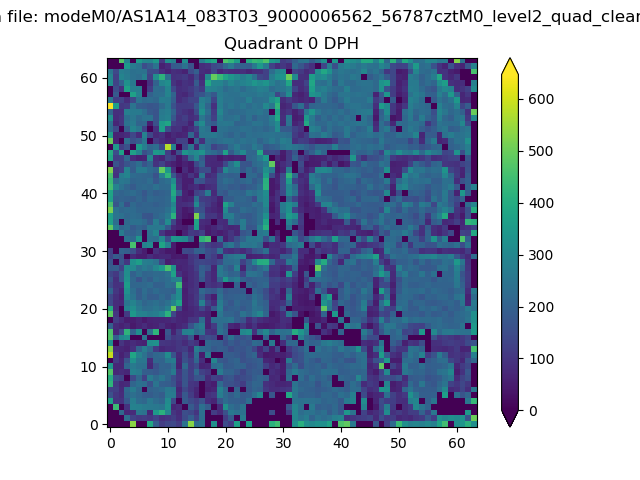 |
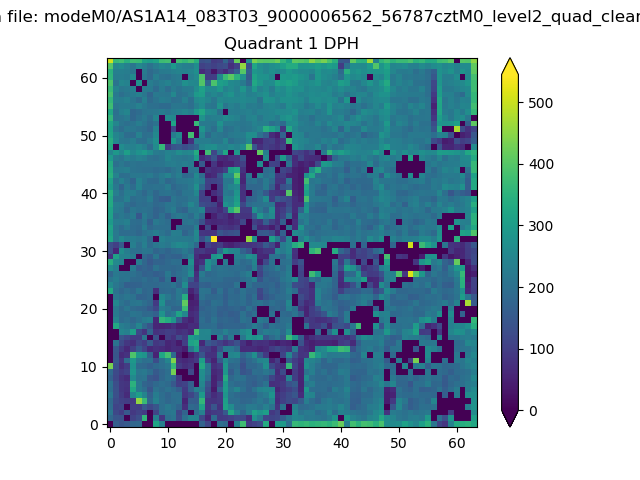 |
Quadrant B |
|---|---|---|---|
| Quadrant D | 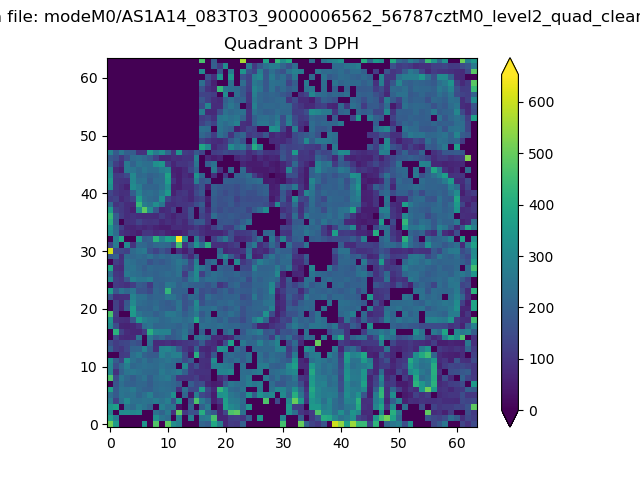 |
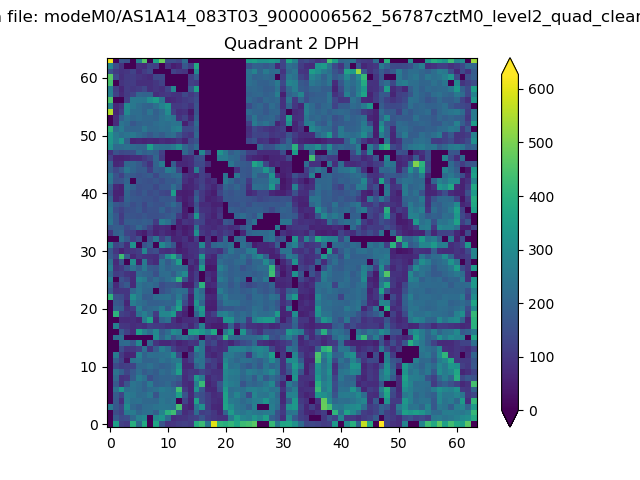 |
Quadrant C |
| Plot type | Count rate plots | Images |
|---|---|---|
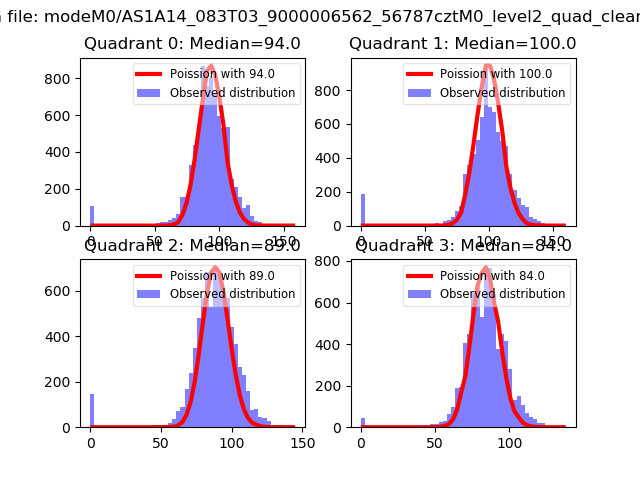
| Comparison with Poisson distribution Blue bars denote a histogram of data divided into 1 sec bins. Red curve is a Poisson curve with rate = median count rate of data. |
 |
 |
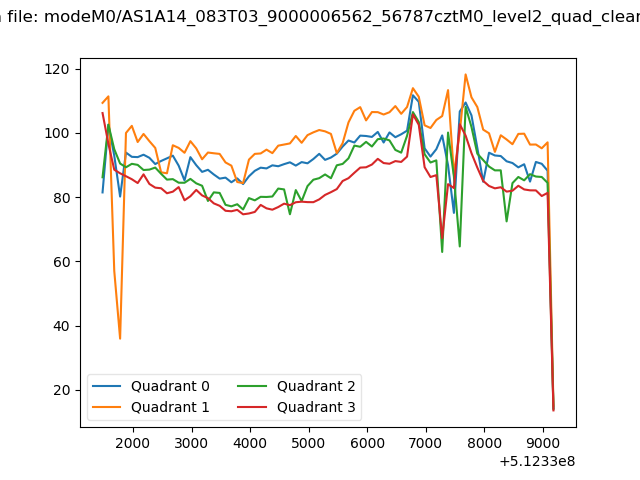
| Quadrant-wise count rates Data is divided into 100 sec bins |
 |
|
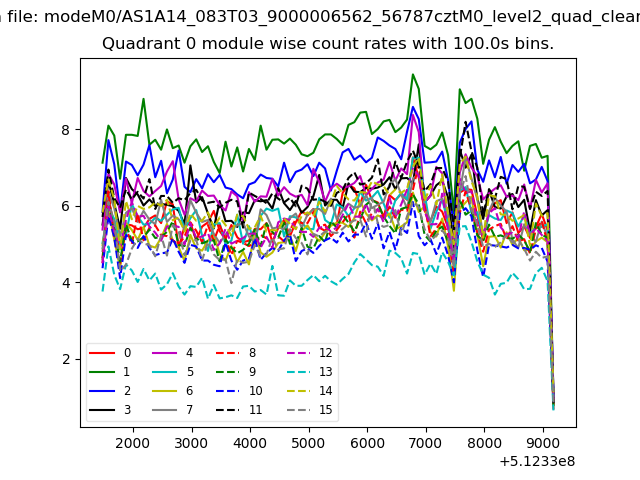
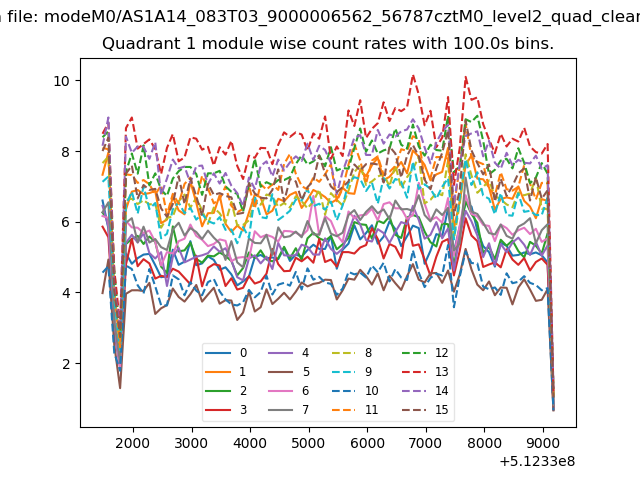
| Module-wise count rates for Quadrant A Data is divided into 100 sec bins |
 |
 |
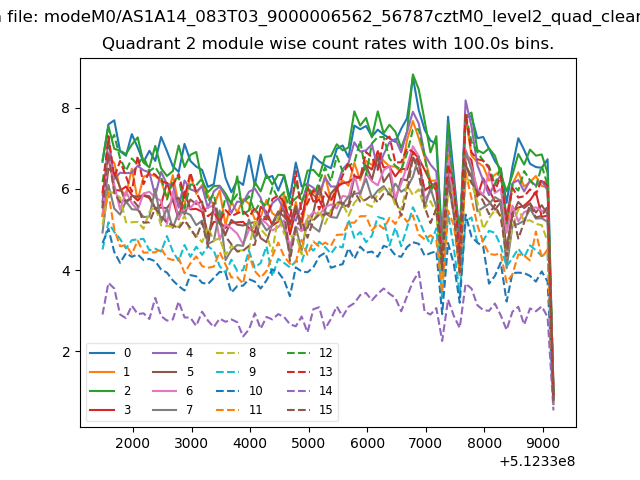
| Module-wise count rates for Quadrant B Data is divided into 100 sec bins |
 |
 |
| Module-wise count rates for Quadrant C Data is divided into 100 sec bins |
 |
 |
| Module-wise count rates for Quadrant D Data is divided into 100 sec bins |
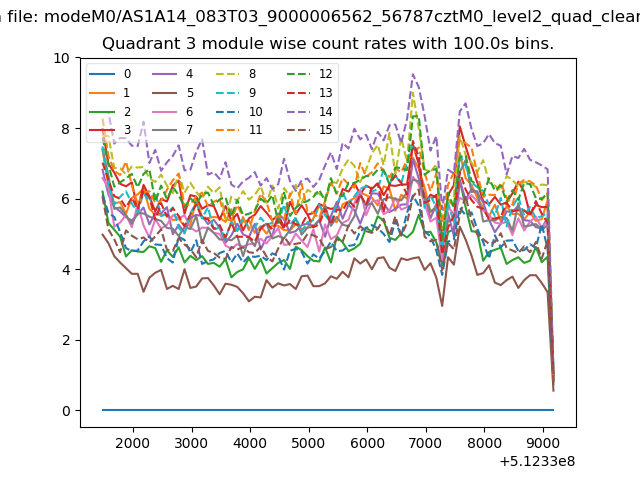 |
 |
| Parameter | Plot |
|---|---|
| CZT HV Monitor | 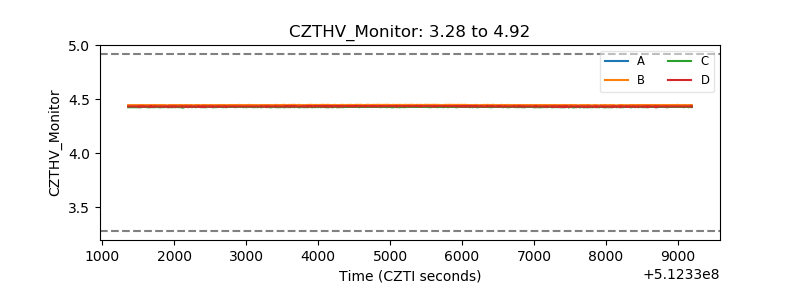 |
| D_VDD | 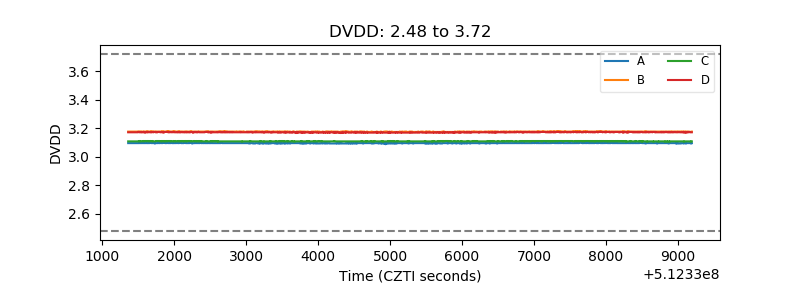 |
| Temperature 1 | 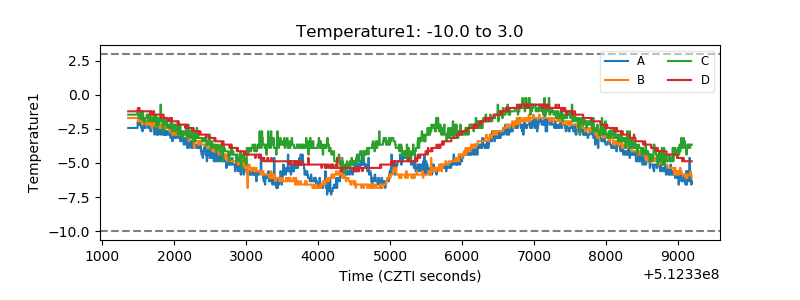 |
| Veto HV Monitor | 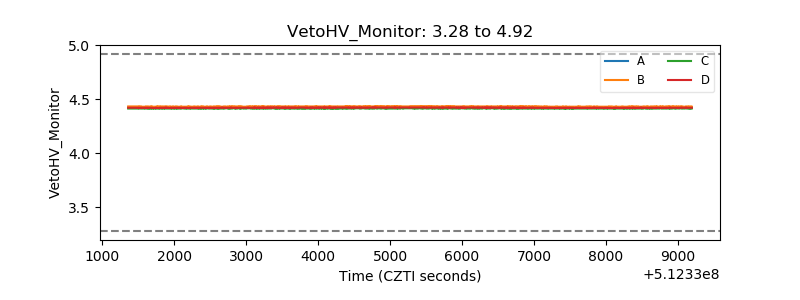 |
| Veto LLD | 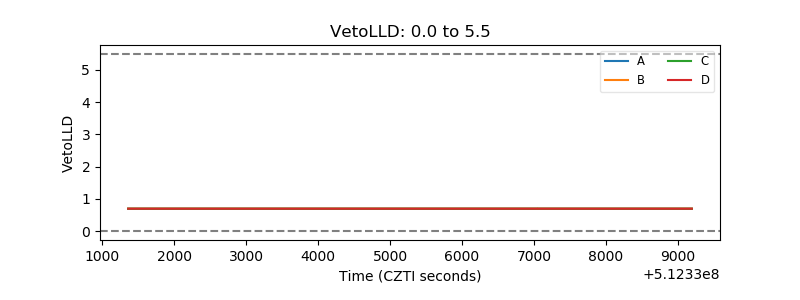 |
| Alpha Counter | 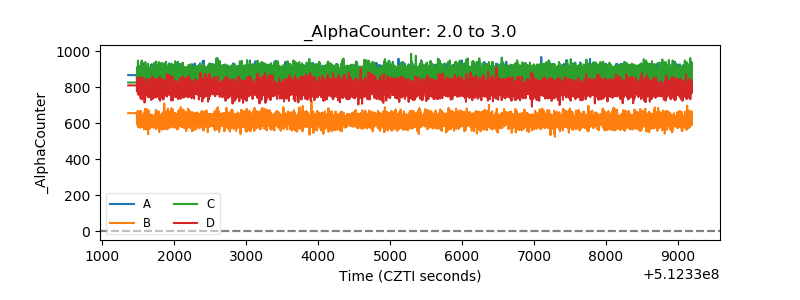 |
| _CPM_Rate | 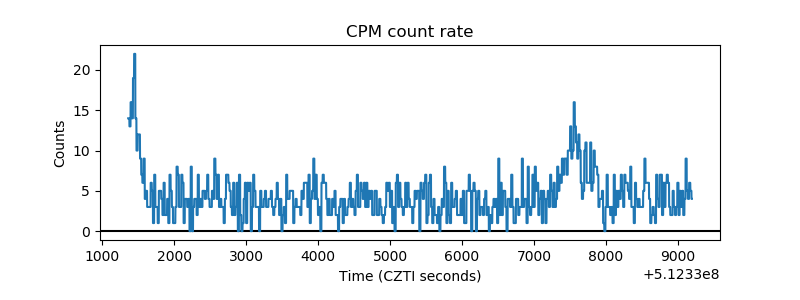 |
| CZT Counter | 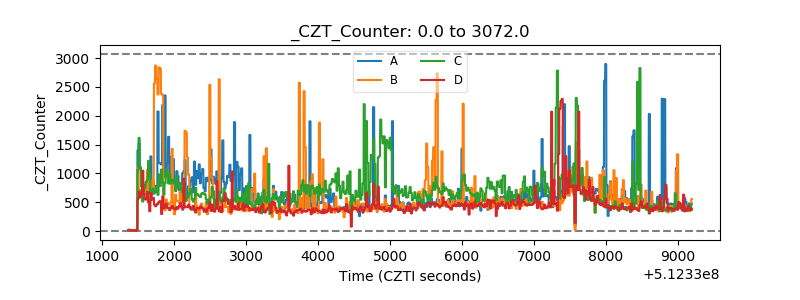 |
| +2.5 Volts monitor | 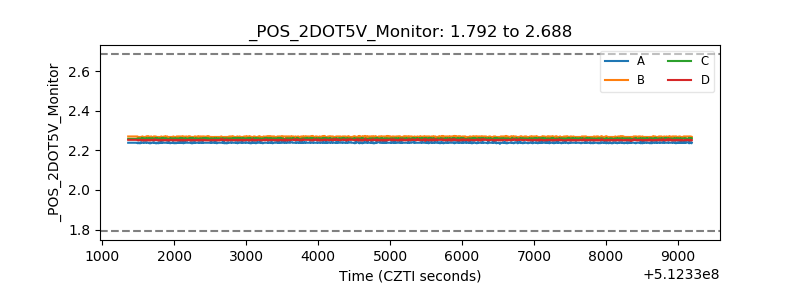 |
| +5 Volts monitor | 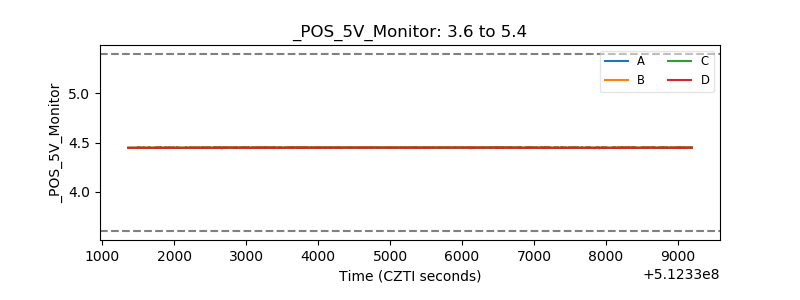 |
| _ROLL_ROT | 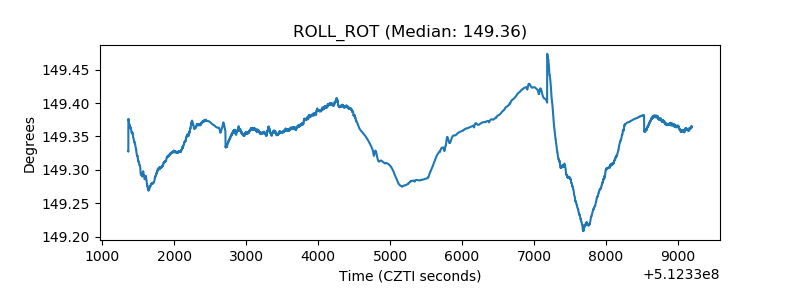 |
| _Roll_DEC | 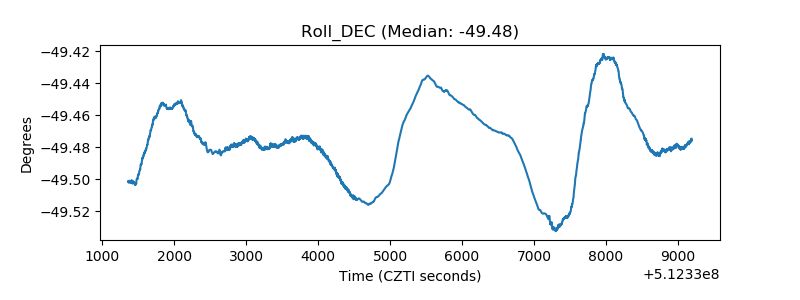 |
| _Roll_RA | 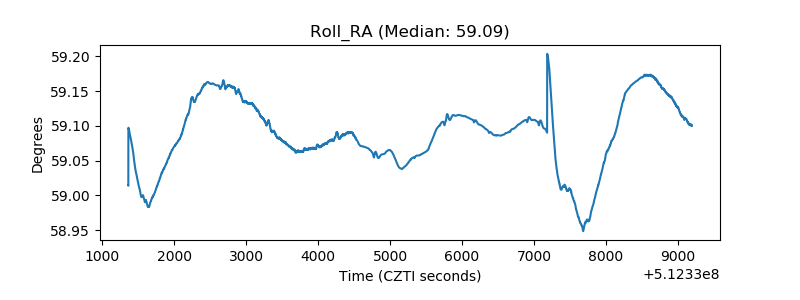 |
| Veto Counter | 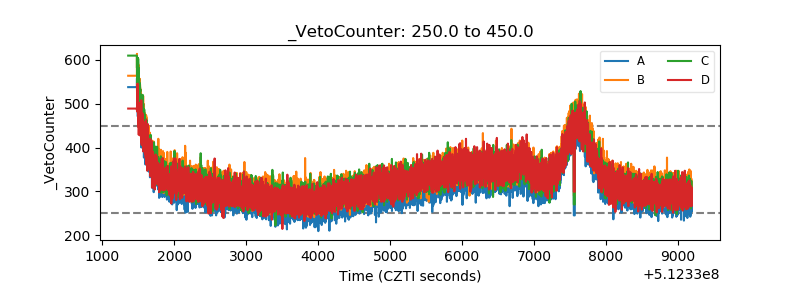 |