| Param | Original file | Final file |
|---|---|---|
| Filename | modeM0/AS1A14_083T03_9000006562_56788cztM0_level2.fits | modeM0/AS1A14_083T03_9000006562_56788cztM0_level2_quad_clean.evt |
| Size (bytes) | 512,550,720 | 118,166,400 |
| Size | 488.8 MB | 112.7 MB |
| Events in quadrant A | 4,838,807 | 763,643 |
| Events in quadrant B | 4,621,928 | 824,890 |
| Events in quadrant C | 4,802,199 | 721,281 |
| Events in quadrant D | 4,067,645 | 693,709 |
| Mode M9 | |||
|---|---|---|---|
| Quadrant | BADHDUFLAG | Total packets | Discarded packets |
| A | 0 | 1 | 0 |
| B | 0 | 1 | 0 |
| C | 0 | 1 | 0 |
| D | 0 | 1 | 0 |
| Mode SS | |||
|---|---|---|---|
| Quadrant | BADHDUFLAG | Total packets | Discarded packets |
| A | 0 | 166 | 0 |
| B | 0 | 166 | 0 |
| C | 0 | 166 | 0 |
| D | 0 | 166 | 0 |
| Mode M0 | |||
|---|---|---|---|
| Quadrant | BADHDUFLAG | Total packets | Discarded packets |
| A | 0 | 19916 | 1 |
| B | 0 | 19762 | 1 |
| C | 0 | 20268 | 1 |
| D | 0 | 18425 | 1 |
| Quadrant | Total seconds | Saturated seconds | Saturation percentage |
|---|---|---|---|
| A | 8270 | 189 | 2.285369% |
| B | 8271 | 221 | 2.671986% |
| C | 8271 | 204 | 2.466449% |
| D | 8271 | 64 | 0.773788% |
Noise dominated data is calculated using 1-second bins in cleaned event files. If a bin has >2000 counts, and if more than 50% of those come from <1% of pixels, then it is considered to be noise-dominated and hence unusable.
| Quadrant | # 1 sec bins | Bins with >0 counts | Bins with >2000 counts | High rate bins dominated by noise | Noise dominated (total time) | Noise dominated (detector-on time) | Marked lightcurve |
|---|---|---|---|---|---|---|---|
| A | 8285 | 8271 | 132 | 132 | 1.59% | 1.60% | 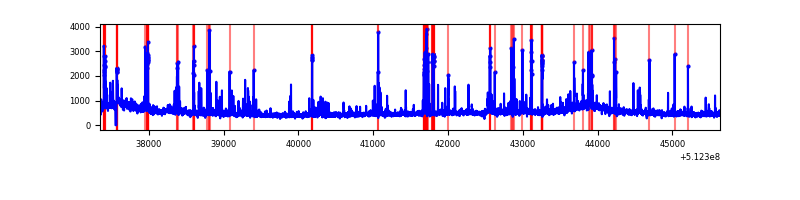 |
| B | 8286 | 8272 | 124 | 124 | 1.50% | 1.50% | 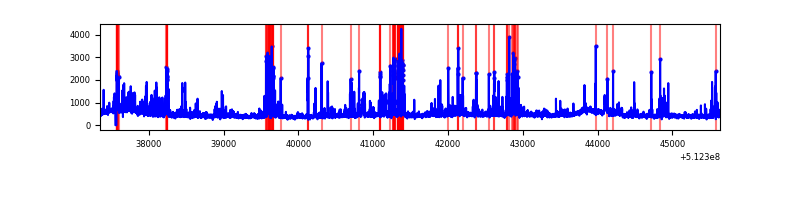 |
| C | 8286 | 8272 | 169 | 169 | 2.04% | 2.04% | 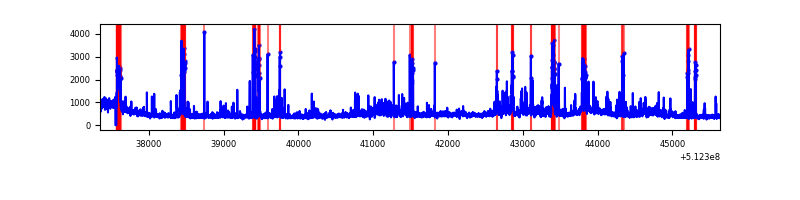 |
| D | 8286 | 8272 | 52 | 52 | 0.63% | 0.63% | 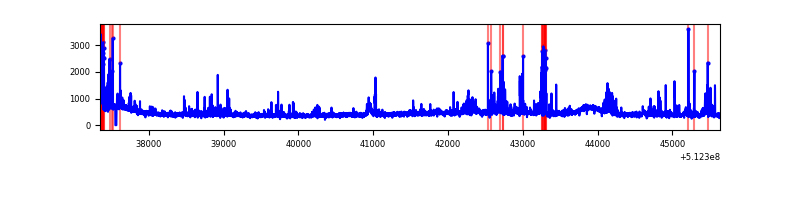 |
Top three noisy pixels from each quadrant. If the there are fewer than three noisy pixels in the level2.evt file, extra rows are filled as -1
| Pixel properties | Quadrant properties | ||||||
|---|---|---|---|---|---|---|---|
| Quadrant | DetID | PixID | Counts | Sigma | Mean | Median | Sigma |
| A | 3 | 14 | 712811 | 3252.75 | 887 | 865 | 218.9 |
| A | 10 | 251 | 595144 | 2715.15 | 887 | 865 | 218.9 |
| A | 7 | 64 | 25843 | 114.12 | 887 | 865 | 218.9 |
| B | 8 | 128 | 339450 | 1771.56 | 883 | 850 | 191.1 |
| B | 10 | 247 | 187061 | 974.26 | 883 | 850 | 191.1 |
| B | 5 | 185 | 178506 | 929.5 | 883 | 850 | 191.1 |
| C | 15 | 230 | 477349 | 2065.33 | 851 | 844 | 230.7 |
| C | 14 | 96 | 276951 | 1196.74 | 851 | 844 | 230.7 |
| C | 13 | 3 | 272741 | 1178.49 | 851 | 844 | 230.7 |
| D | 2 | 249 | 469191 | 1938.36 | 859 | 820 | 241.6 |
| D | 5 | 173 | 67894 | 277.59 | 859 | 820 | 241.6 |
| D | 2 | 31 | 57922 | 236.32 | 859 | 820 | 241.6 |
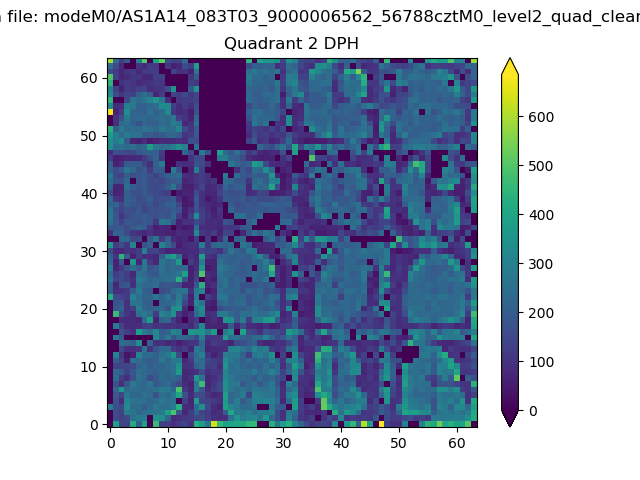
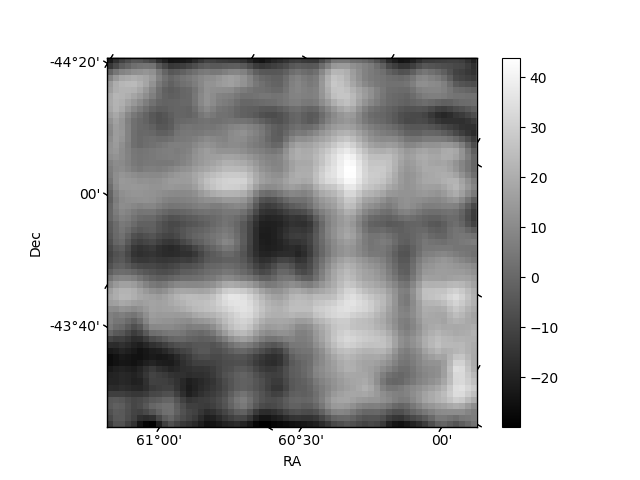
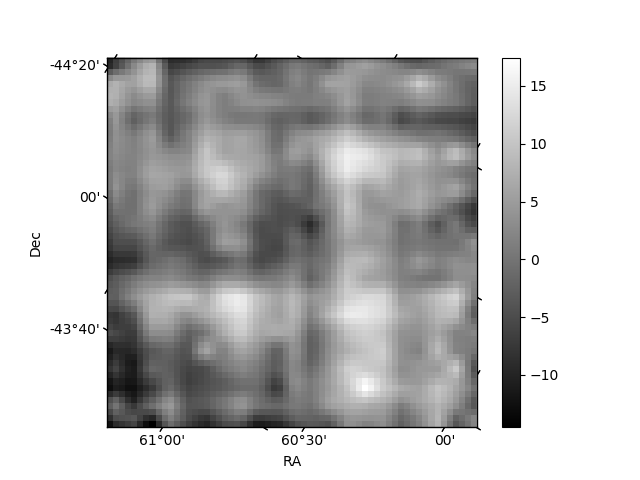
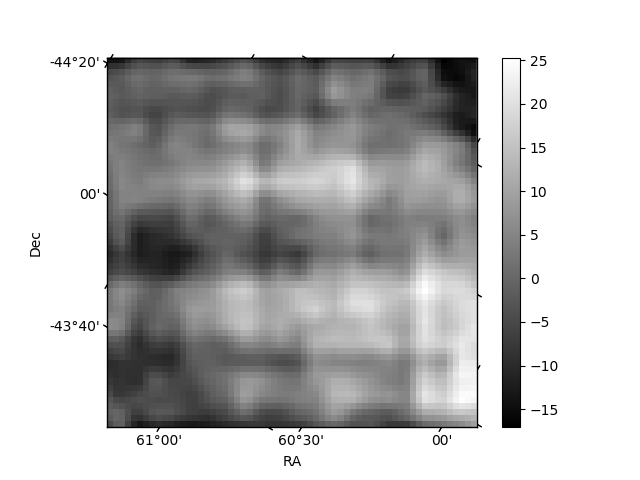
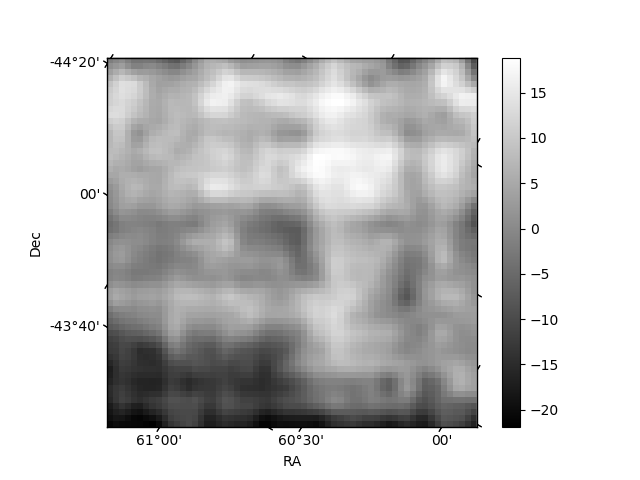
Histogram calculated using DETX and DETY for each event in the final _common_clean file
| Quadrant A | 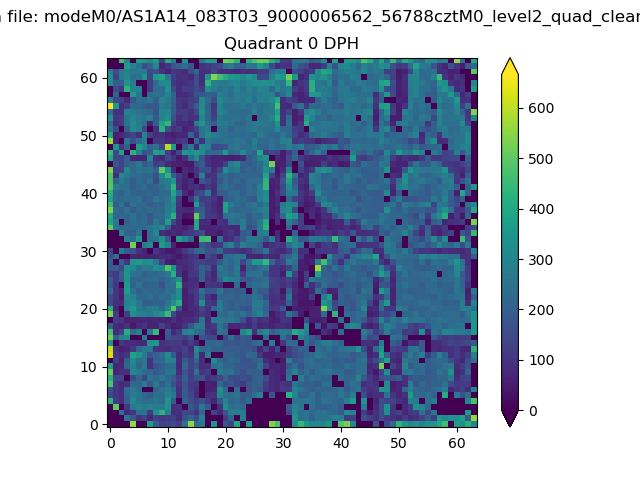 |
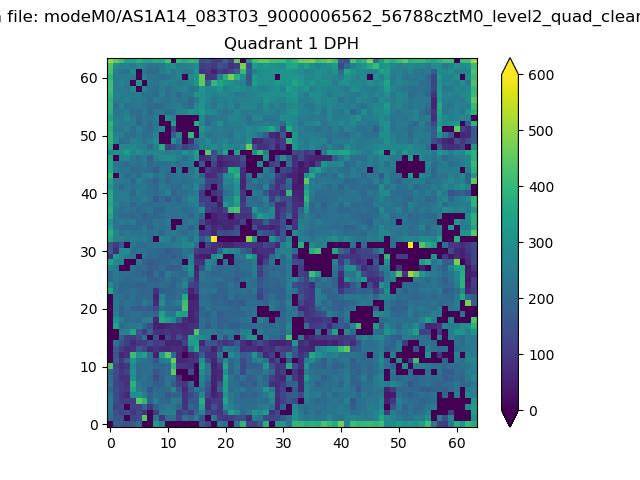 |
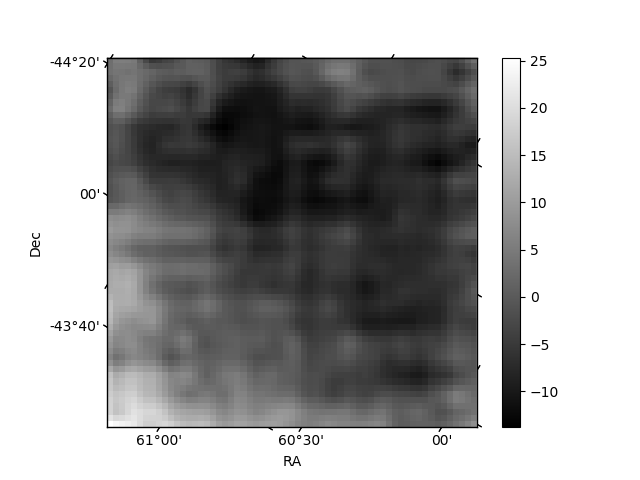
Quadrant B |
|---|---|---|---|
| Quadrant D | 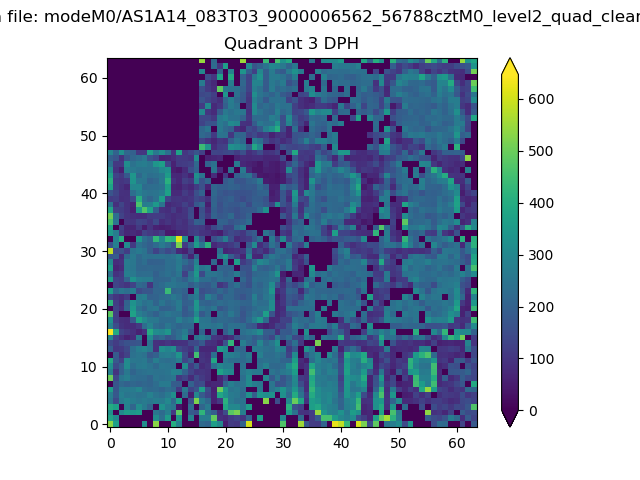 |
 |
Quadrant C |
| Plot type | Count rate plots | Images |
|---|---|---|
| Comparison with Poisson distribution Blue bars denote a histogram of data divided into 1 sec bins. Red curve is a Poisson curve with rate = median count rate of data. |
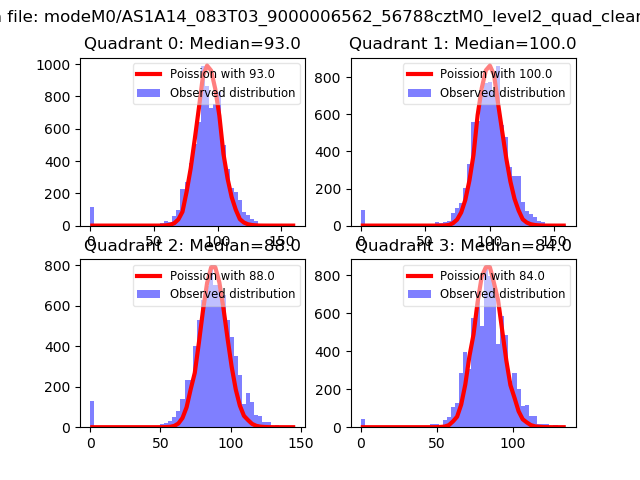 |
 |
| Quadrant-wise count rates Data is divided into 100 sec bins |
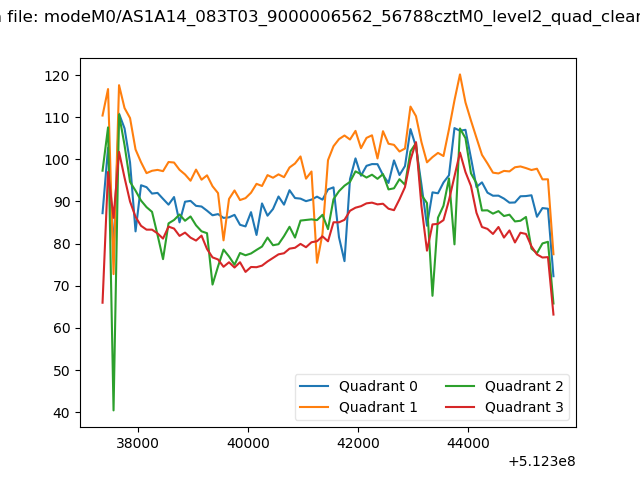 |
|
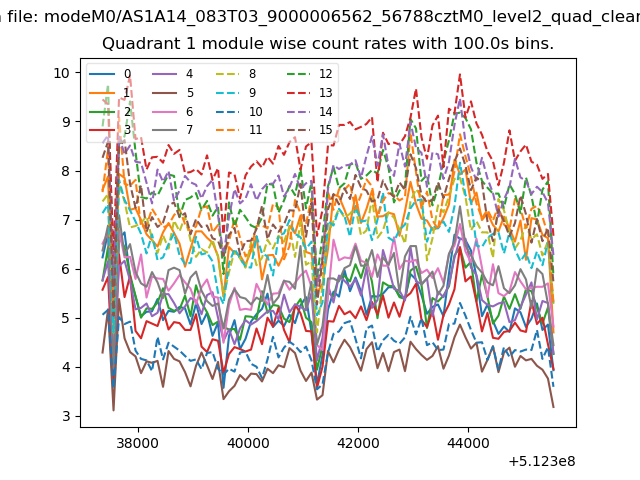
| Module-wise count rates for Quadrant A Data is divided into 100 sec bins |
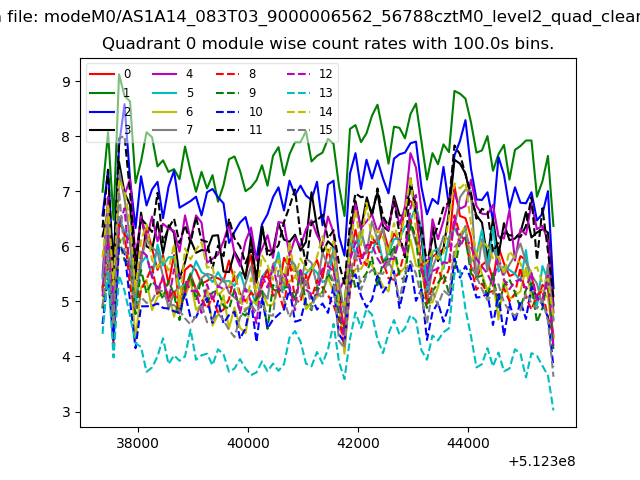 |
 |
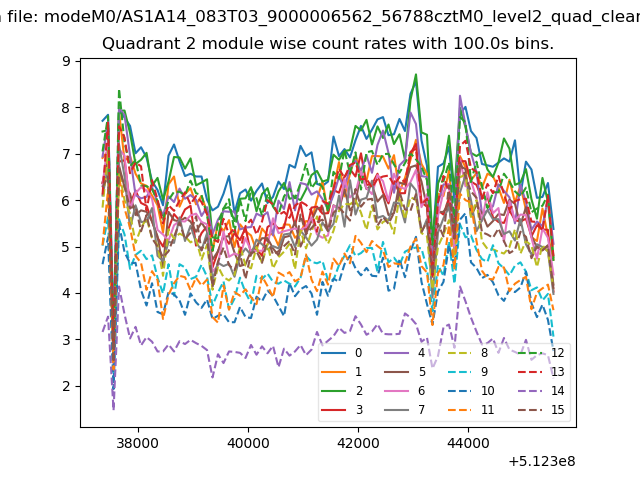
| Module-wise count rates for Quadrant B Data is divided into 100 sec bins |
 |
 |
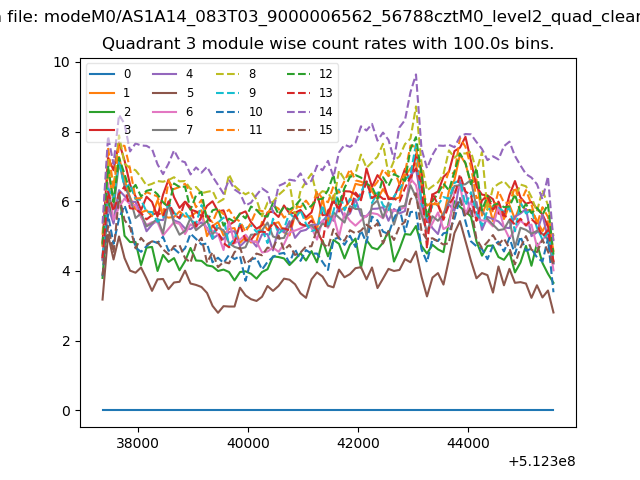
| Module-wise count rates for Quadrant C Data is divided into 100 sec bins |
 |
 |
| Module-wise count rates for Quadrant D Data is divided into 100 sec bins |
 |
 |
| Parameter | Plot |
|---|---|
| CZT HV Monitor | 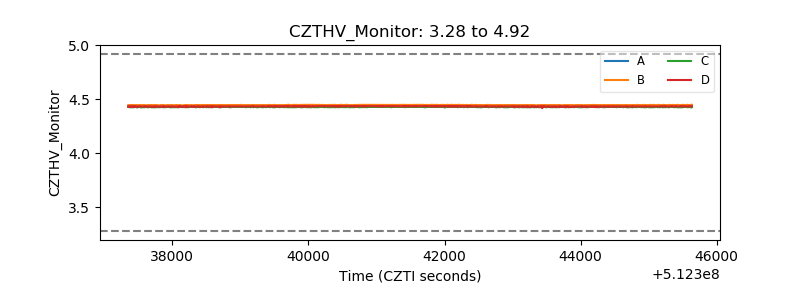 |
| D_VDD | 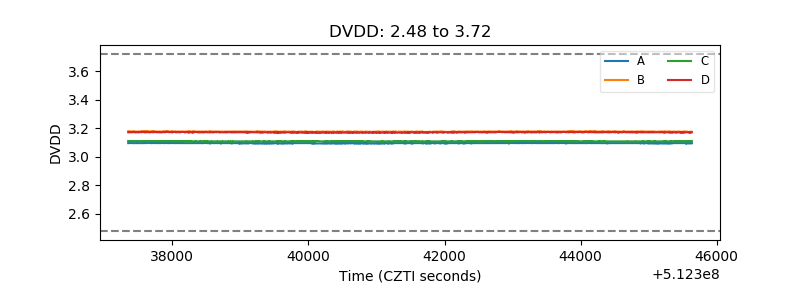 |
| Temperature 1 | 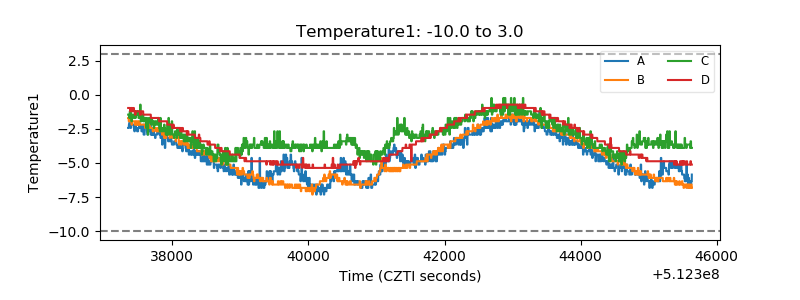 |
| Veto HV Monitor | 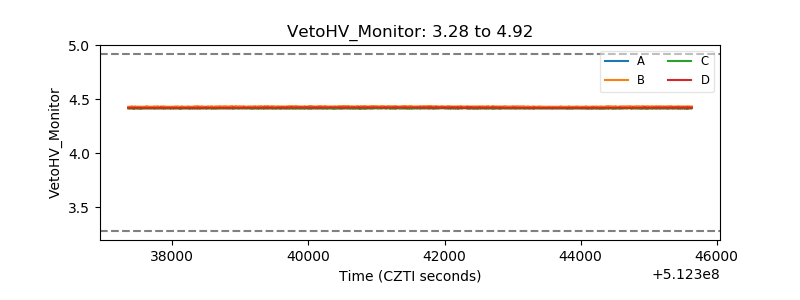 |
| Veto LLD | 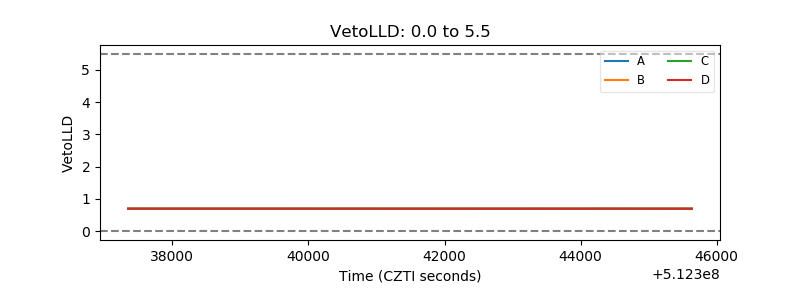 |
| Alpha Counter | 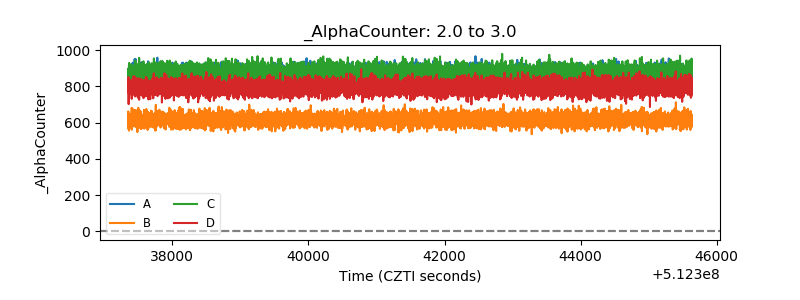 |
| _CPM_Rate | 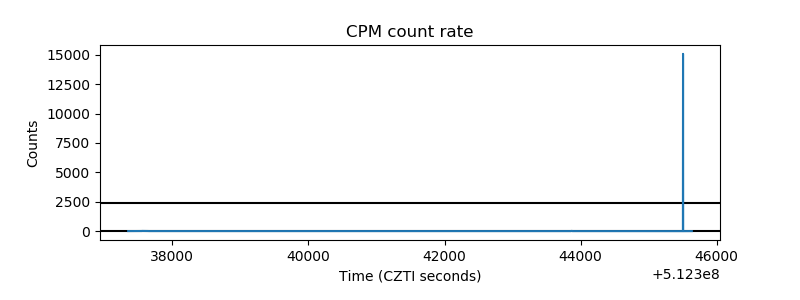 |
| CZT Counter | 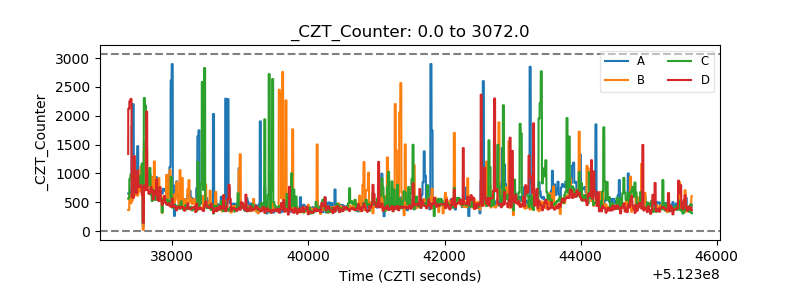 |
| +2.5 Volts monitor | 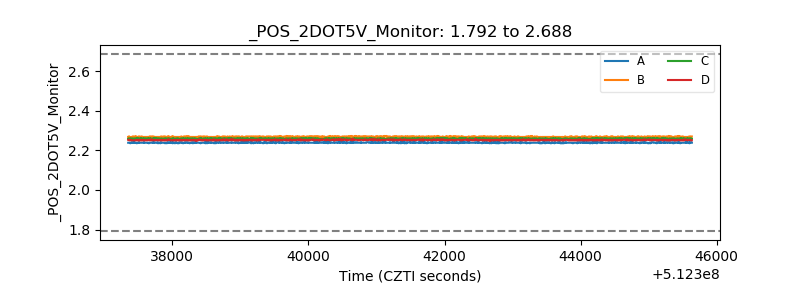 |
| +5 Volts monitor | 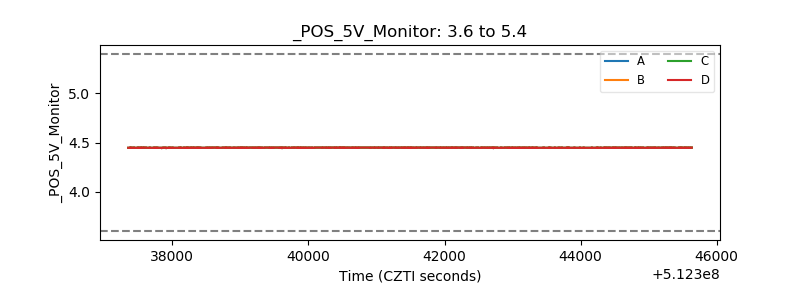 |
| _ROLL_ROT | 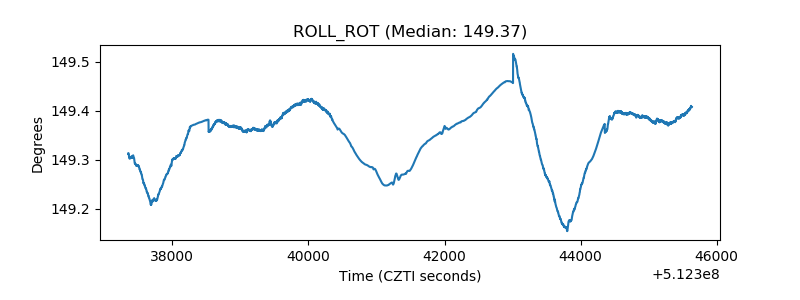 |
| _Roll_DEC | 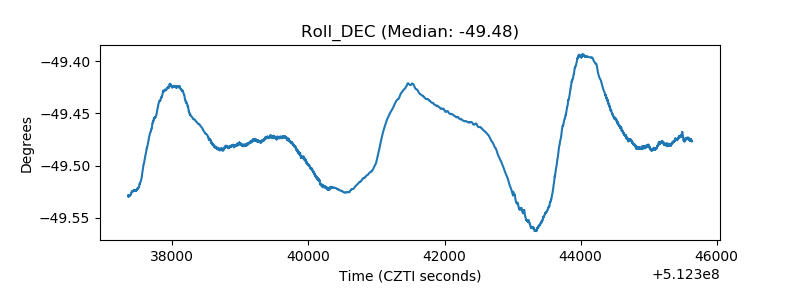 |
| _Roll_RA | 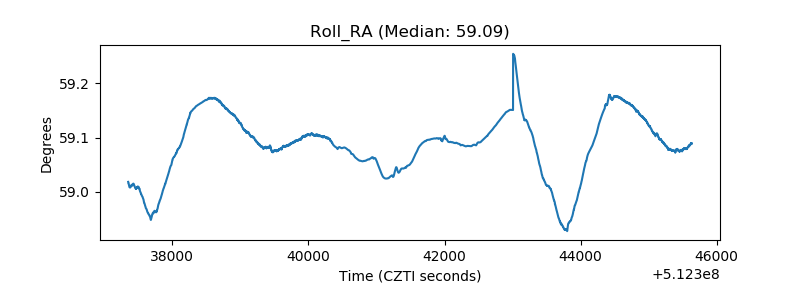 |
| Veto Counter | 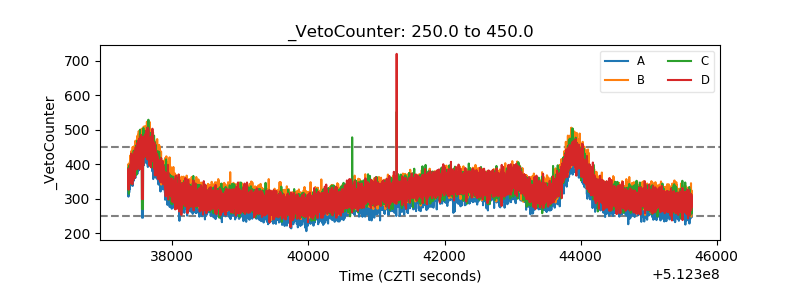 |