| Param | Original file | Final file |
|---|---|---|
| Filename | modeM0/AS1A14_083T03_9000006562_56792cztM0_level2.fits | modeM0/AS1A14_083T03_9000006562_56792cztM0_level2_quad_clean.evt |
| Size (bytes) | 1,577,468,160 | 363,127,680 |
| Size | 1.5 GB | 346.3 MB |
| Events in quadrant A | 14,912,942 | 2,358,997 |
| Events in quadrant B | 16,436,015 | 2,479,277 |
| Events in quadrant C | 12,570,368 | 2,256,852 |
| Events in quadrant D | 12,487,297 | 2,133,927 |
| Mode M9 | |||
|---|---|---|---|
| Quadrant | BADHDUFLAG | Total packets | Discarded packets |
| A | 0 | 16 | 0 |
| B | 0 | 16 | 0 |
| C | 0 | 16 | 0 |
| D | 0 | 16 | 0 |
| Mode SS | |||
|---|---|---|---|
| Quadrant | BADHDUFLAG | Total packets | Discarded packets |
| A | 0 | 522 | 0 |
| B | 0 | 522 | 0 |
| C | 0 | 522 | 0 |
| D | 0 | 522 | 0 |
| Mode M0 | |||
|---|---|---|---|
| Quadrant | BADHDUFLAG | Total packets | Discarded packets |
| A | 0 | 61314 | 4 |
| B | 0 | 66781 | 4 |
| C | 0 | 56037 | 4 |
| D | 0 | 56363 | 4 |
| Quadrant | Total seconds | Saturated seconds | Saturation percentage |
|---|---|---|---|
| A | 25659 | 529 | 2.061655% |
| B | 25659 | 1406 | 5.479559% |
| C | 25660 | 409 | 1.593920% |
| D | 25660 | 346 | 1.348402% |
Noise dominated data is calculated using 1-second bins in cleaned event files. If a bin has >2000 counts, and if more than 50% of those come from <1% of pixels, then it is considered to be noise-dominated and hence unusable.
| Quadrant | # 1 sec bins | Bins with >0 counts | Bins with >2000 counts | High rate bins dominated by noise | Noise dominated (total time) | Noise dominated (detector-on time) | Marked lightcurve |
|---|---|---|---|---|---|---|---|
| A | 27284 | 25660 | 162 | 162 | 0.59% | 0.63% | 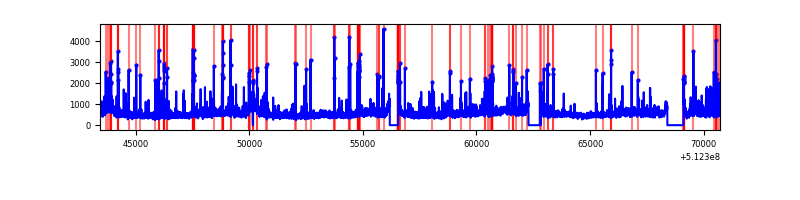 |
| B | 27283 | 25660 | 725 | 725 | 2.66% | 2.83% | 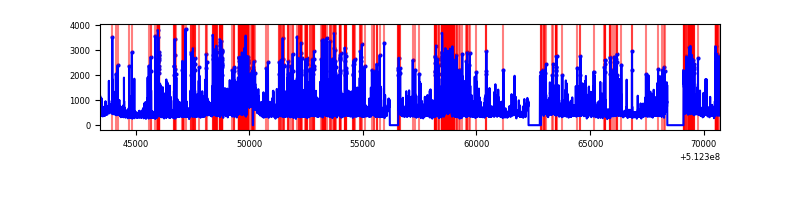 |
| C | 27285 | 25662 | 122 | 122 | 0.45% | 0.48% | 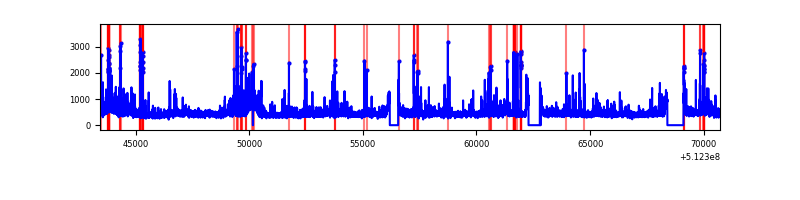 |
| D | 27285 | 25663 | 140 | 140 | 0.51% | 0.55% | 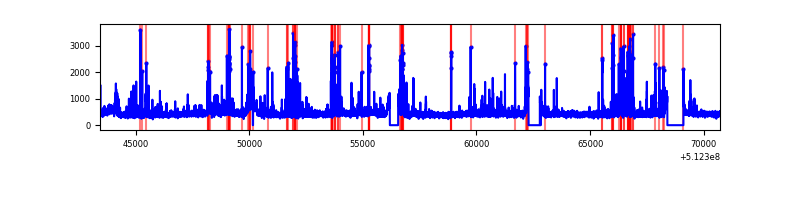 |
Top three noisy pixels from each quadrant. If the there are fewer than three noisy pixels in the level2.evt file, extra rows are filled as -1
| Pixel properties | Quadrant properties | ||||||
|---|---|---|---|---|---|---|---|
| Quadrant | DetID | PixID | Counts | Sigma | Mean | Median | Sigma |
| A | 3 | 14 | 3035505 | 4491.58 | 2754 | 2685 | 675.2 |
| A | 10 | 251 | 835474 | 1233.35 | 2754 | 2685 | 675.2 |
| A | 4 | 95 | 97390 | 140.26 | 2754 | 2685 | 675.2 |
| B | 8 | 128 | 2855951 | 4995.68 | 2694 | 2587 | 571.2 |
| B | 4 | 206 | 1115012 | 1947.64 | 2694 | 2587 | 571.2 |
| B | 5 | 185 | 396372 | 689.44 | 2694 | 2587 | 571.2 |
| C | 14 | 96 | 409881 | 556.9 | 2694 | 2669 | 731.2 |
| C | 9 | 38 | 392066 | 532.53 | 2694 | 2669 | 731.2 |
| C | 12 | 252 | 386036 | 524.29 | 2694 | 2669 | 731.2 |
| D | 2 | 249 | 1117166 | 1494.48 | 2679 | 2557 | 745.8 |
| D | 5 | 173 | 205841 | 272.57 | 2679 | 2557 | 745.8 |
| D | 2 | 236 | 164246 | 216.79 | 2679 | 2557 | 745.8 |
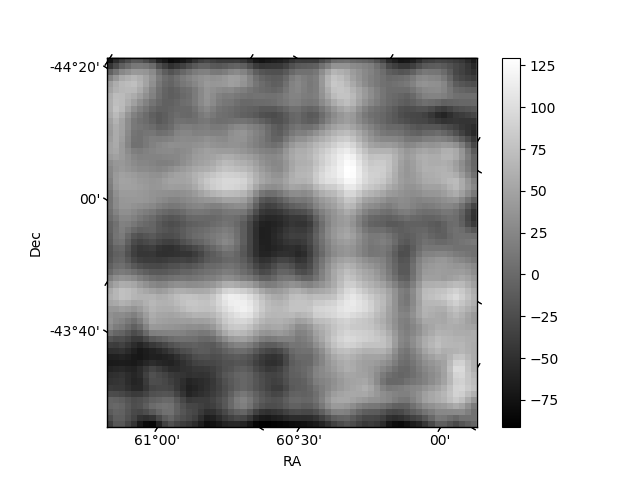
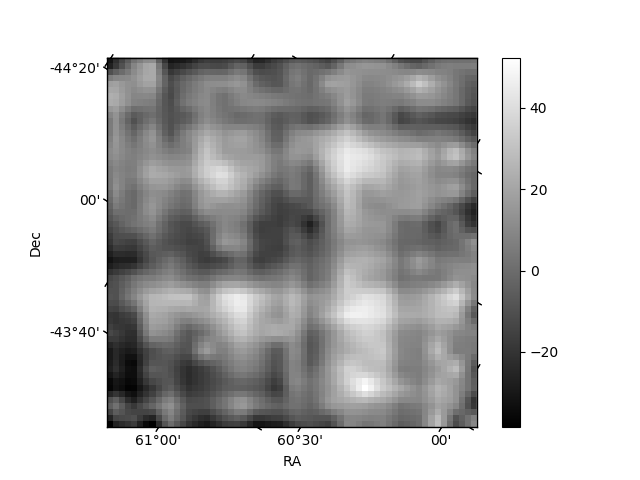
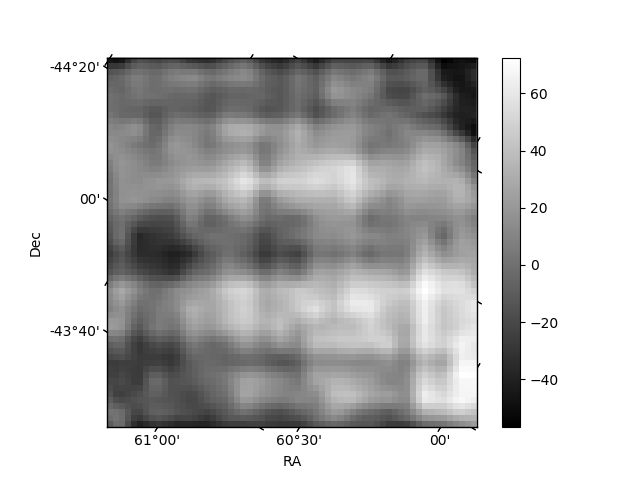
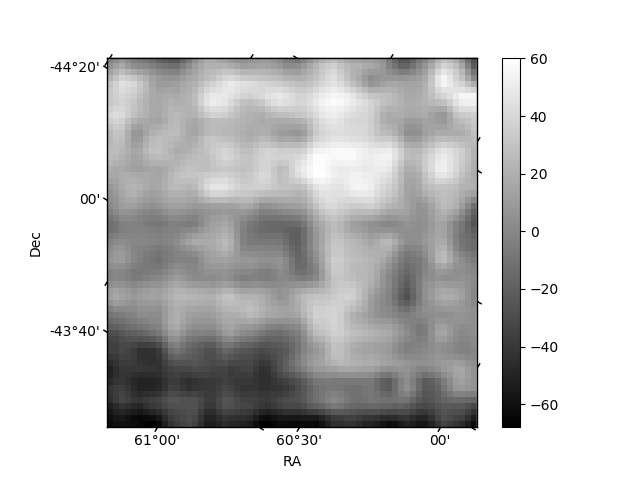
Histogram calculated using DETX and DETY for each event in the final _common_clean file
| Quadrant A | 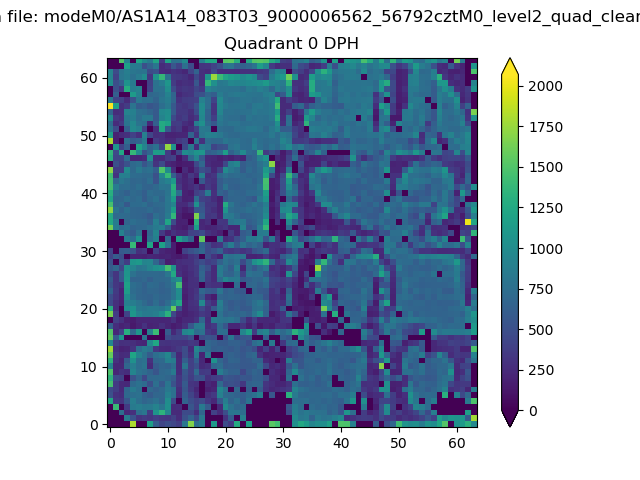 |
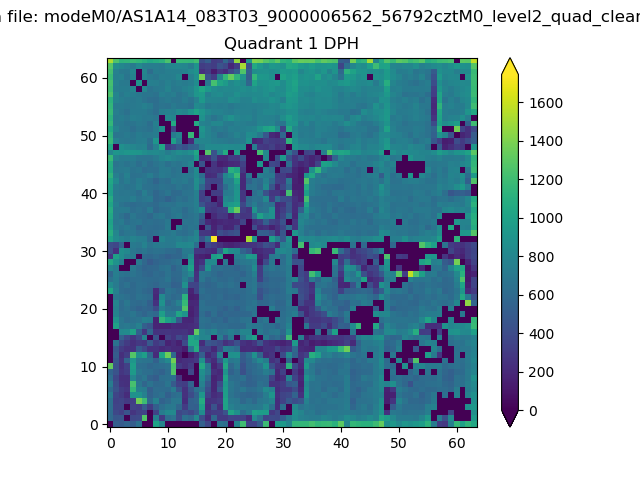 |
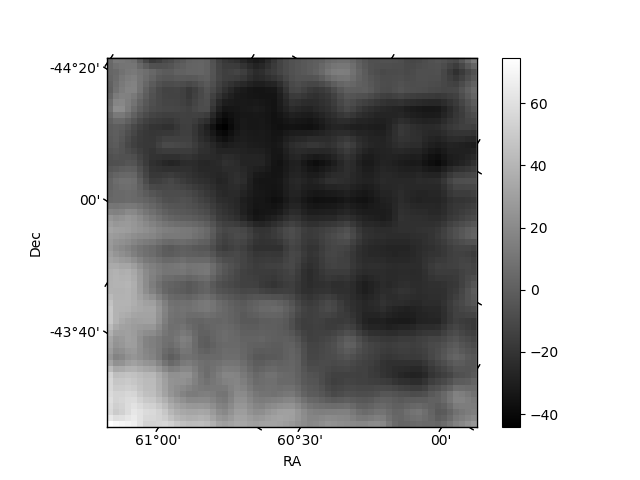
Quadrant B |
|---|---|---|---|
| Quadrant D | 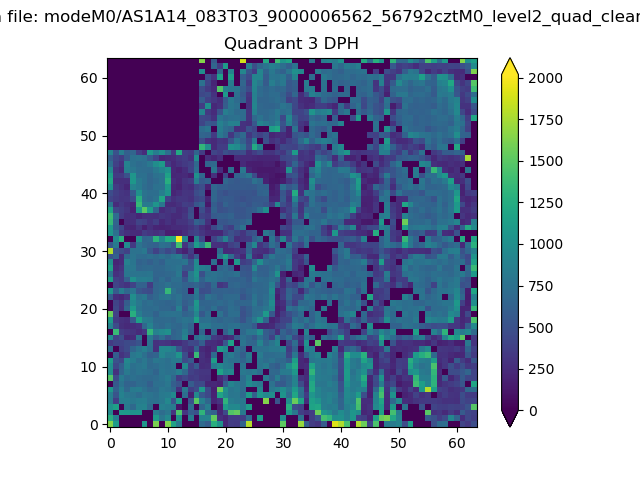 |
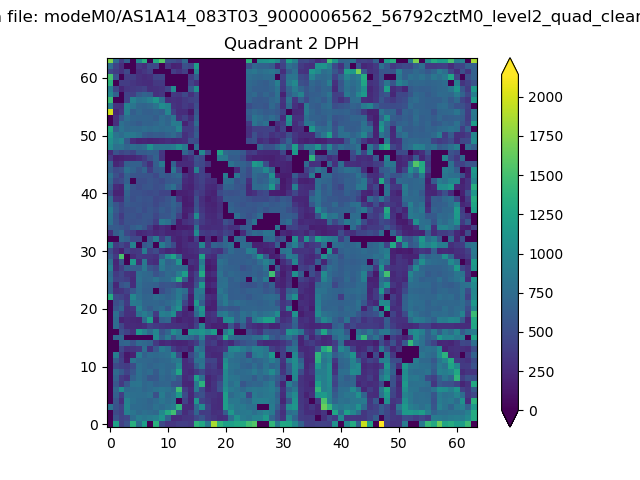 |
Quadrant C |
| Plot type | Count rate plots | Images |
|---|---|---|
| Comparison with Poisson distribution Blue bars denote a histogram of data divided into 1 sec bins. Red curve is a Poisson curve with rate = median count rate of data. |
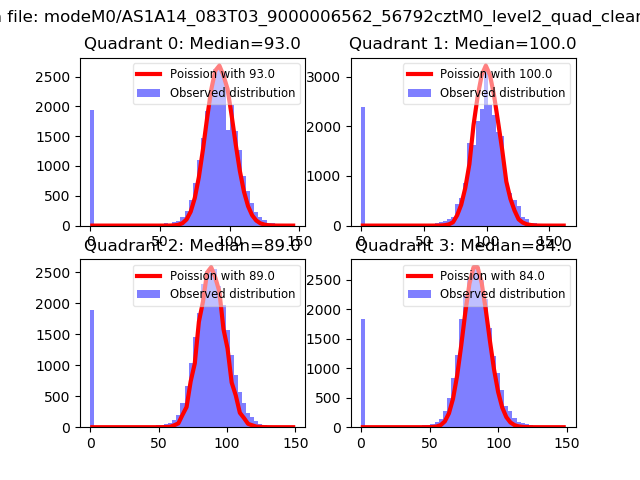 |
 |
| Quadrant-wise count rates Data is divided into 100 sec bins |
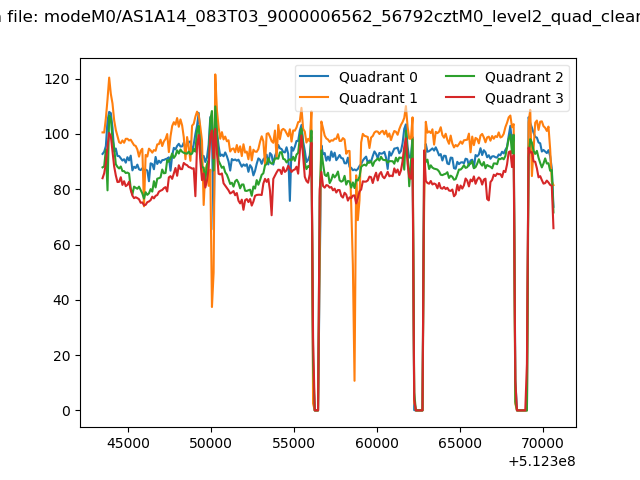 |
|
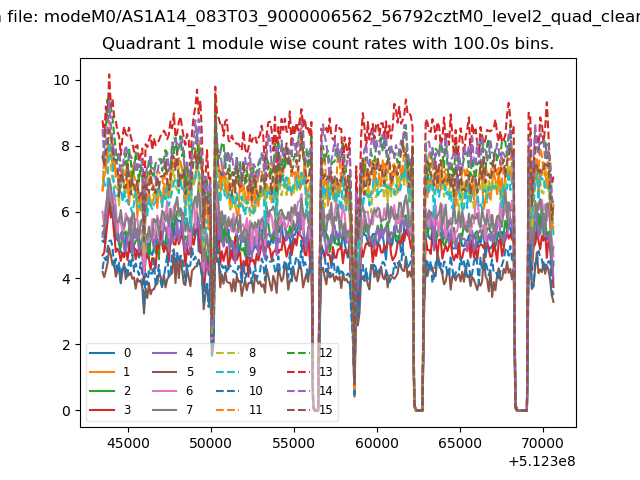
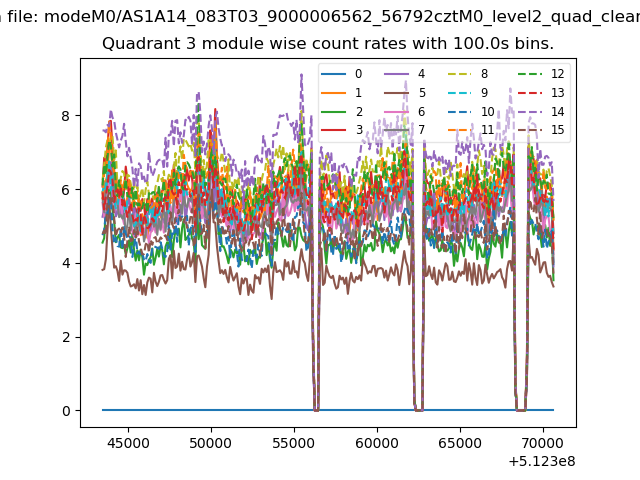
| Module-wise count rates for Quadrant A Data is divided into 100 sec bins |
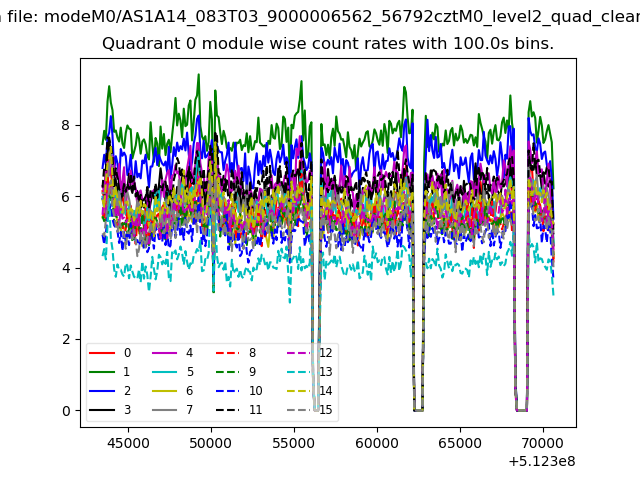 |
 |
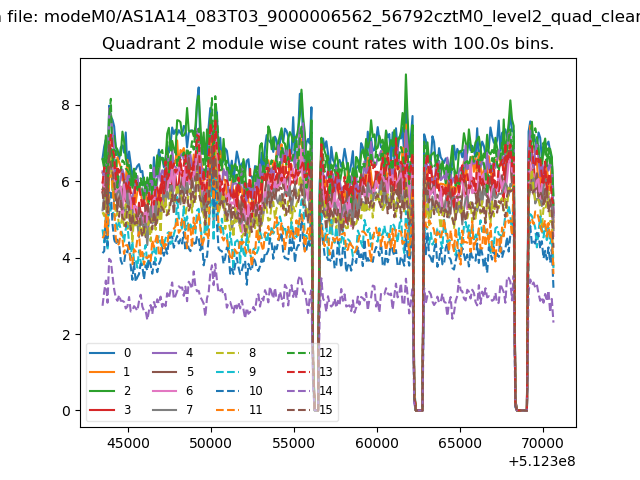
| Module-wise count rates for Quadrant B Data is divided into 100 sec bins |
 |
 |
| Module-wise count rates for Quadrant C Data is divided into 100 sec bins |
 |
 |
| Module-wise count rates for Quadrant D Data is divided into 100 sec bins |
 |
 |
| Parameter | Plot |
|---|---|
| CZT HV Monitor | 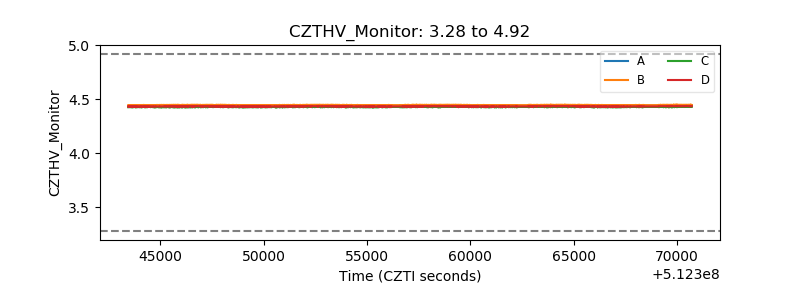 |
| D_VDD | 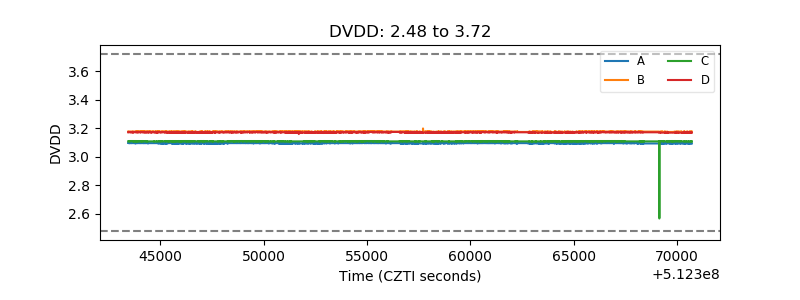 |
| Temperature 1 | 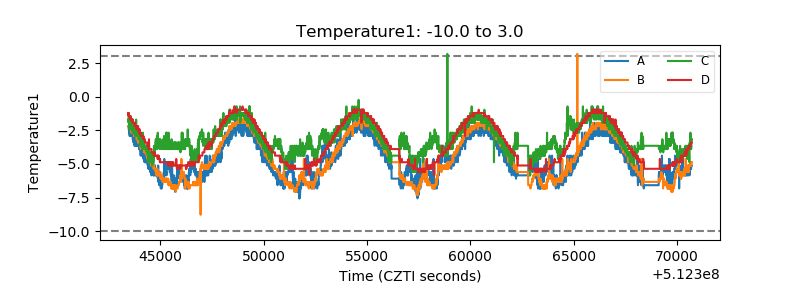 |
| Veto HV Monitor |  |
| Veto LLD | 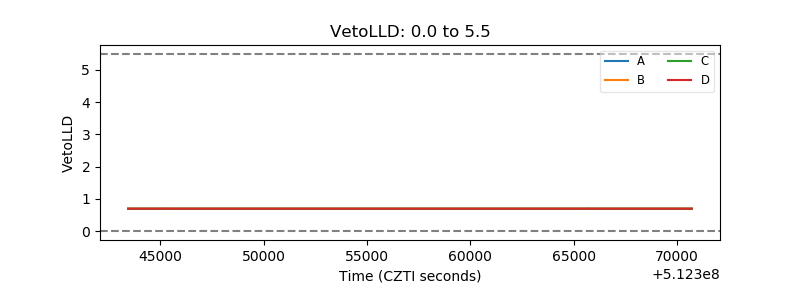 |
| Alpha Counter | 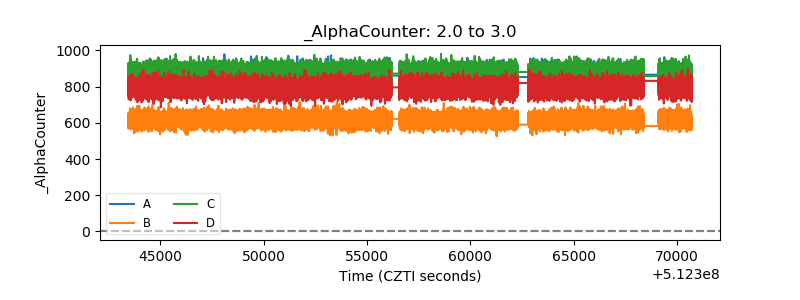 |
| _CPM_Rate | 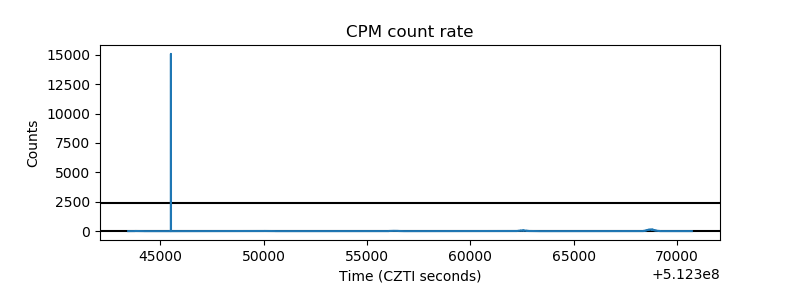 |
| CZT Counter | 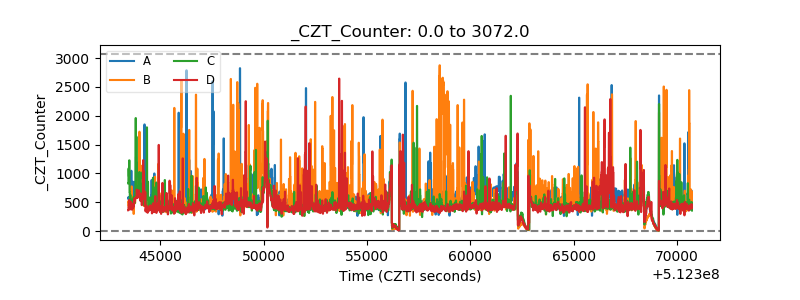 |
| +2.5 Volts monitor |  |
| +5 Volts monitor |  |
| _ROLL_ROT | 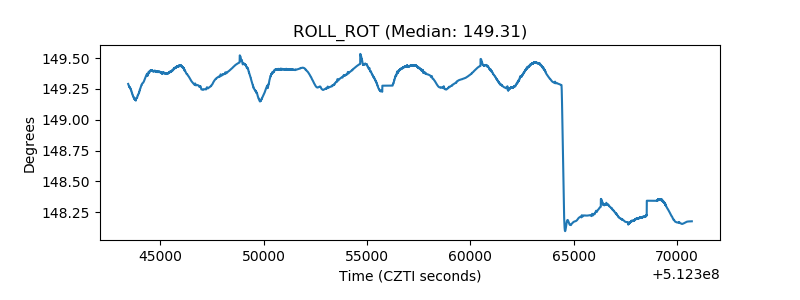 |
| _Roll_DEC | 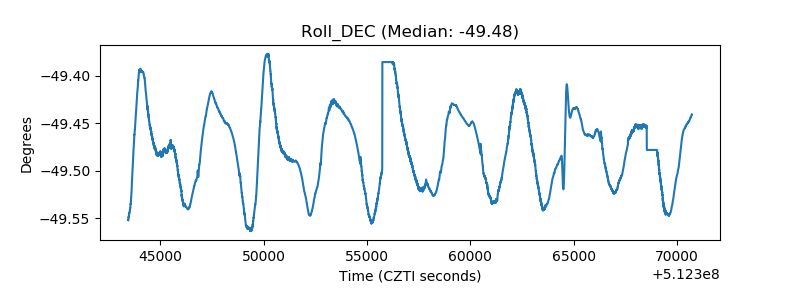 |
| _Roll_RA | 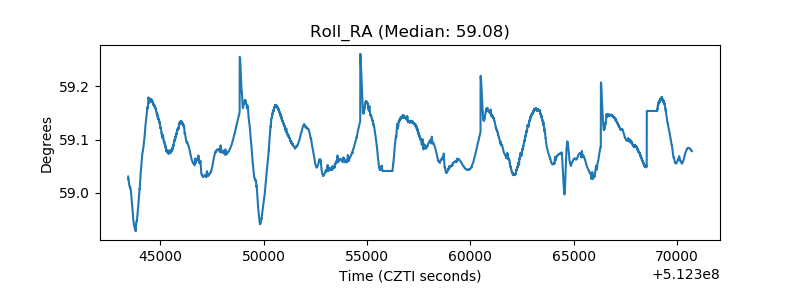 |
| Veto Counter | 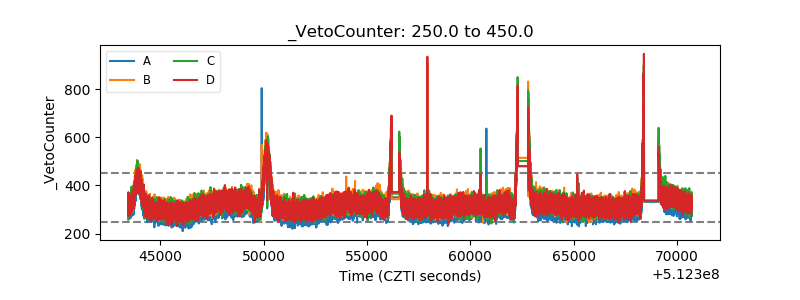 |