| Param | Original file | Final file |
|---|---|---|
| Filename | modeM0/AS1A14_083T03_9000006562_56793cztM0_level2.fits | modeM0/AS1A14_083T03_9000006562_56793cztM0_level2_quad_clean.evt |
| Size (bytes) | 452,301,120 | 98,982,720 |
| Size | 431.3 MB | 94.4 MB |
| Events in quadrant A | 4,891,926 | 619,969 |
| Events in quadrant B | 4,610,803 | 682,845 |
| Events in quadrant C | 3,330,313 | 628,012 |
| Events in quadrant D | 3,372,206 | 585,030 |
| Mode M9 | |||
|---|---|---|---|
| Quadrant | BADHDUFLAG | Total packets | Discarded packets |
| A | 0 | 9 | 0 |
| B | 0 | 9 | 0 |
| C | 0 | 10 | 0 |
| D | 0 | 10 | 0 |
| Mode SS | |||
|---|---|---|---|
| Quadrant | BADHDUFLAG | Total packets | Discarded packets |
| A | 0 | 140 | 0 |
| B | 0 | 140 | 0 |
| C | 0 | 140 | 0 |
| D | 0 | 140 | 0 |
| Mode M0 | |||
|---|---|---|---|
| Quadrant | BADHDUFLAG | Total packets | Discarded packets |
| A | 0 | 18922 | 2 |
| B | 0 | 18475 | 2 |
| C | 0 | 14908 | 2 |
| D | 0 | 15167 | 2 |
| Quadrant | Total seconds | Saturated seconds | Saturation percentage |
|---|---|---|---|
| A | 6910 | 506 | 7.322721% |
| B | 6910 | 405 | 5.861071% |
| C | 6910 | 109 | 1.577424% |
| D | 6910 | 167 | 2.416787% |
Noise dominated data is calculated using 1-second bins in cleaned event files. If a bin has >2000 counts, and if more than 50% of those come from <1% of pixels, then it is considered to be noise-dominated and hence unusable.
| Quadrant | # 1 sec bins | Bins with >0 counts | Bins with >2000 counts | High rate bins dominated by noise | Noise dominated (total time) | Noise dominated (detector-on time) | Marked lightcurve |
|---|---|---|---|---|---|---|---|
| A | 7795 | 6910 | 399 | 399 | 5.12% | 5.77% | 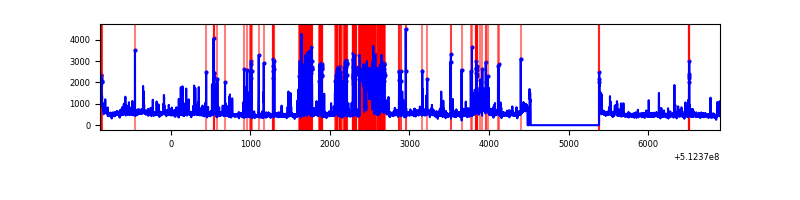 |
| B | 7795 | 6910 | 223 | 223 | 2.86% | 3.23% | 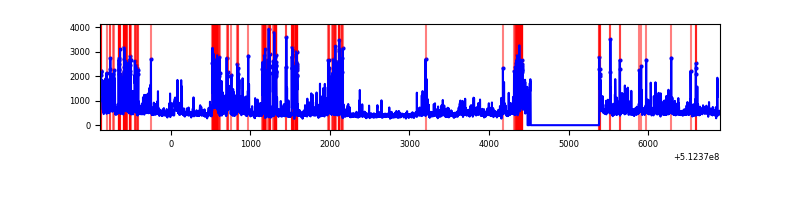 |
| C | 7795 | 6910 | 22 | 22 | 0.28% | 0.32% | 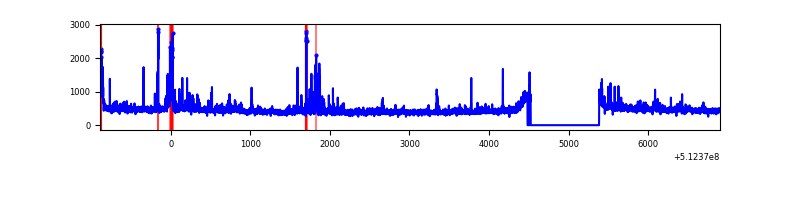 |
| D | 7795 | 6910 | 101 | 101 | 1.30% | 1.46% | 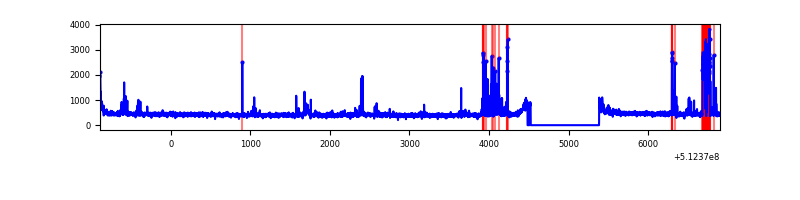 |
Top three noisy pixels from each quadrant. If the there are fewer than three noisy pixels in the level2.evt file, extra rows are filled as -1
| Pixel properties | Quadrant properties | ||||||
|---|---|---|---|---|---|---|---|
| Quadrant | DetID | PixID | Counts | Sigma | Mean | Median | Sigma |
| A | 3 | 62 | 1024462 | 5714.21 | 725 | 706 | 179.2 |
| A | 3 | 14 | 538964 | 3004.35 | 725 | 706 | 179.2 |
| A | 10 | 251 | 364246 | 2029.14 | 725 | 706 | 179.2 |
| B | 8 | 128 | 1020869 | 6606.38 | 725 | 697 | 154.4 |
| B | 4 | 206 | 207359 | 1338.29 | 725 | 697 | 154.4 |
| B | 0 | 171 | 122864 | 791.12 | 725 | 697 | 154.4 |
| C | 12 | 252 | 181752 | 909.83 | 730 | 720 | 199.0 |
| C | 15 | 230 | 93547 | 466.53 | 730 | 720 | 199.0 |
| C | 1 | 16 | 67292 | 334.58 | 730 | 720 | 199.0 |
| D | 2 | 249 | 352574 | 1725.0 | 725 | 693 | 204.0 |
| D | 2 | 252 | 53057 | 256.7 | 725 | 693 | 204.0 |
| D | 5 | 173 | 50519 | 244.26 | 725 | 693 | 204.0 |
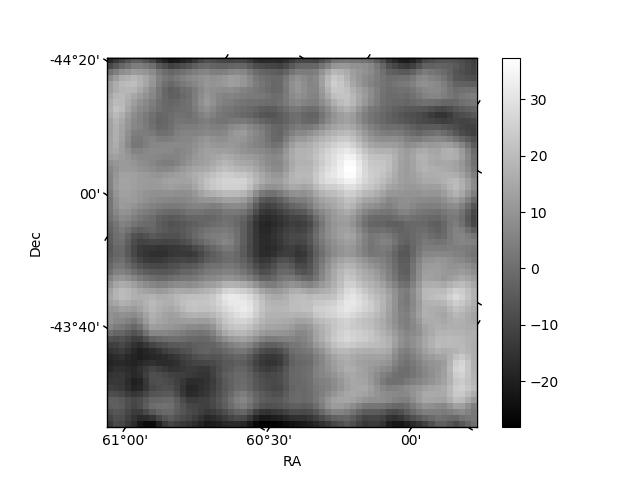
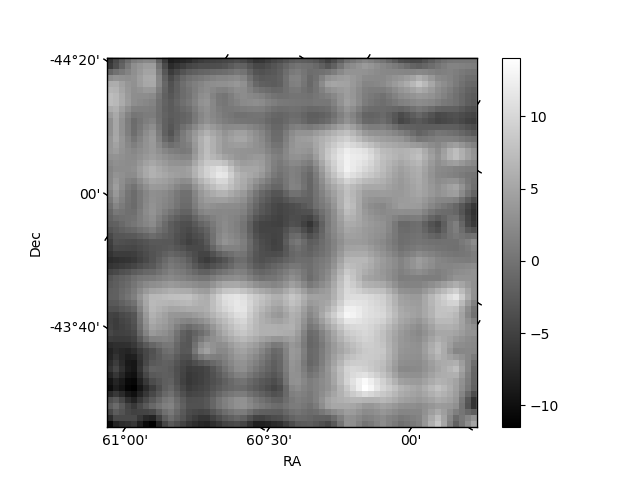
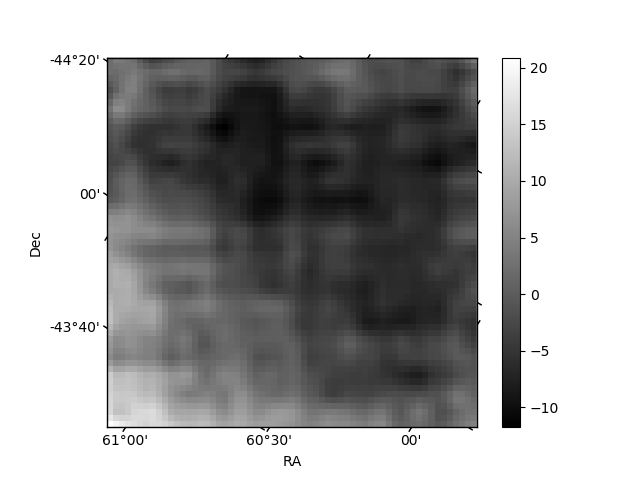
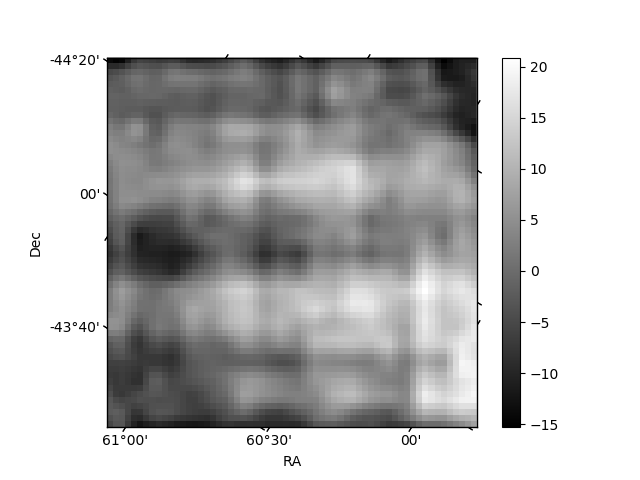
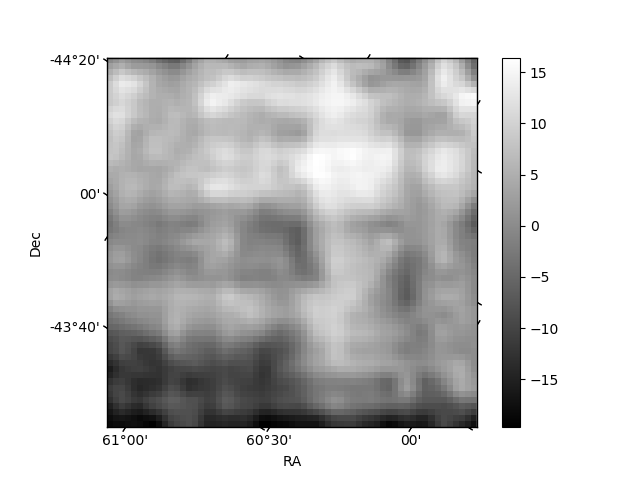
Histogram calculated using DETX and DETY for each event in the final _common_clean file
| Quadrant A | 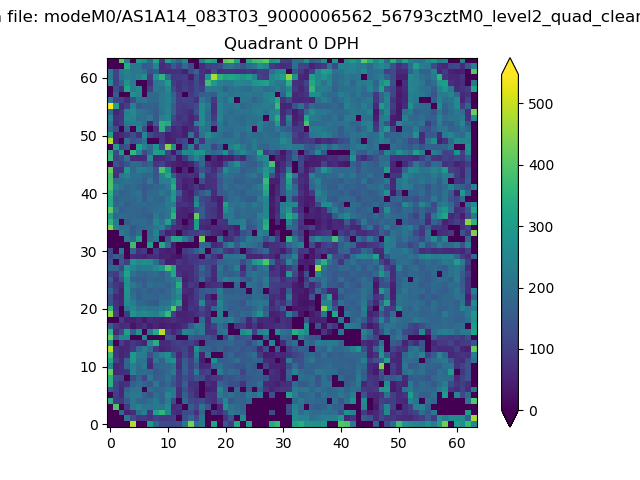 |
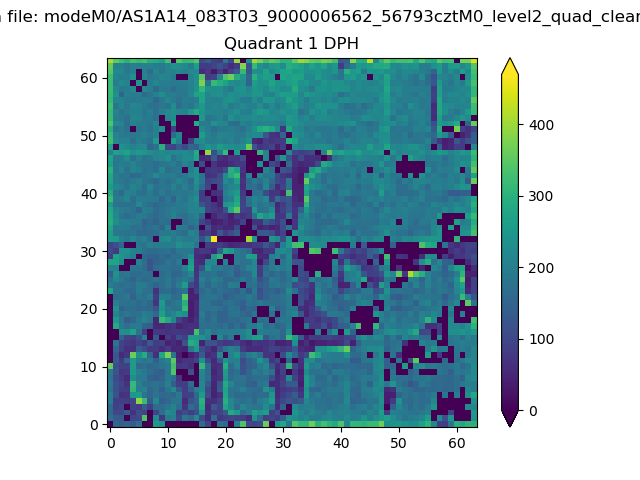 |
Quadrant B |
|---|---|---|---|
| Quadrant D | 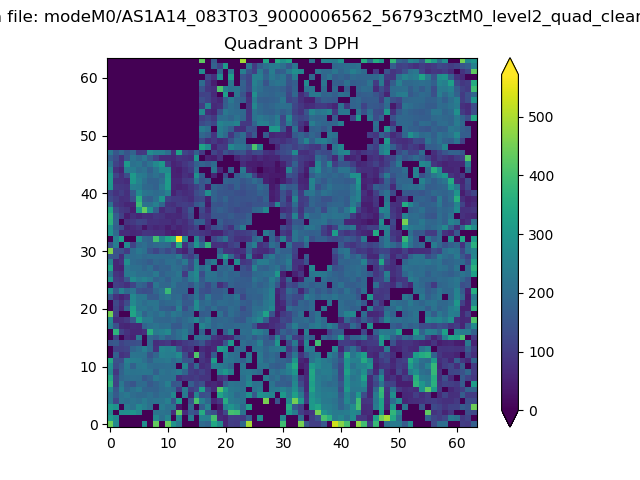 |
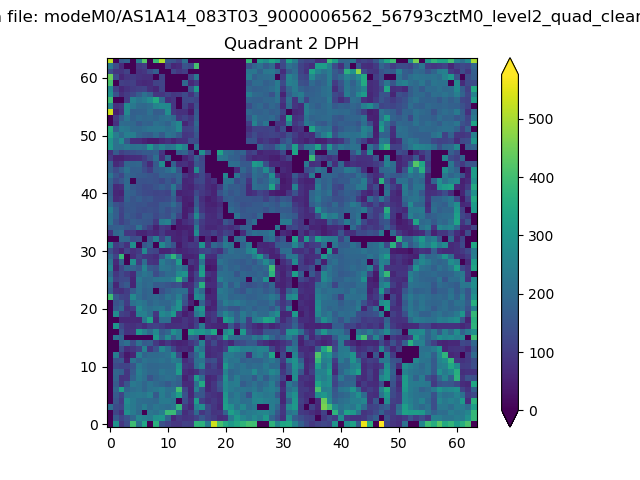 |
Quadrant C |
| Plot type | Count rate plots | Images |
|---|---|---|
| Comparison with Poisson distribution Blue bars denote a histogram of data divided into 1 sec bins. Red curve is a Poisson curve with rate = median count rate of data. |
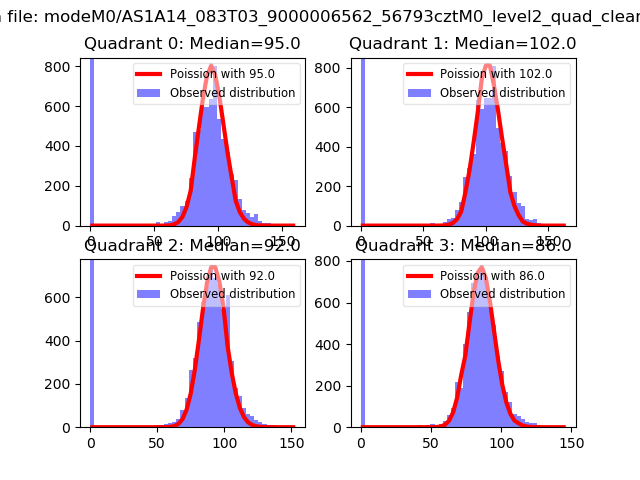 |
 |
| Quadrant-wise count rates Data is divided into 100 sec bins |
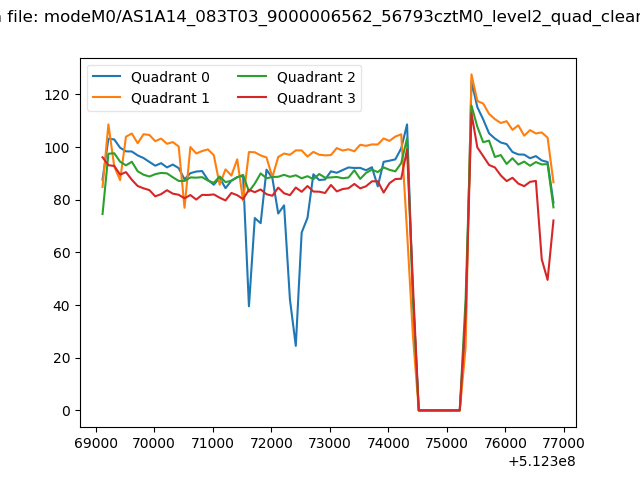 |
|
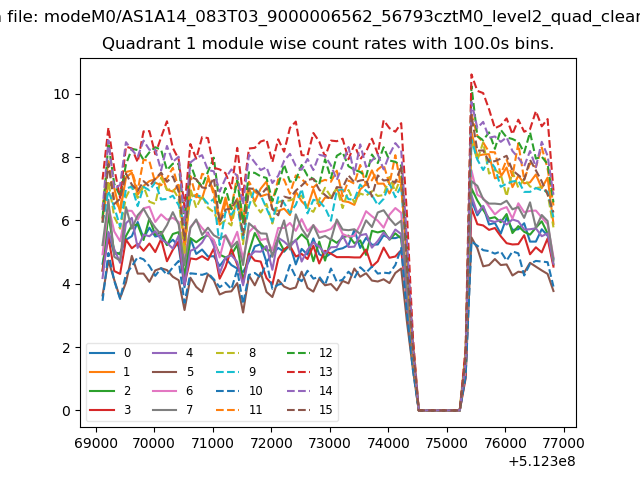
| Module-wise count rates for Quadrant A Data is divided into 100 sec bins |
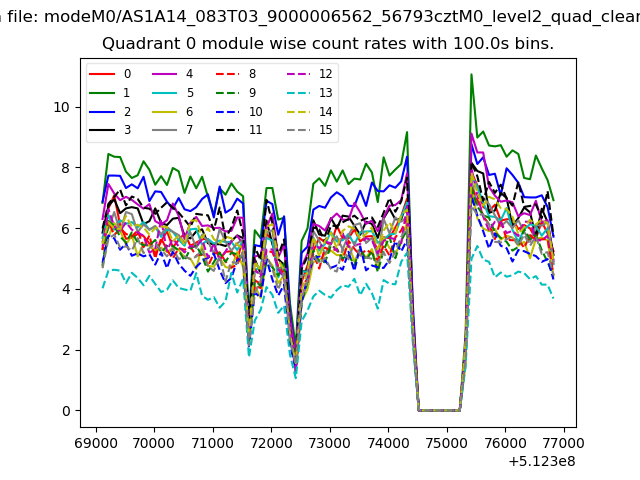 |
 |
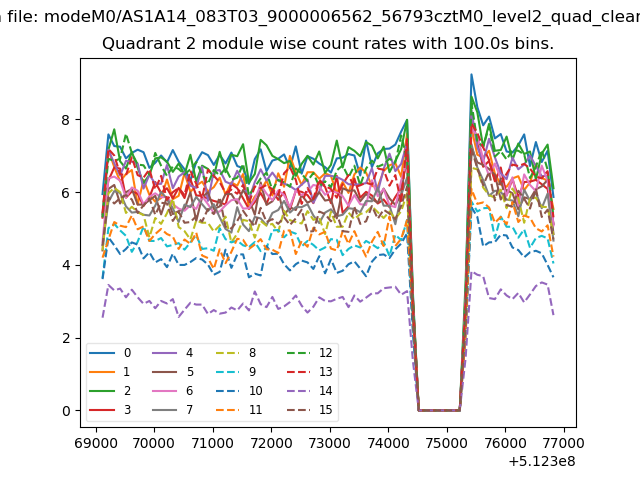
| Module-wise count rates for Quadrant B Data is divided into 100 sec bins |
 |
 |
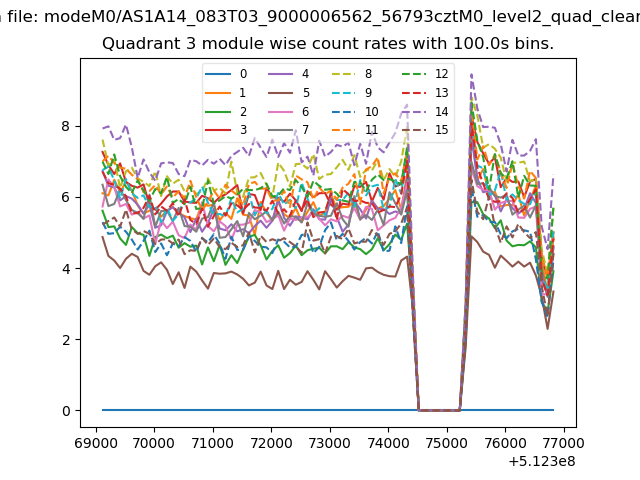
| Module-wise count rates for Quadrant C Data is divided into 100 sec bins |
 |
 |
| Module-wise count rates for Quadrant D Data is divided into 100 sec bins |
 |
 |
| Parameter | Plot |
|---|---|
| CZT HV Monitor | 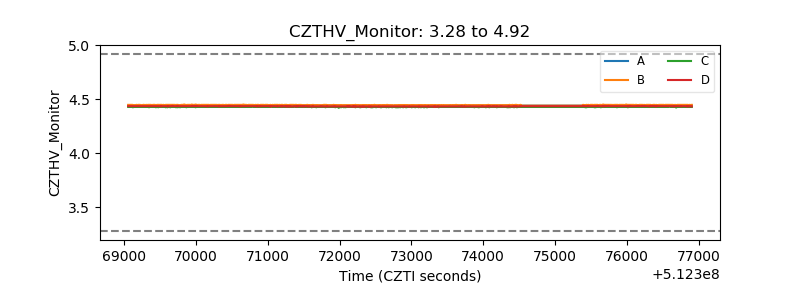 |
| D_VDD | 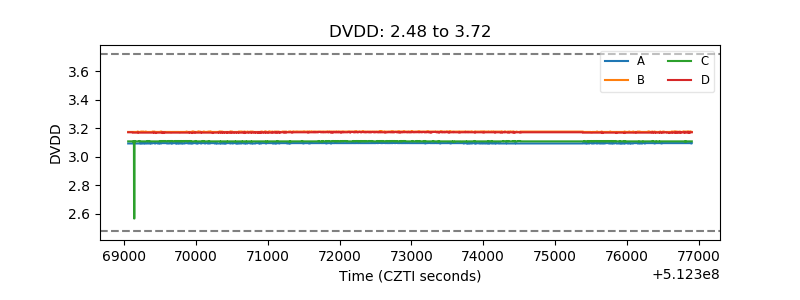 |
| Temperature 1 | 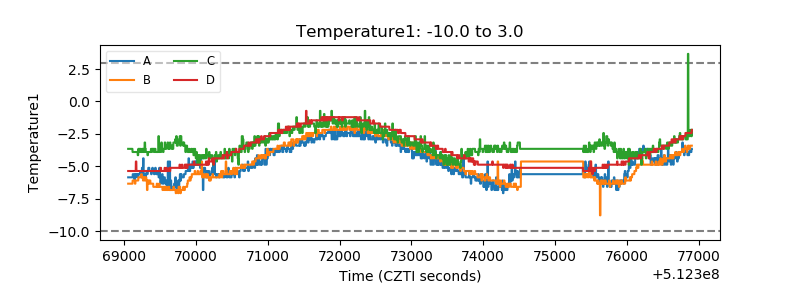 |
| Veto HV Monitor | 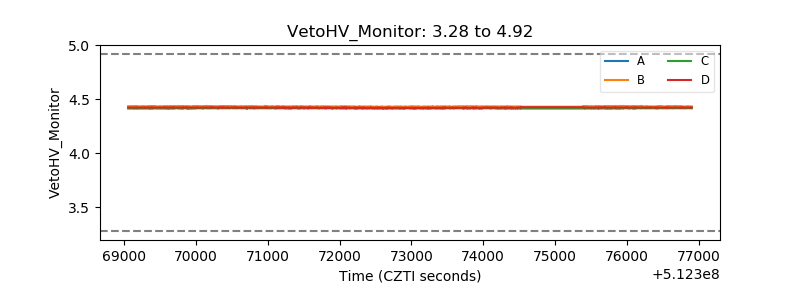 |
| Veto LLD | 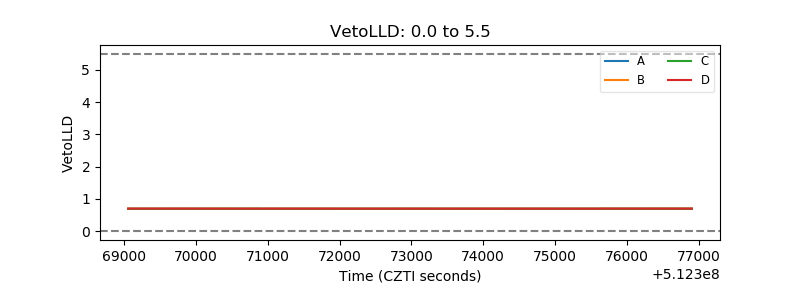 |
| Alpha Counter | 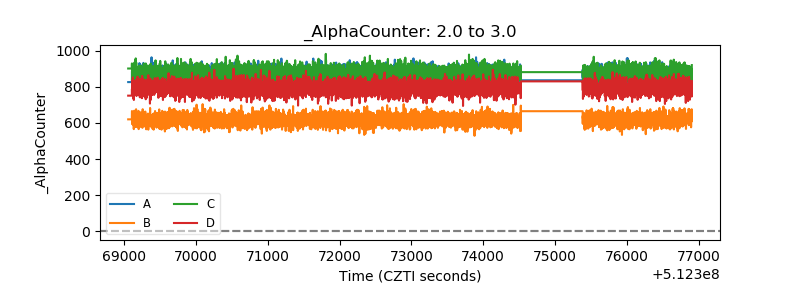 |
| _CPM_Rate | 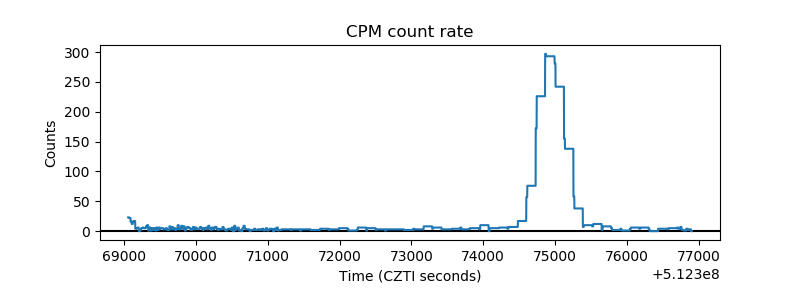 |
| CZT Counter | 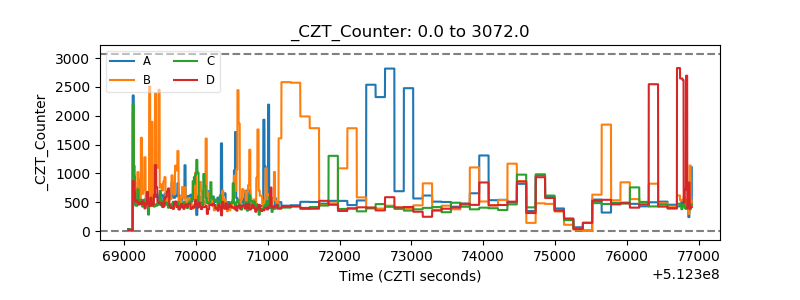 |
| +2.5 Volts monitor |  |
| +5 Volts monitor |  |
| _ROLL_ROT | 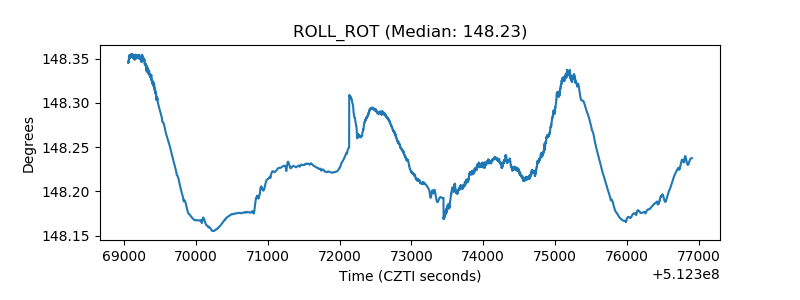 |
| _Roll_DEC | 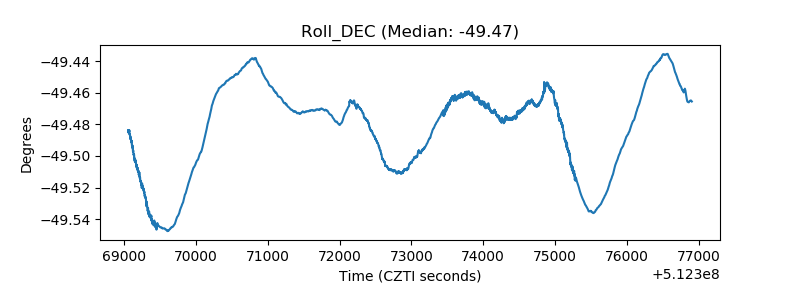 |
| _Roll_RA | 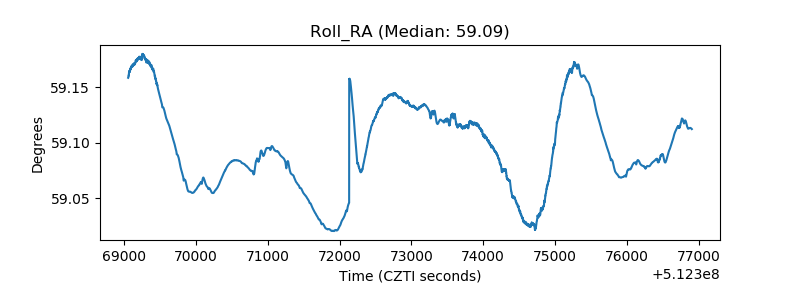 |
| Veto Counter | 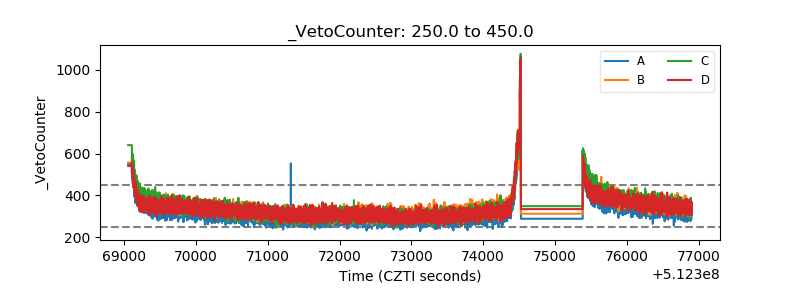 |