| Param | Original file | Final file |
|---|---|---|
| Filename | modeM0/AS1A14_083T03_9000006562_56796cztM0_level2.fits | modeM0/AS1A14_083T03_9000006562_56796cztM0_level2_quad_clean.evt |
| Size (bytes) | 455,878,080 | 98,349,120 |
| Size | 434.8 MB | 93.8 MB |
| Events in quadrant A | 3,267,238 | 661,743 |
| Events in quadrant B | 5,890,993 | 635,265 |
| Events in quadrant C | 3,436,782 | 626,731 |
| Events in quadrant D | 3,758,536 | 586,575 |
| Mode M9 | |||
|---|---|---|---|
| Quadrant | BADHDUFLAG | Total packets | Discarded packets |
| A | 0 | 10 | 0 |
| B | 0 | 10 | 0 |
| C | 0 | 10 | 0 |
| D | 0 | 10 | 0 |
| Mode SS | |||
|---|---|---|---|
| Quadrant | BADHDUFLAG | Total packets | Discarded packets |
| A | 0 | 138 | 0 |
| B | 0 | 138 | 0 |
| C | 0 | 138 | 0 |
| D | 0 | 138 | 0 |
| Mode M0 | |||
|---|---|---|---|
| Quadrant | BADHDUFLAG | Total packets | Discarded packets |
| A | 0 | 14510 | 1 |
| B | 0 | 21951 | 1 |
| C | 0 | 15141 | 1 |
| D | 0 | 15805 | 1 |
| Quadrant | Total seconds | Saturated seconds | Saturation percentage |
|---|---|---|---|
| A | 6701 | 140 | 2.089240% |
| B | 6702 | 1003 | 14.965682% |
| C | 6702 | 179 | 2.670845% |
| D | 6702 | 247 | 3.685467% |
Noise dominated data is calculated using 1-second bins in cleaned event files. If a bin has >2000 counts, and if more than 50% of those come from <1% of pixels, then it is considered to be noise-dominated and hence unusable.
| Quadrant | # 1 sec bins | Bins with >0 counts | Bins with >2000 counts | High rate bins dominated by noise | Noise dominated (total time) | Noise dominated (detector-on time) | Marked lightcurve |
|---|---|---|---|---|---|---|---|
| A | 7751 | 6701 | 65 | 65 | 0.84% | 0.97% | 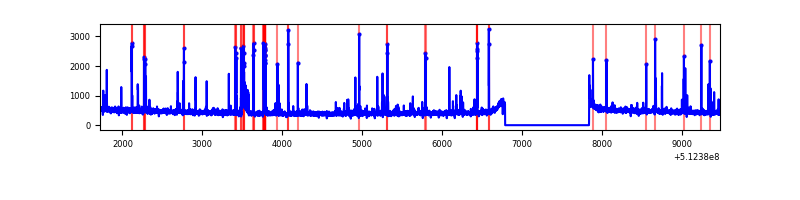 |
| B | 7752 | 6702 | 759 | 759 | 9.79% | 11.32% | 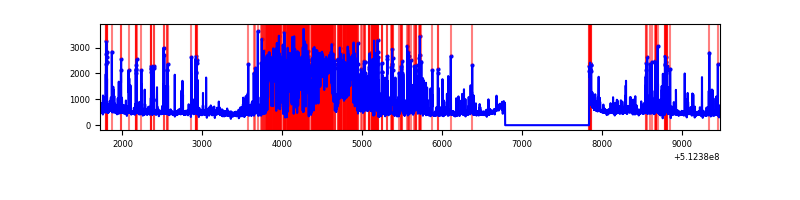 |
| C | 7752 | 6702 | 110 | 110 | 1.42% | 1.64% | 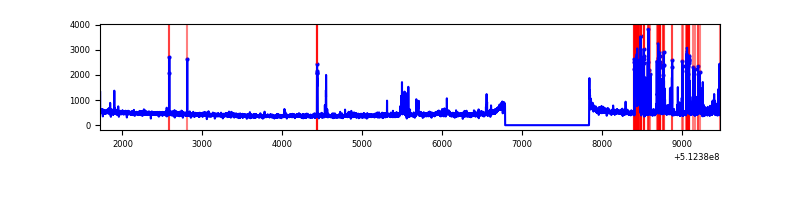 |
| D | 7752 | 6702 | 210 | 210 | 2.71% | 3.13% | 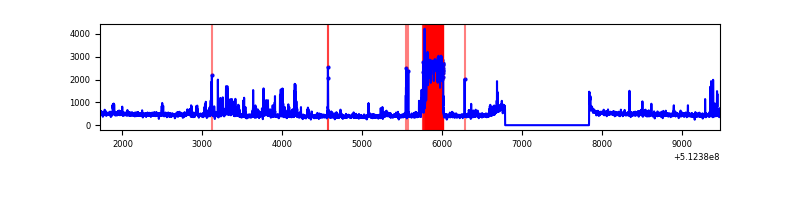 |
Top three noisy pixels from each quadrant. If the there are fewer than three noisy pixels in the level2.evt file, extra rows are filled as -1
| Pixel properties | Quadrant properties | ||||||
|---|---|---|---|---|---|---|---|
| Quadrant | DetID | PixID | Counts | Sigma | Mean | Median | Sigma |
| A | 10 | 251 | 167186 | 905.7 | 746 | 728 | 183.8 |
| A | 7 | 64 | 98382 | 531.34 | 746 | 728 | 183.8 |
| A | 5 | 242 | 73660 | 396.83 | 746 | 728 | 183.8 |
| B | 2 | 249 | 2366963 | 15967.62 | 688 | 663 | 148.2 |
| B | 4 | 206 | 357006 | 2404.58 | 688 | 663 | 148.2 |
| B | 8 | 128 | 98860 | 662.63 | 688 | 663 | 148.2 |
| C | 13 | 3 | 381758 | 1921.15 | 718 | 711 | 198.3 |
| C | 9 | 38 | 175018 | 878.82 | 718 | 711 | 198.3 |
| C | 14 | 254 | 33188 | 163.74 | 718 | 711 | 198.3 |
| D | 8 | 160 | 517423 | 2563.88 | 718 | 688 | 201.5 |
| D | 2 | 249 | 135699 | 669.88 | 718 | 688 | 201.5 |
| D | 8 | 240 | 122005 | 601.94 | 718 | 688 | 201.5 |
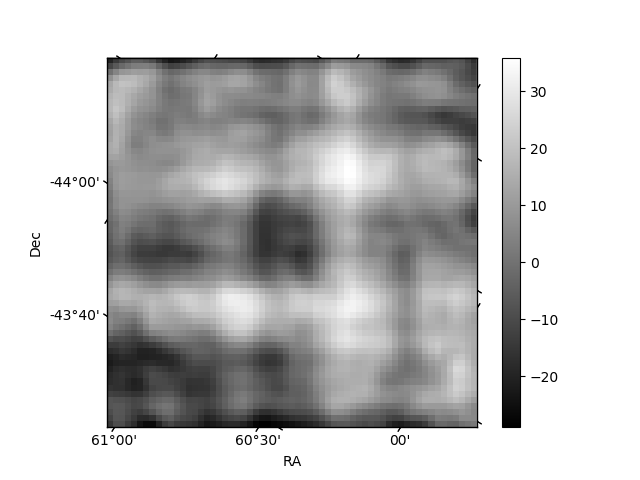
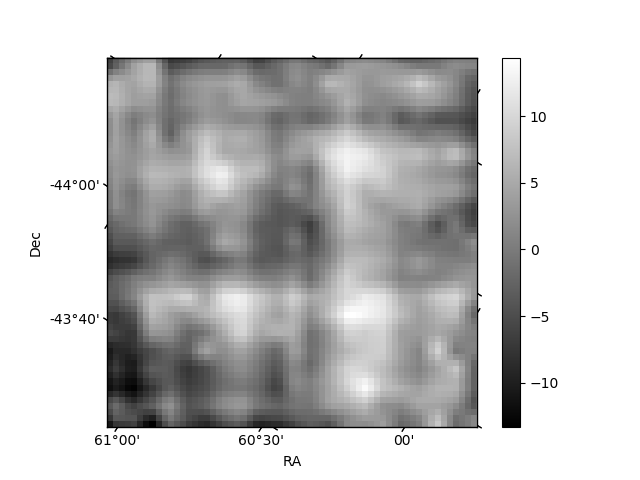
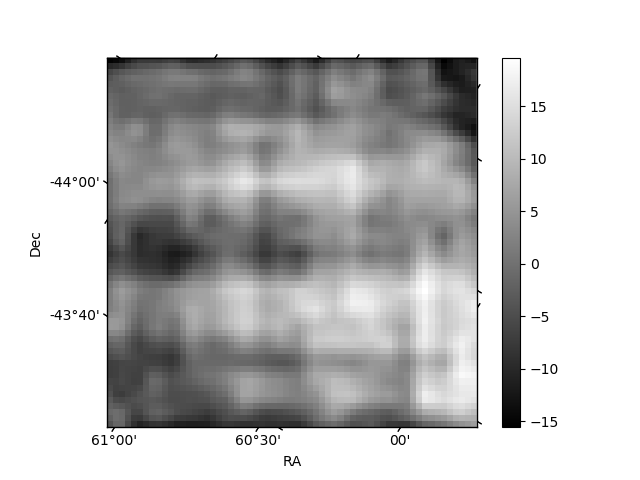
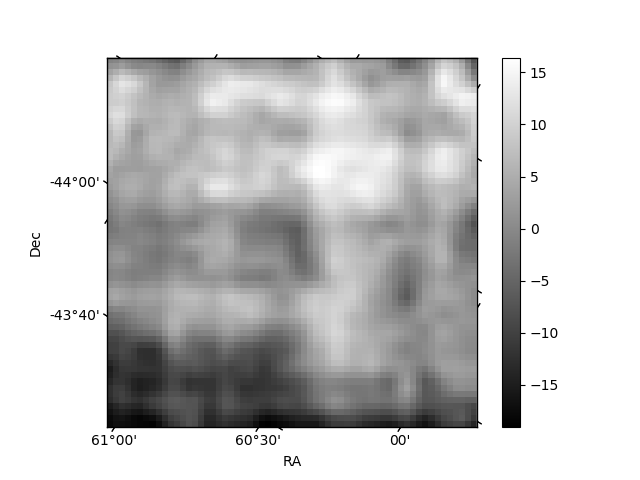
Histogram calculated using DETX and DETY for each event in the final _common_clean file
| Quadrant A | 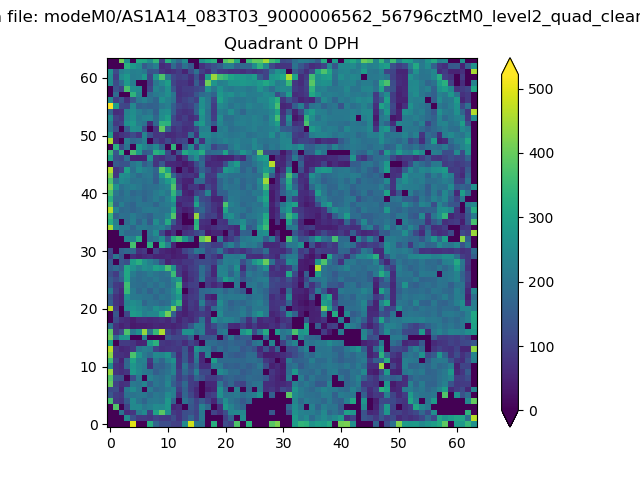 |
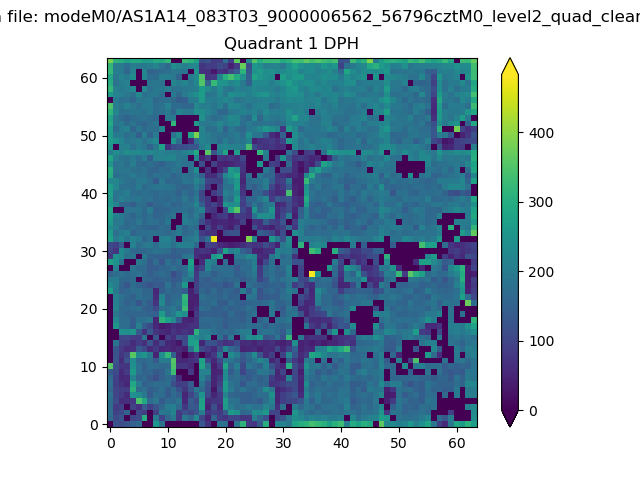 |
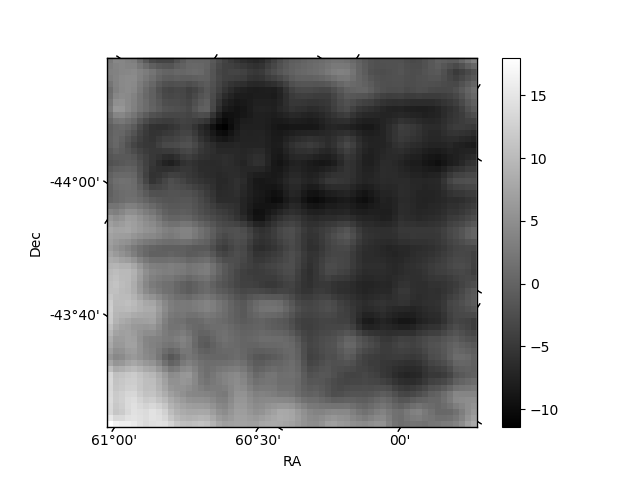
Quadrant B |
|---|---|---|---|
| Quadrant D | 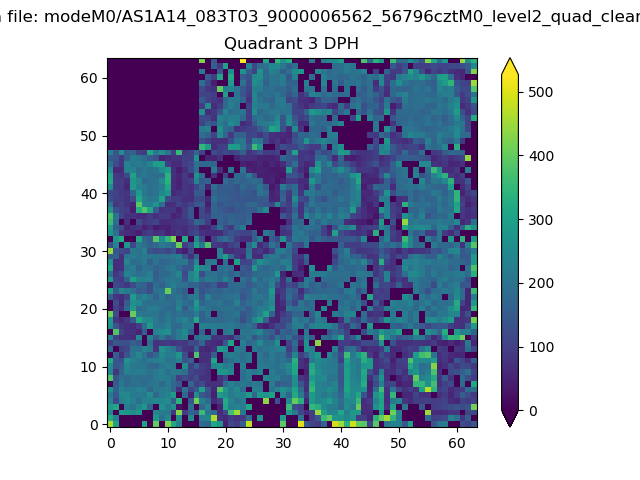 |
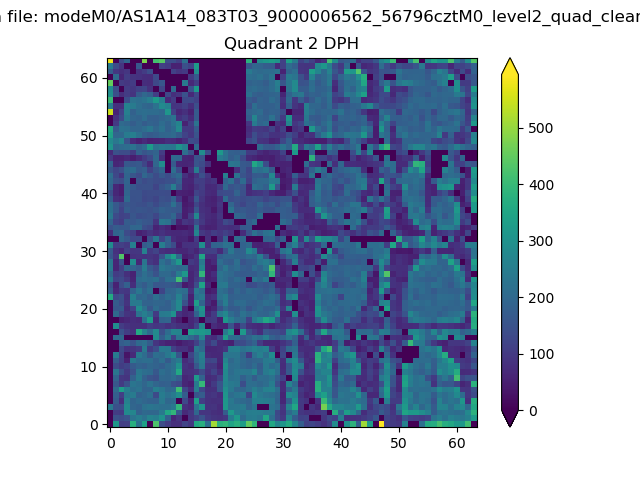 |
Quadrant C |
| Plot type | Count rate plots | Images |
|---|---|---|
| Comparison with Poisson distribution Blue bars denote a histogram of data divided into 1 sec bins. Red curve is a Poisson curve with rate = median count rate of data. |
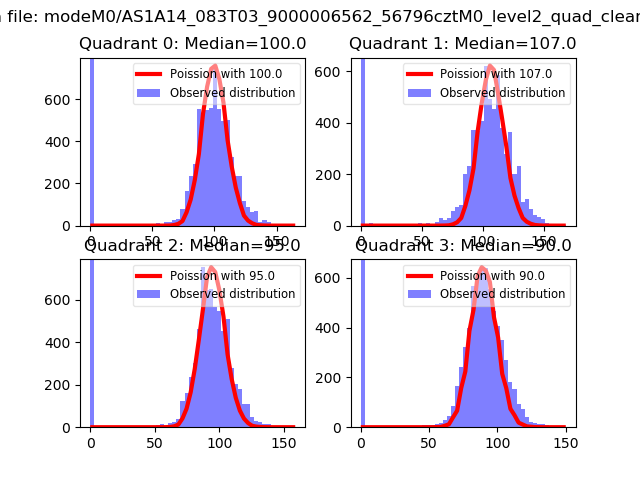 |
 |
| Quadrant-wise count rates Data is divided into 100 sec bins |
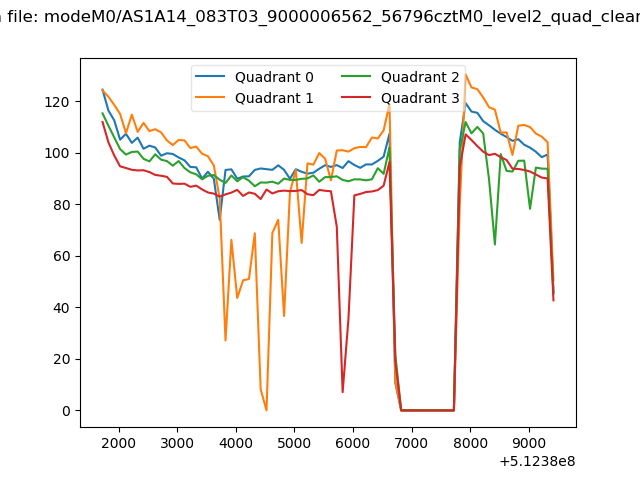 |
|
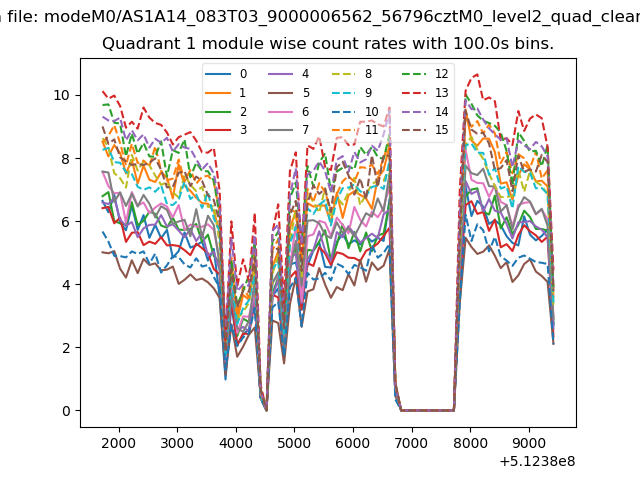
| Module-wise count rates for Quadrant A Data is divided into 100 sec bins |
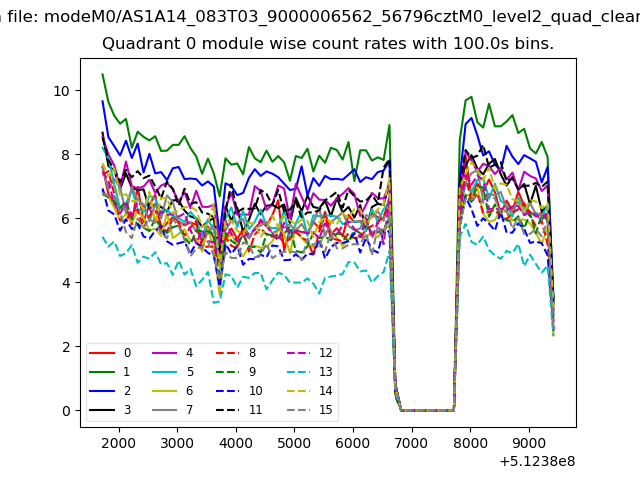 |
 |
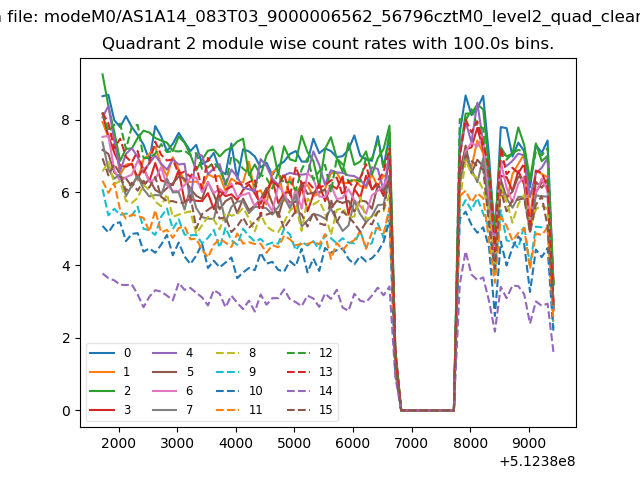
| Module-wise count rates for Quadrant B Data is divided into 100 sec bins |
 |
 |
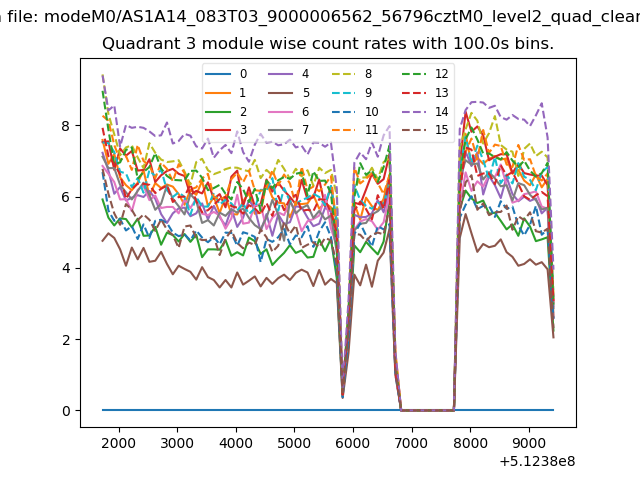
| Module-wise count rates for Quadrant C Data is divided into 100 sec bins |
 |
 |
| Module-wise count rates for Quadrant D Data is divided into 100 sec bins |
 |
 |
| Parameter | Plot |
|---|---|
| CZT HV Monitor | 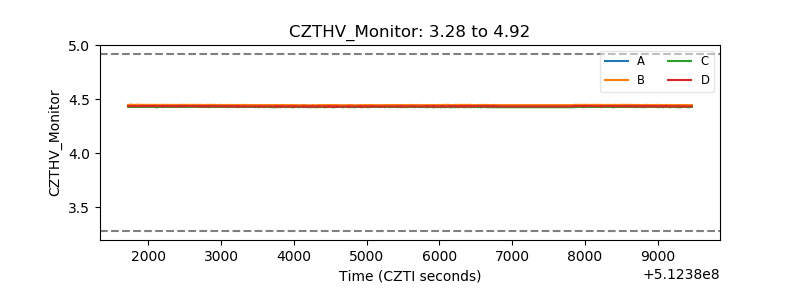 |
| D_VDD | 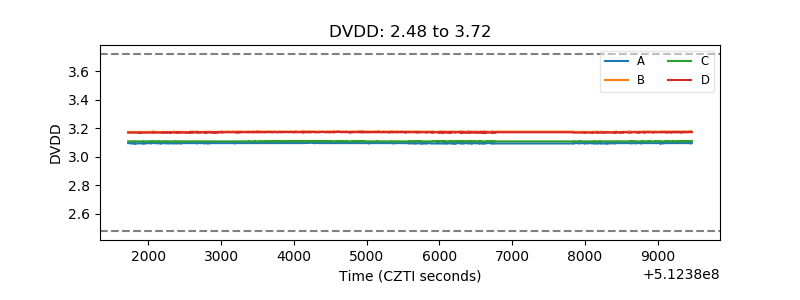 |
| Temperature 1 | 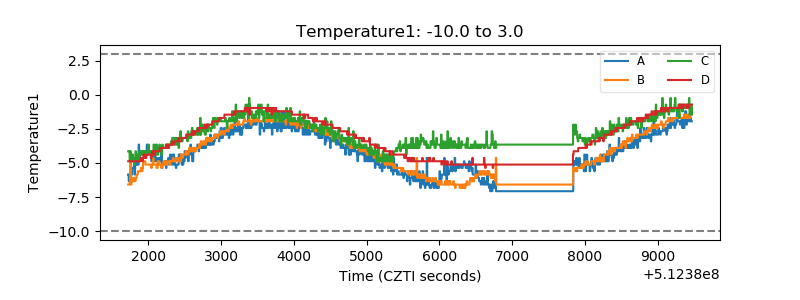 |
| Veto HV Monitor | 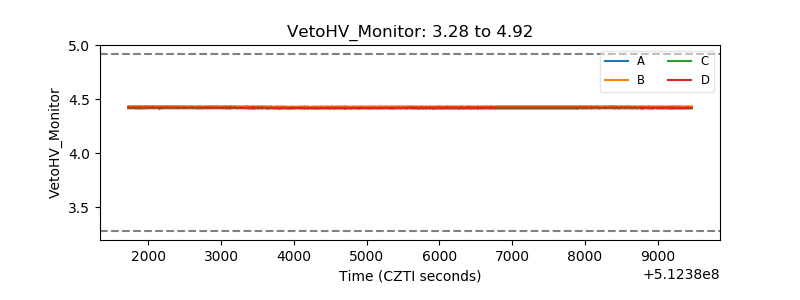 |
| Veto LLD | 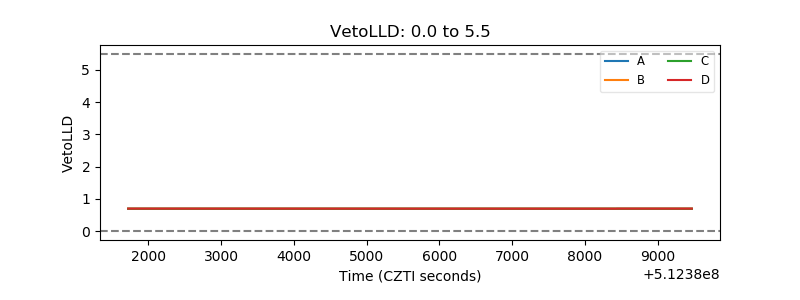 |
| Alpha Counter | 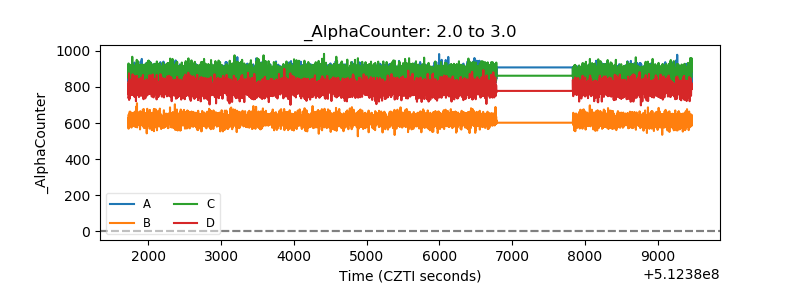 |
| _CPM_Rate | 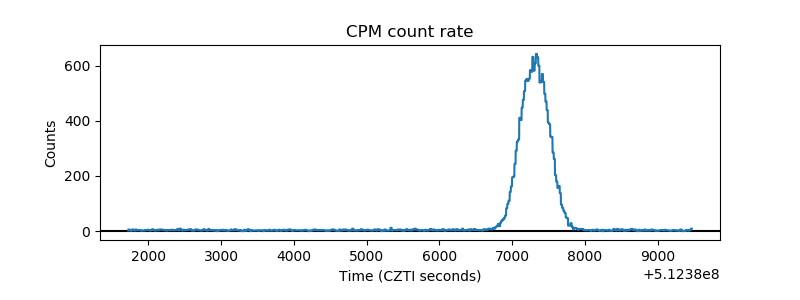 |
| CZT Counter | 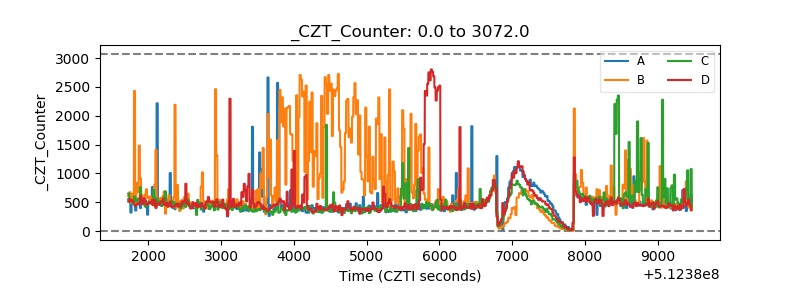 |
| +2.5 Volts monitor |  |
| +5 Volts monitor |  |
| _ROLL_ROT | 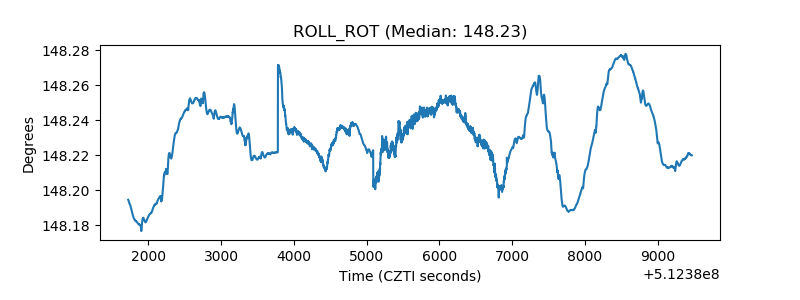 |
| _Roll_DEC | 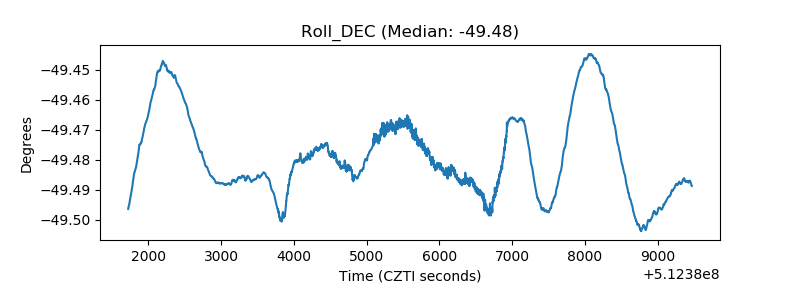 |
| _Roll_RA | 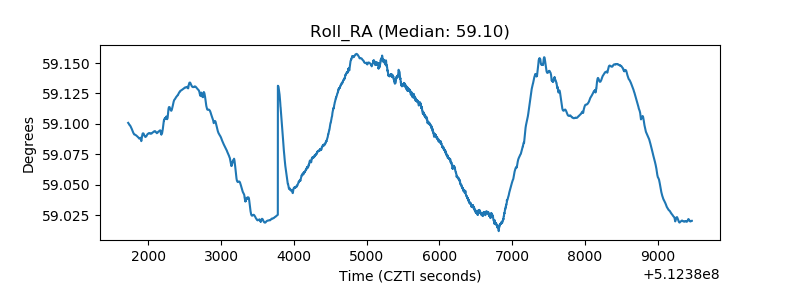 |
| Veto Counter | 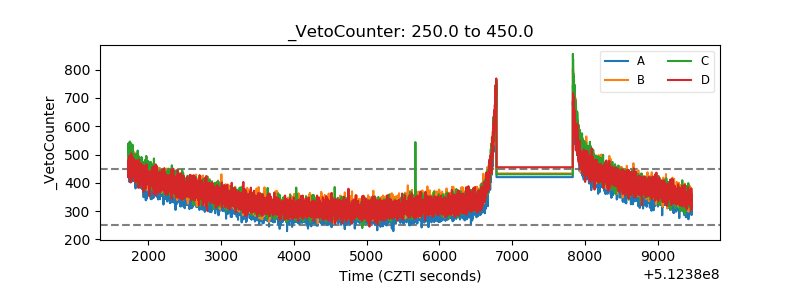 |