| Param | Original file | Final file |
|---|---|---|
| Filename | modeM0/AS1A14_083T03_9000006562_56797cztM0_level2.fits | modeM0/AS1A14_083T03_9000006562_56797cztM0_level2_quad_clean.evt |
| Size (bytes) | 535,734,720 | 96,520,320 |
| Size | 510.9 MB | 92.0 MB |
| Events in quadrant A | 3,212,619 | 667,371 |
| Events in quadrant B | 4,762,400 | 680,077 |
| Events in quadrant C | 7,743,295 | 509,960 |
| Events in quadrant D | 3,592,114 | 598,261 |
| Mode M9 | |||
|---|---|---|---|
| Quadrant | BADHDUFLAG | Total packets | Discarded packets |
| A | 0 | 11 | 0 |
| B | 0 | 11 | 0 |
| C | 0 | 11 | 0 |
| D | 0 | 11 | 0 |
| Mode SS | |||
|---|---|---|---|
| Quadrant | BADHDUFLAG | Total packets | Discarded packets |
| A | 0 | 136 | 0 |
| B | 0 | 136 | 0 |
| C | 0 | 136 | 0 |
| D | 0 | 136 | 0 |
| Mode M0 | |||
|---|---|---|---|
| Quadrant | BADHDUFLAG | Total packets | Discarded packets |
| A | 0 | 14380 | 1 |
| B | 0 | 18796 | 1 |
| C | 0 | 27580 | 2 |
| D | 0 | 15265 | 1 |
| Quadrant | Total seconds | Saturated seconds | Saturation percentage |
|---|---|---|---|
| A | 6697 | 117 | 1.747051% |
| B | 6698 | 539 | 8.047178% |
| C | 6697 | 1597 | 23.846498% |
| D | 6697 | 143 | 2.135284% |
Noise dominated data is calculated using 1-second bins in cleaned event files. If a bin has >2000 counts, and if more than 50% of those come from <1% of pixels, then it is considered to be noise-dominated and hence unusable.
| Quadrant | # 1 sec bins | Bins with >0 counts | Bins with >2000 counts | High rate bins dominated by noise | Noise dominated (total time) | Noise dominated (detector-on time) | Marked lightcurve |
|---|---|---|---|---|---|---|---|
| A | 7802 | 6697 | 40 | 40 | 0.51% | 0.60% | 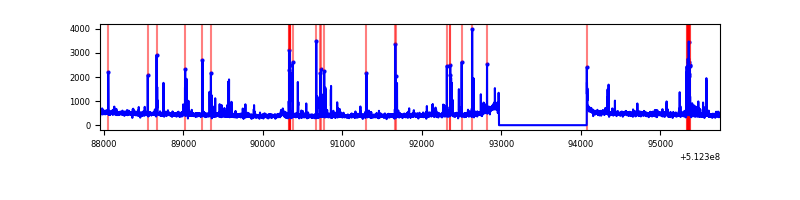 |
| B | 7803 | 6698 | 266 | 266 | 3.41% | 3.97% | 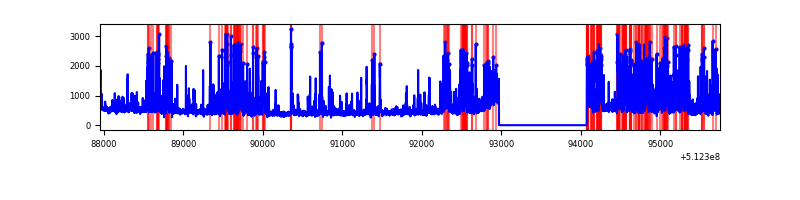 |
| C | 7801 | 6696 | 1557 | 1557 | 19.96% | 23.25% | 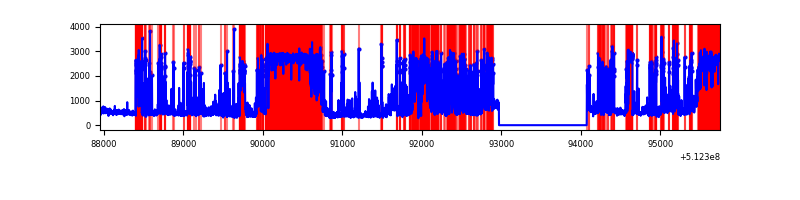 |
| D | 7802 | 6697 | 100 | 100 | 1.28% | 1.49% | 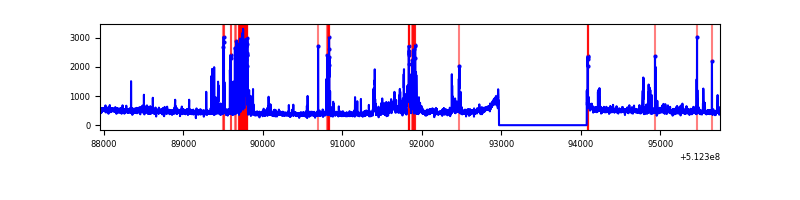 |
Top three noisy pixels from each quadrant. If the there are fewer than three noisy pixels in the level2.evt file, extra rows are filled as -1
| Pixel properties | Quadrant properties | ||||||
|---|---|---|---|---|---|---|---|
| Quadrant | DetID | PixID | Counts | Sigma | Mean | Median | Sigma |
| A | 10 | 251 | 237304 | 1300.45 | 745 | 730 | 181.9 |
| A | 7 | 255 | 42377 | 228.93 | 745 | 730 | 181.9 |
| A | 3 | 62 | 19501 | 103.18 | 745 | 730 | 181.9 |
| B | 4 | 206 | 981055 | 6414.51 | 711 | 684 | 152.8 |
| B | 2 | 249 | 299870 | 1957.56 | 711 | 684 | 152.8 |
| B | 8 | 128 | 286069 | 1867.26 | 711 | 684 | 152.8 |
| C | 15 | 230 | 2254083 | 12758.27 | 642 | 633 | 176.6 |
| C | 13 | 3 | 2088379 | 11820.11 | 642 | 633 | 176.6 |
| C | 9 | 38 | 453642 | 2564.78 | 642 | 633 | 176.6 |
| D | 2 | 249 | 335620 | 1673.81 | 719 | 688 | 200.1 |
| D | 2 | 31 | 120190 | 597.21 | 719 | 688 | 200.1 |
| D | 8 | 160 | 107832 | 535.45 | 719 | 688 | 200.1 |
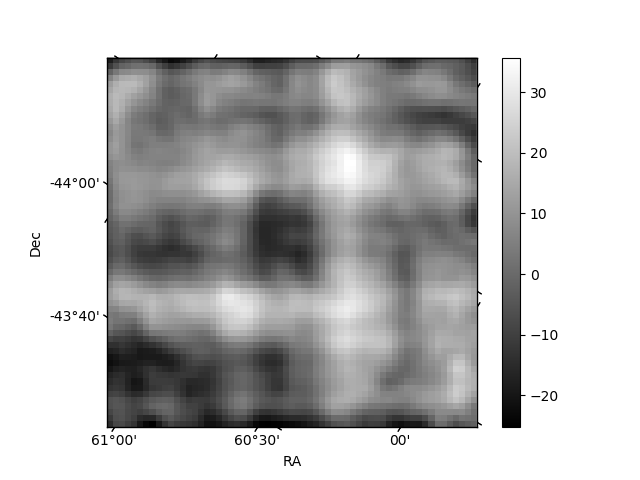
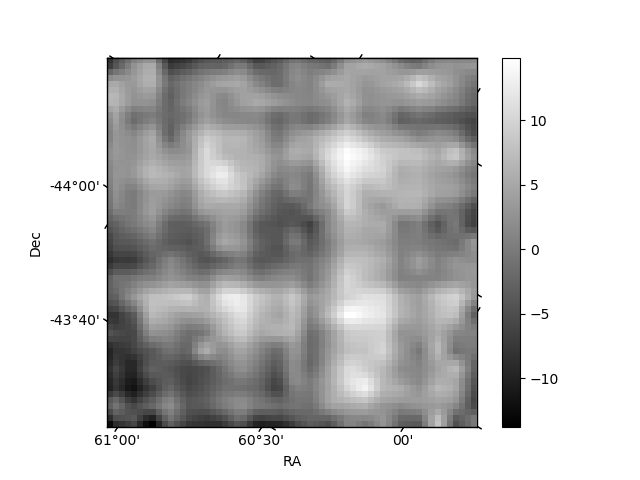
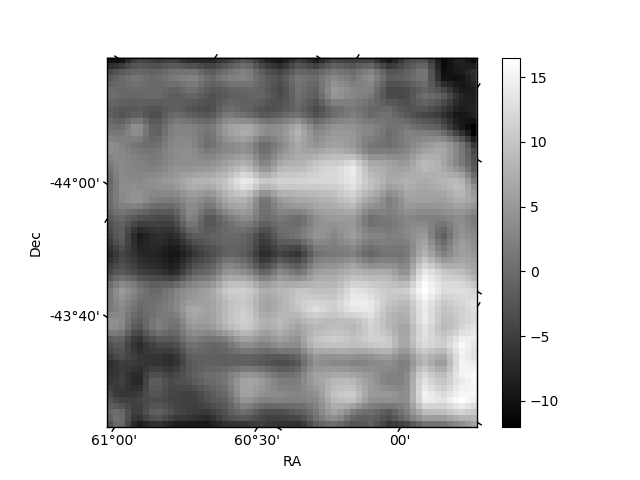
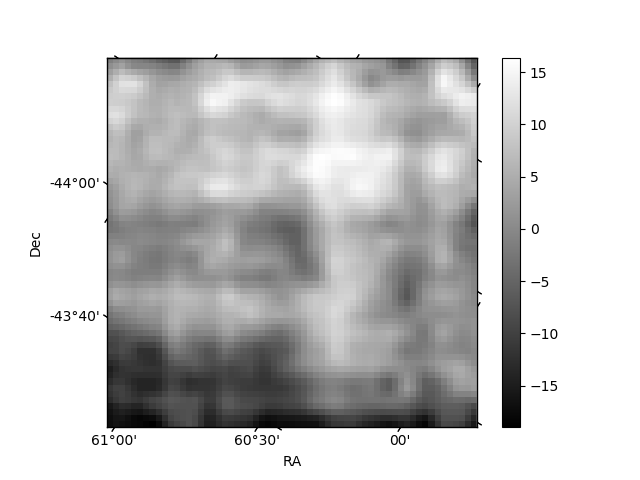
Histogram calculated using DETX and DETY for each event in the final _common_clean file
| Quadrant A | 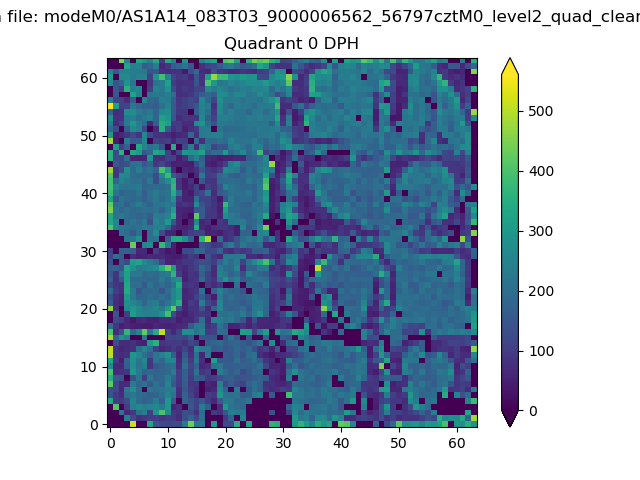 |
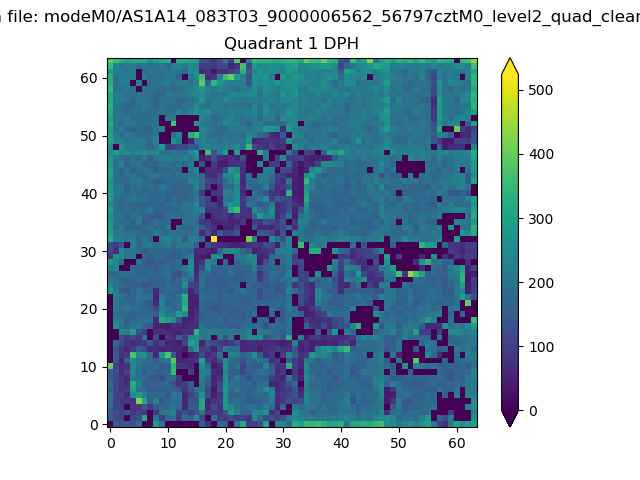 |
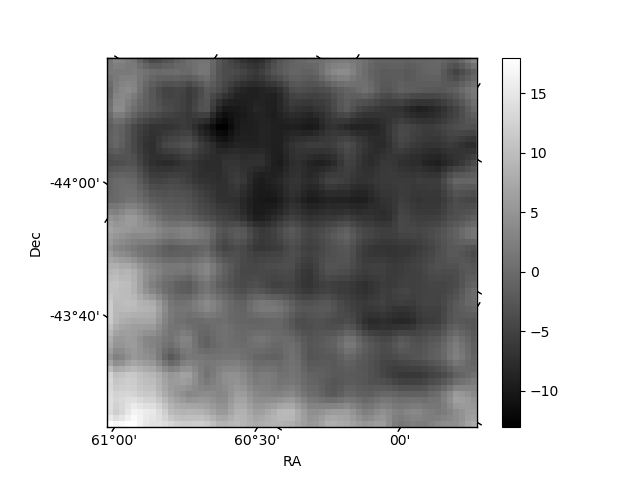
Quadrant B |
|---|---|---|---|
| Quadrant D | 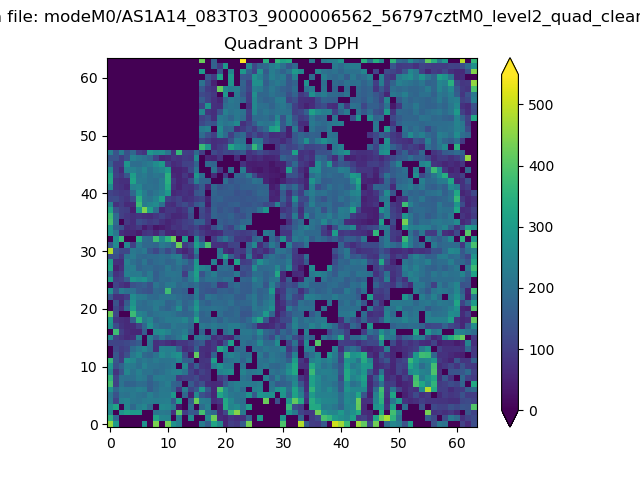 |
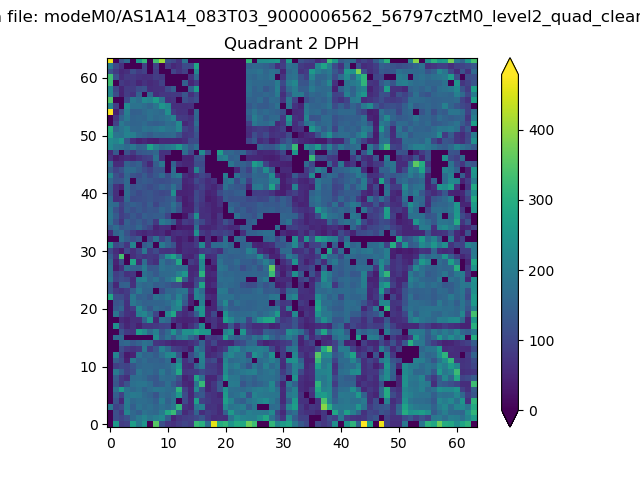 |
Quadrant C |
| Plot type | Count rate plots | Images |
|---|---|---|
| Comparison with Poisson distribution Blue bars denote a histogram of data divided into 1 sec bins. Red curve is a Poisson curve with rate = median count rate of data. |
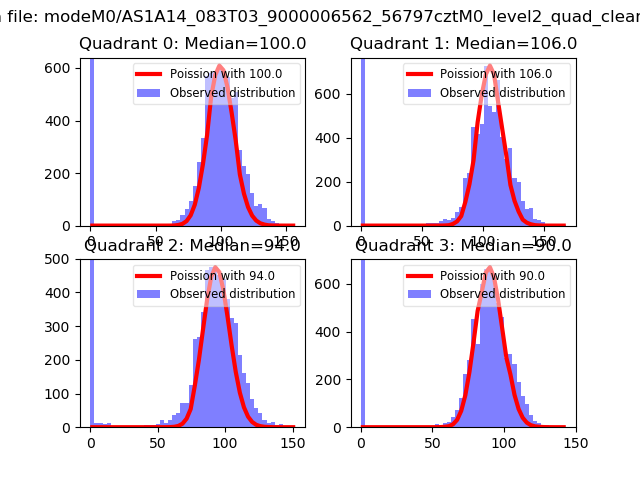 |
 |
| Quadrant-wise count rates Data is divided into 100 sec bins |
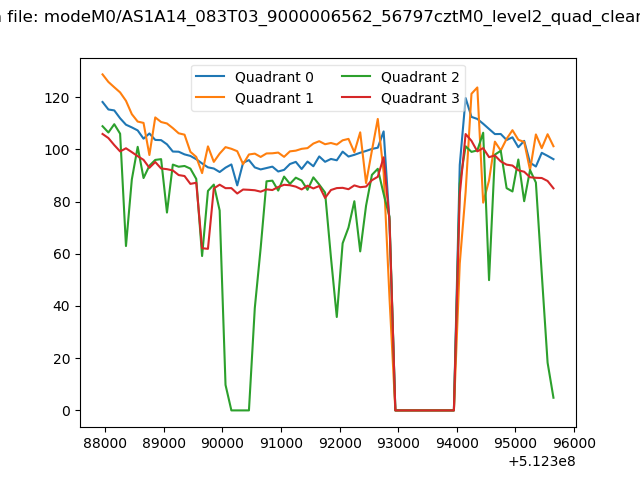 |
|
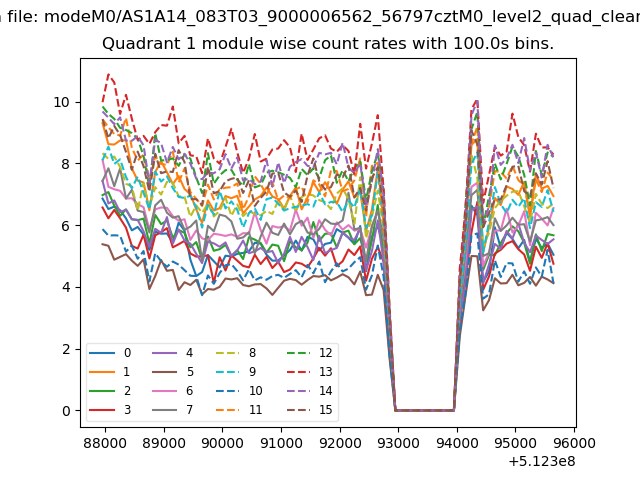
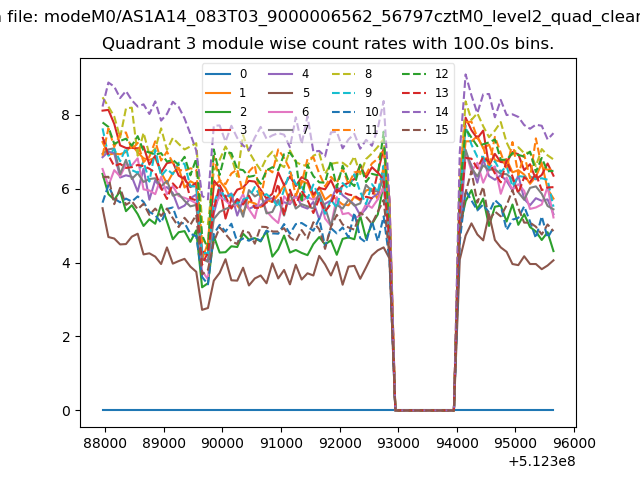
| Module-wise count rates for Quadrant A Data is divided into 100 sec bins |
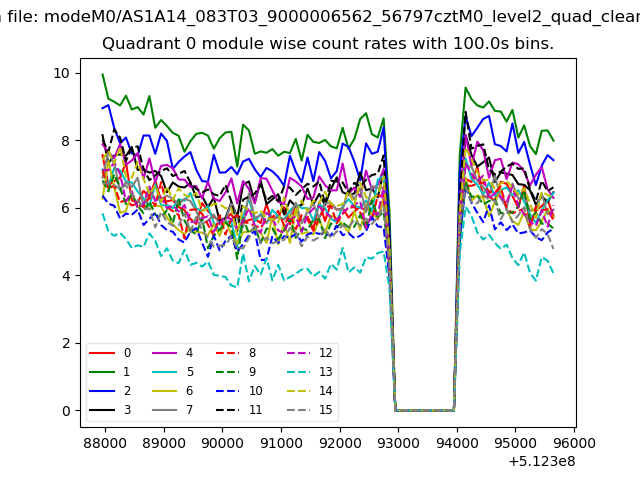 |
 |
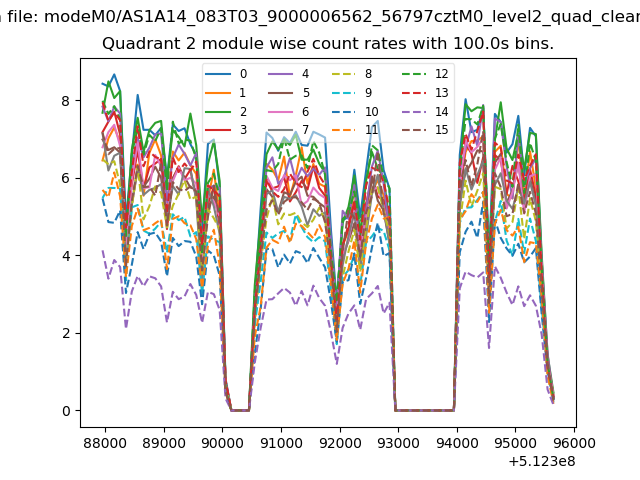
| Module-wise count rates for Quadrant B Data is divided into 100 sec bins |
 |
 |
| Module-wise count rates for Quadrant C Data is divided into 100 sec bins |
 |
 |
| Module-wise count rates for Quadrant D Data is divided into 100 sec bins |
 |
 |
| Parameter | Plot |
|---|---|
| CZT HV Monitor | 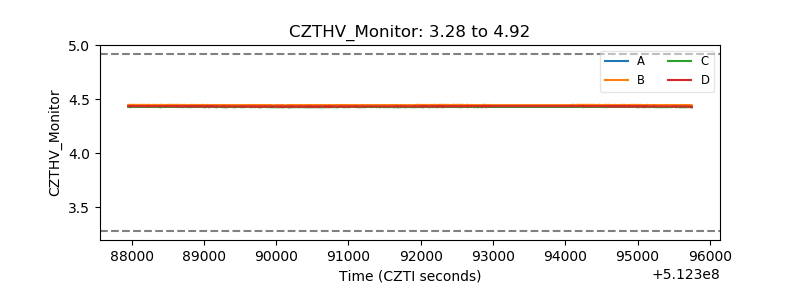 |
| D_VDD | 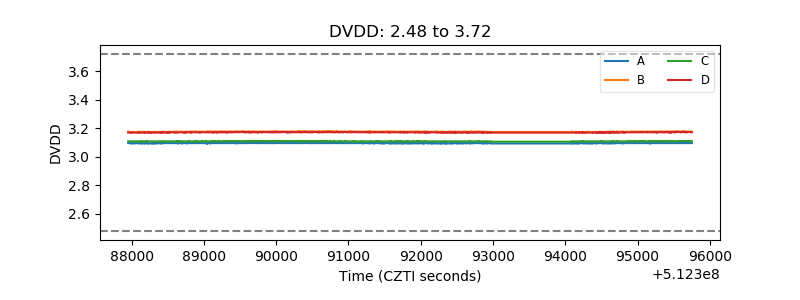 |
| Temperature 1 | 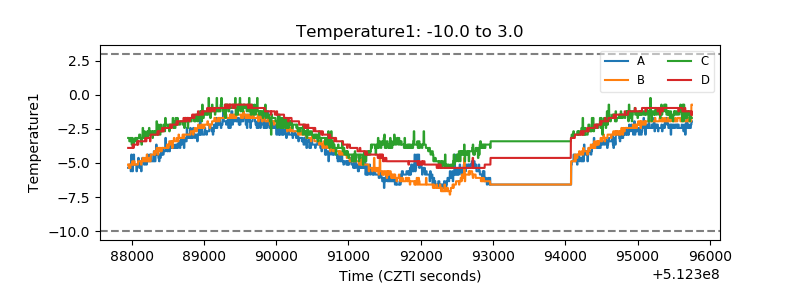 |
| Veto HV Monitor | 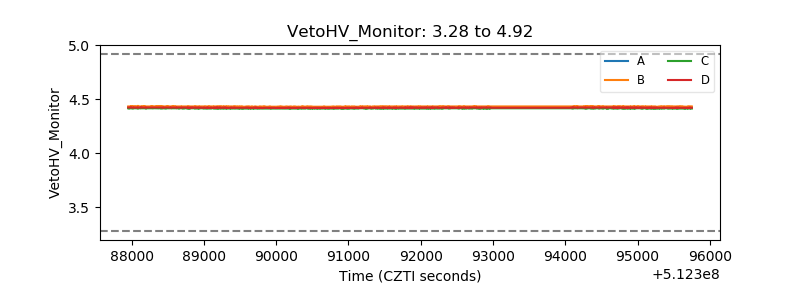 |
| Veto LLD | 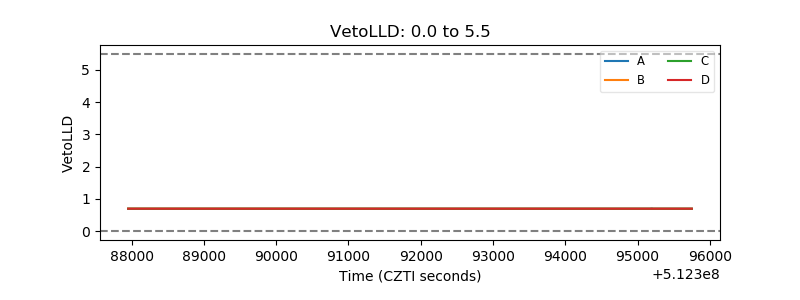 |
| Alpha Counter | 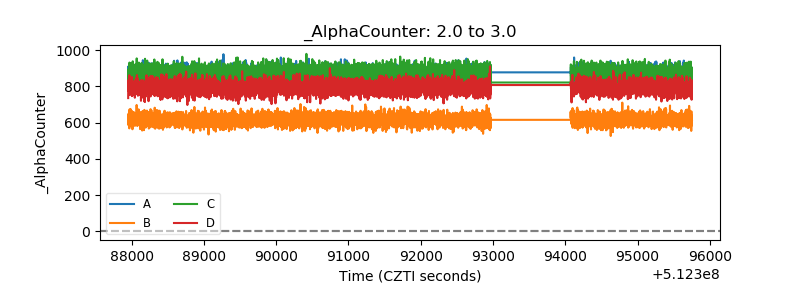 |
| _CPM_Rate | 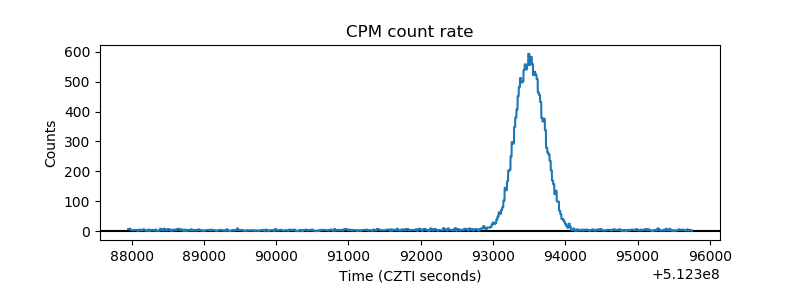 |
| CZT Counter | 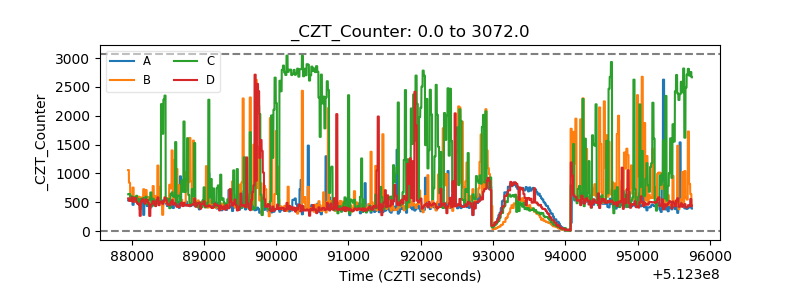 |
| +2.5 Volts monitor |  |
| +5 Volts monitor |  |
| _ROLL_ROT | 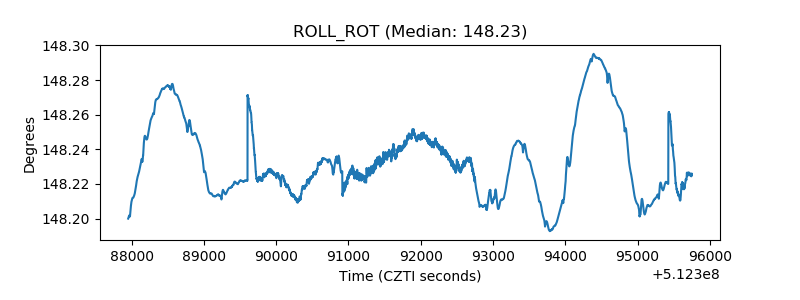 |
| _Roll_DEC | 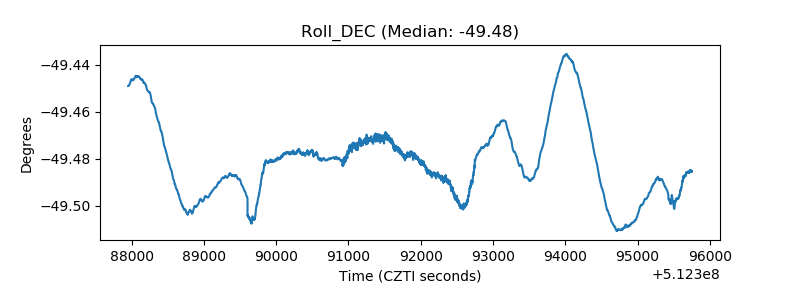 |
| _Roll_RA | 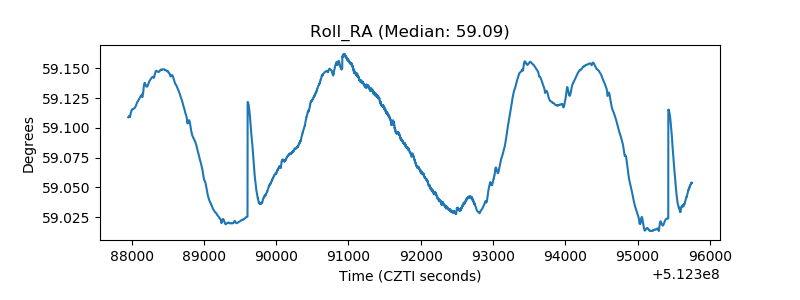 |
| Veto Counter | 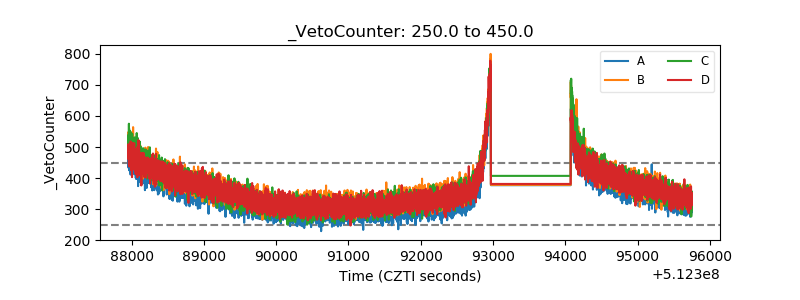 |