| Param | Original file | Final file |
|---|---|---|
| Filename | modeM0/AS1A14_083T03_9000006562_56798cztM0_level2.fits | modeM0/AS1A14_083T03_9000006562_56798cztM0_level2_quad_clean.evt |
| Size (bytes) | 509,520,960 | 82,906,560 |
| Size | 485.9 MB | 79.1 MB |
| Events in quadrant A | 2,905,501 | 578,067 |
| Events in quadrant B | 4,531,073 | 590,785 |
| Events in quadrant C | 8,059,247 | 396,793 |
| Events in quadrant D | 2,898,481 | 525,898 |
| Mode M9 | |||
|---|---|---|---|
| Quadrant | BADHDUFLAG | Total packets | Discarded packets |
| A | 0 | 11 | 0 |
| B | 0 | 11 | 0 |
| C | 0 | 11 | 0 |
| D | 0 | 11 | 0 |
| Mode SS | |||
|---|---|---|---|
| Quadrant | BADHDUFLAG | Total packets | Discarded packets |
| A | 0 | 122 | 0 |
| B | 0 | 122 | 0 |
| C | 0 | 122 | 0 |
| D | 0 | 122 | 0 |
| Mode M0 | |||
|---|---|---|---|
| Quadrant | BADHDUFLAG | Total packets | Discarded packets |
| A | 0 | 13111 | 1 |
| B | 0 | 17655 | 1 |
| C | 0 | 28069 | 1 |
| D | 0 | 12927 | 1 |
| Quadrant | Total seconds | Saturated seconds | Saturation percentage |
|---|---|---|---|
| A | 5994 | 155 | 2.585919% |
| B | 5994 | 526 | 8.775442% |
| C | 5995 | 1952 | 32.560467% |
| D | 5995 | 76 | 1.267723% |
Noise dominated data is calculated using 1-second bins in cleaned event files. If a bin has >2000 counts, and if more than 50% of those come from <1% of pixels, then it is considered to be noise-dominated and hence unusable.
| Quadrant | # 1 sec bins | Bins with >0 counts | Bins with >2000 counts | High rate bins dominated by noise | Noise dominated (total time) | Noise dominated (detector-on time) | Marked lightcurve |
|---|---|---|---|---|---|---|---|
| A | 7064 | 5994 | 74 | 74 | 1.05% | 1.23% | 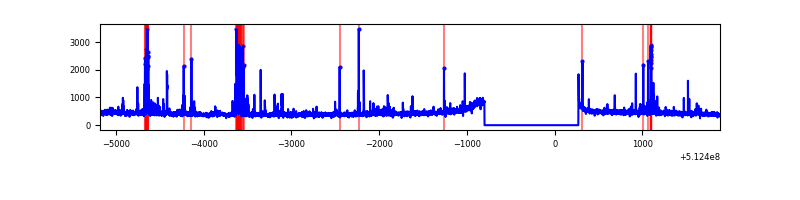 |
| B | 7064 | 5994 | 309 | 309 | 4.37% | 5.16% | 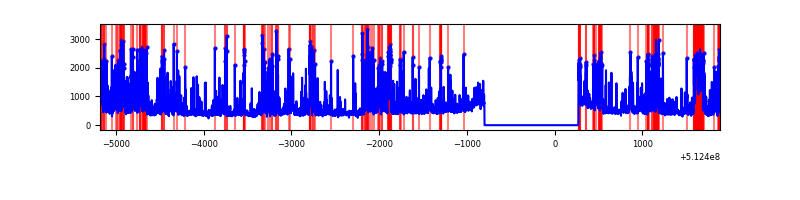 |
| C | 7064 | 5994 | 1934 | 1934 | 27.38% | 32.27% | 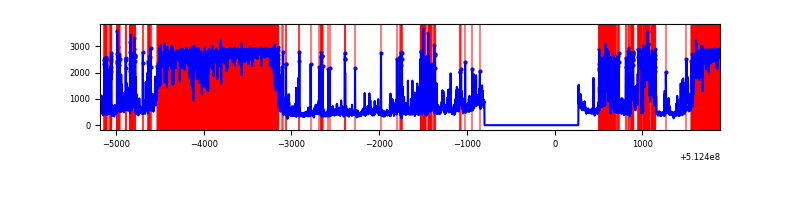 |
| D | 7065 | 5995 | 27 | 27 | 0.38% | 0.45% | 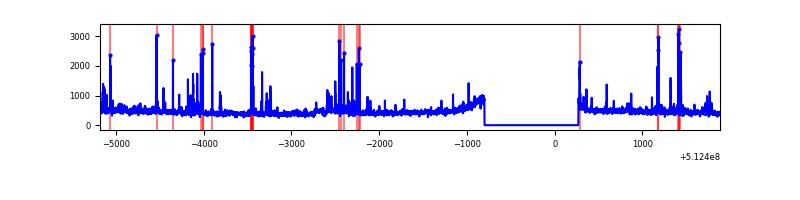 |
Top three noisy pixels from each quadrant. If the there are fewer than three noisy pixels in the level2.evt file, extra rows are filled as -1
| Pixel properties | Quadrant properties | ||||||
|---|---|---|---|---|---|---|---|
| Quadrant | DetID | PixID | Counts | Sigma | Mean | Median | Sigma |
| A | 10 | 251 | 190039 | 1176.3 | 651 | 634 | 161.0 |
| A | 3 | 62 | 138772 | 857.9 | 651 | 634 | 161.0 |
| A | 14 | 235 | 15280 | 90.96 | 651 | 634 | 161.0 |
| B | 4 | 206 | 1020255 | 7624.57 | 624 | 601 | 133.7 |
| B | 8 | 128 | 325675 | 2430.77 | 624 | 601 | 133.7 |
| B | 2 | 249 | 245159 | 1828.71 | 624 | 601 | 133.7 |
| C | 15 | 230 | 3910320 | 26628.46 | 535 | 530 | 146.8 |
| C | 13 | 3 | 1715144 | 11677.74 | 535 | 530 | 146.8 |
| C | 9 | 38 | 183886 | 1248.79 | 535 | 530 | 146.8 |
| D | 2 | 249 | 112751 | 634.69 | 628 | 600 | 176.7 |
| D | 3 | 176 | 75647 | 424.71 | 628 | 600 | 176.7 |
| D | 10 | 199 | 72568 | 407.29 | 628 | 600 | 176.7 |
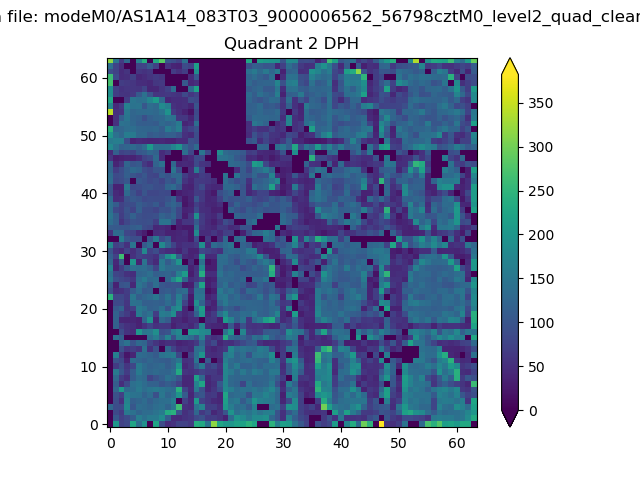
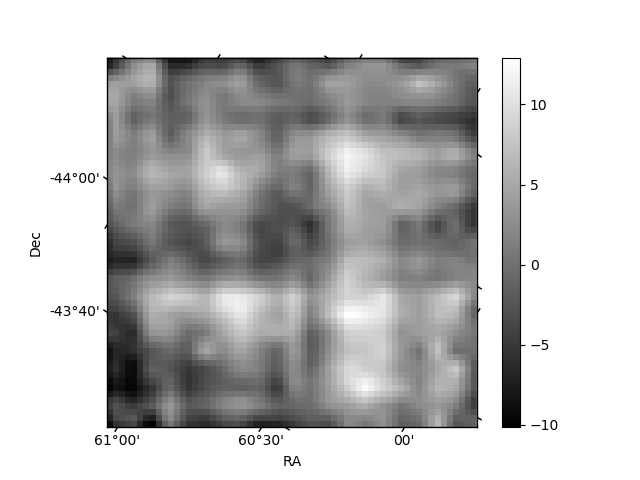
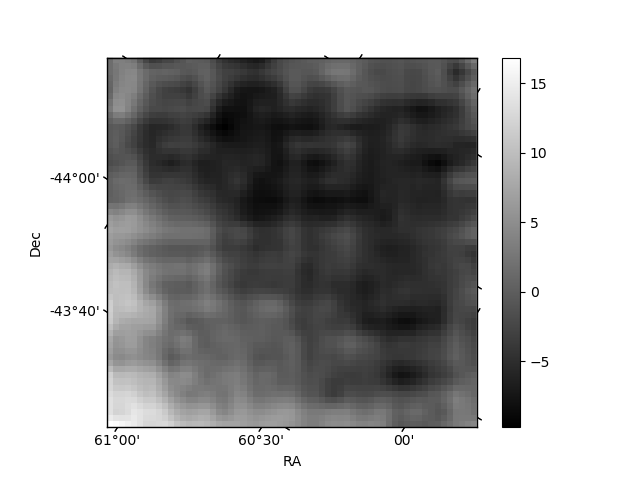
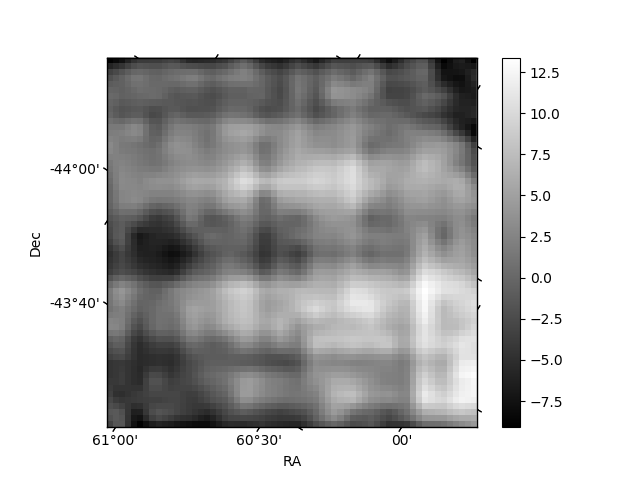
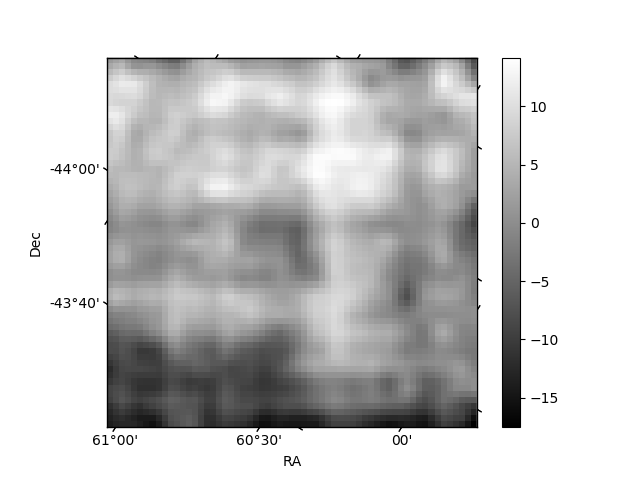
Histogram calculated using DETX and DETY for each event in the final _common_clean file
| Quadrant A | 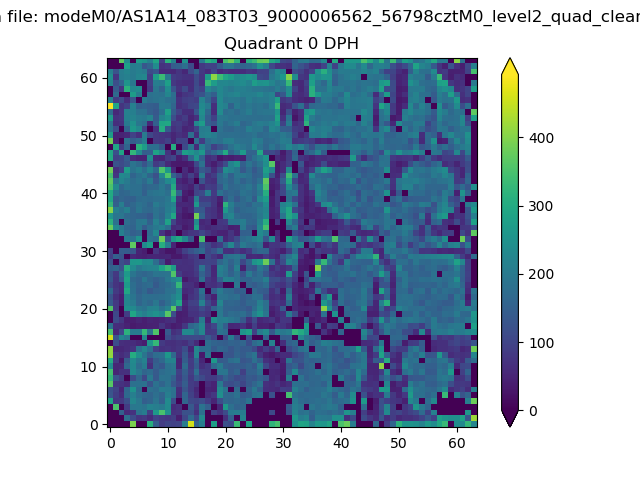 |
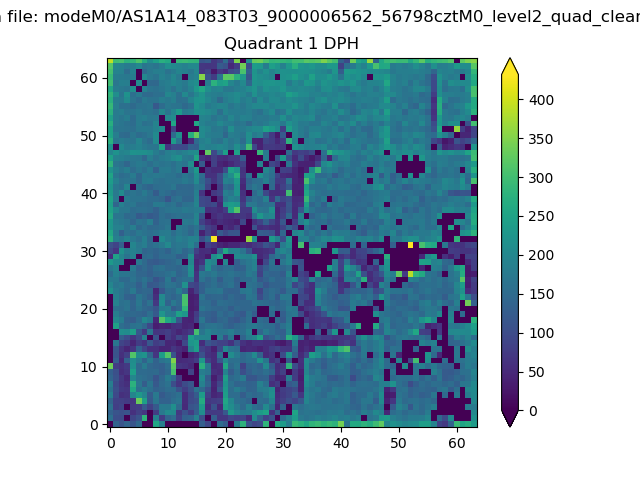 |
Quadrant B |
|---|---|---|---|
| Quadrant D | 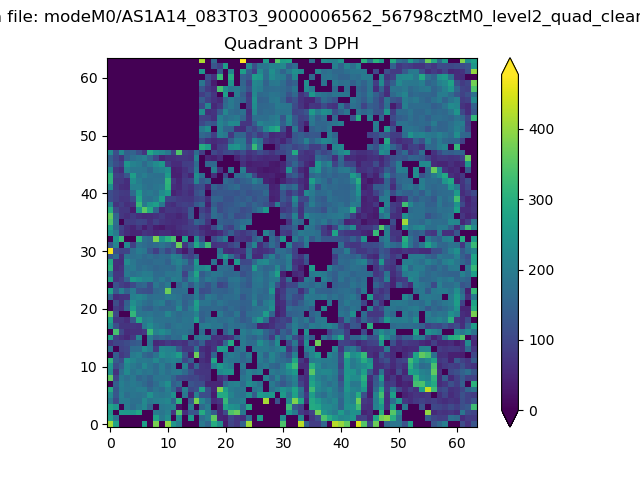 |
 |
Quadrant C |
| Plot type | Count rate plots | Images |
|---|---|---|
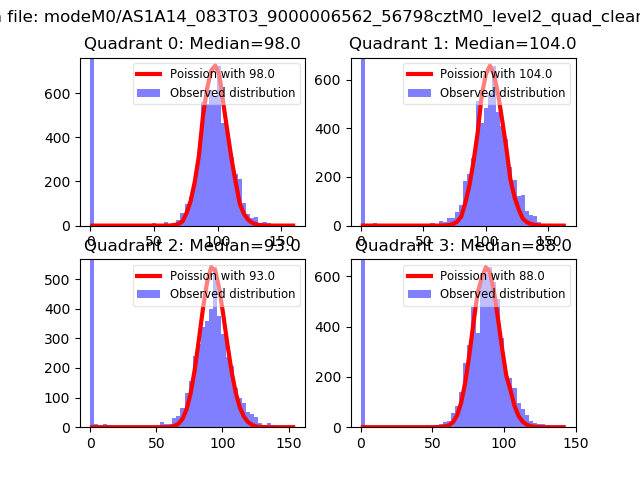
| Comparison with Poisson distribution Blue bars denote a histogram of data divided into 1 sec bins. Red curve is a Poisson curve with rate = median count rate of data. |
 |
 |
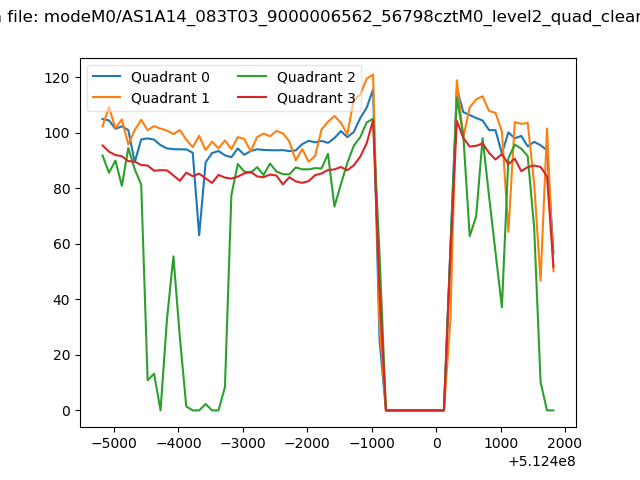
| Quadrant-wise count rates Data is divided into 100 sec bins |
 |
|
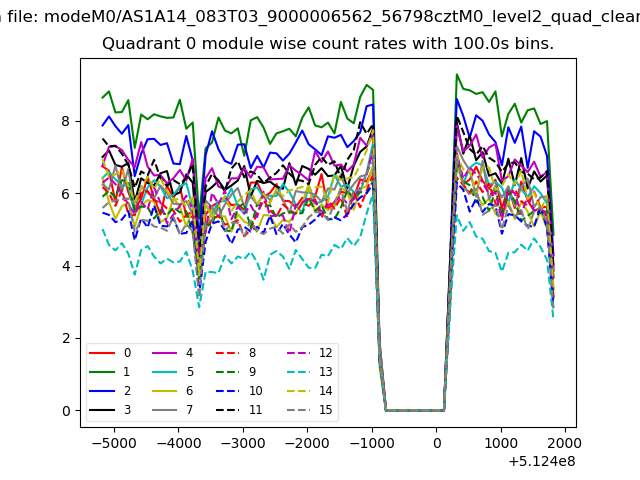
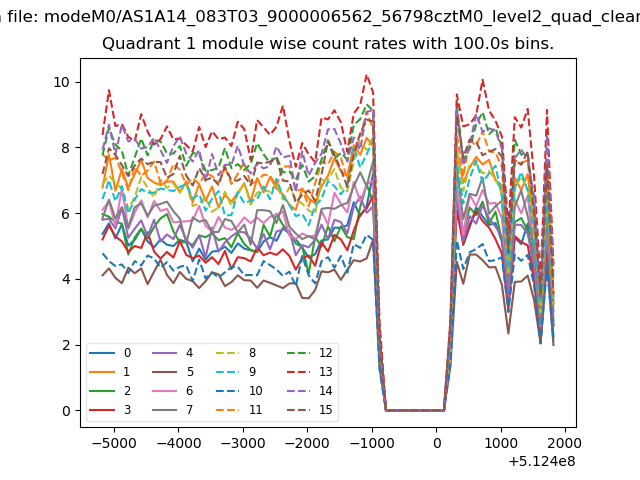
| Module-wise count rates for Quadrant A Data is divided into 100 sec bins |
 |
 |
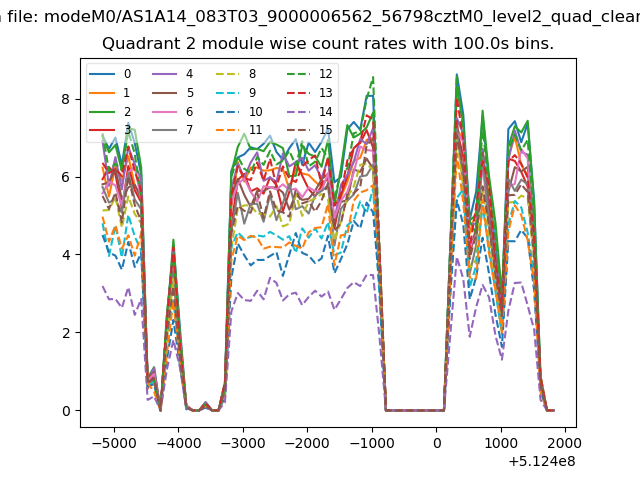
| Module-wise count rates for Quadrant B Data is divided into 100 sec bins |
 |
 |
| Module-wise count rates for Quadrant C Data is divided into 100 sec bins |
 |
 |
| Module-wise count rates for Quadrant D Data is divided into 100 sec bins |
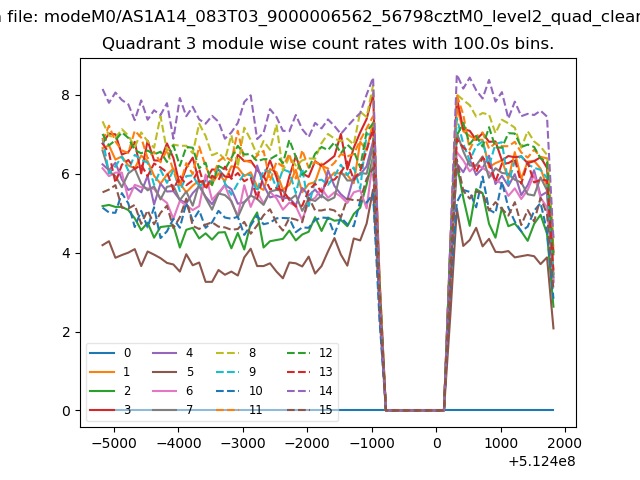 |
 |
| Parameter | Plot |
|---|---|
| CZT HV Monitor | 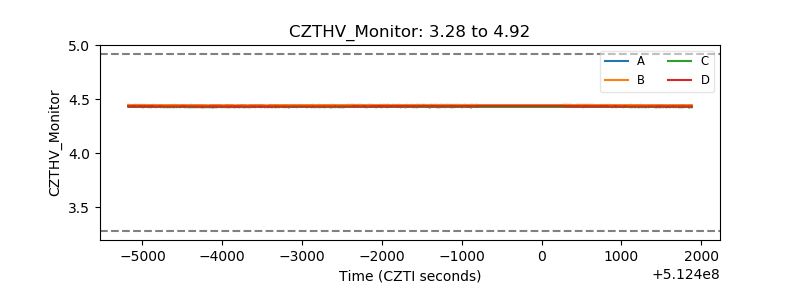 |
| D_VDD | 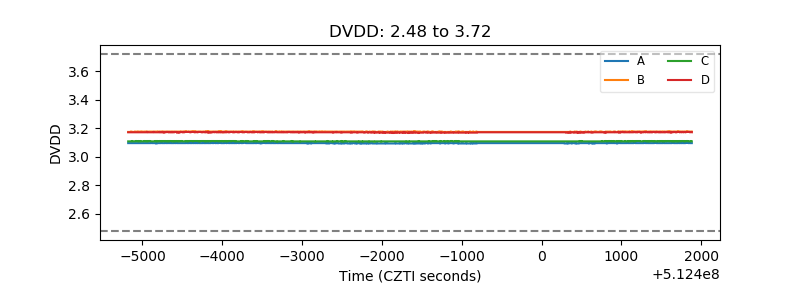 |
| Temperature 1 | 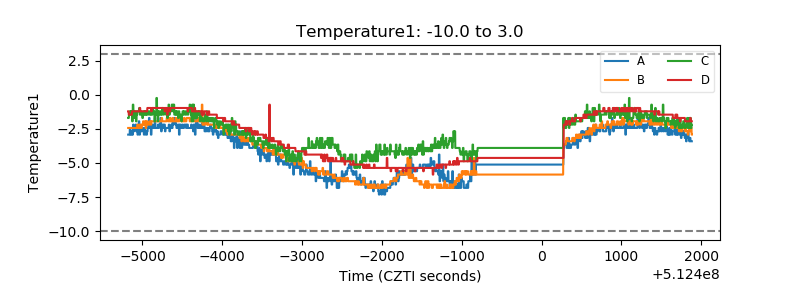 |
| Veto HV Monitor | 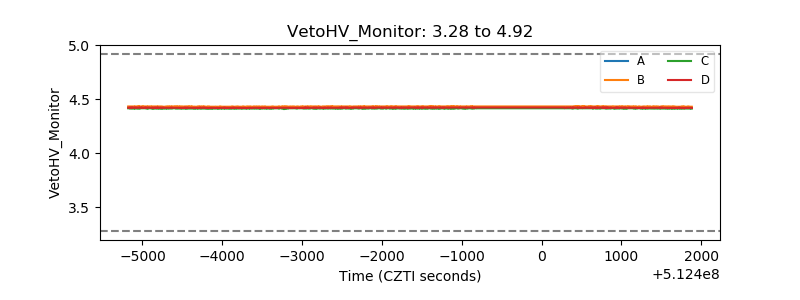 |
| Veto LLD | 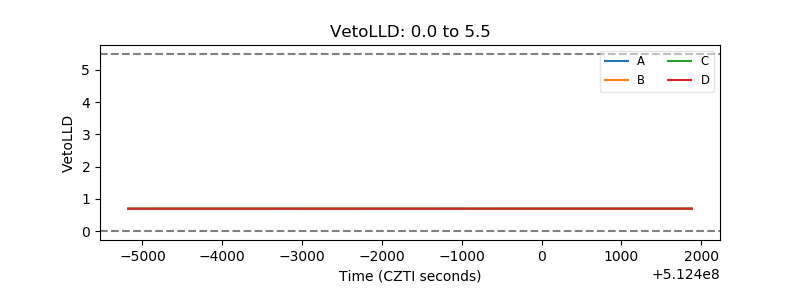 |
| Alpha Counter | 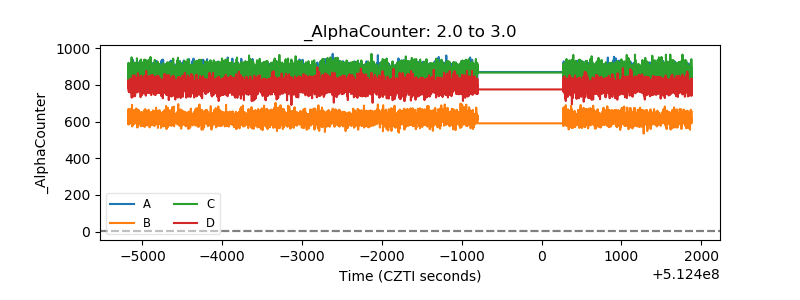 |
| _CPM_Rate | 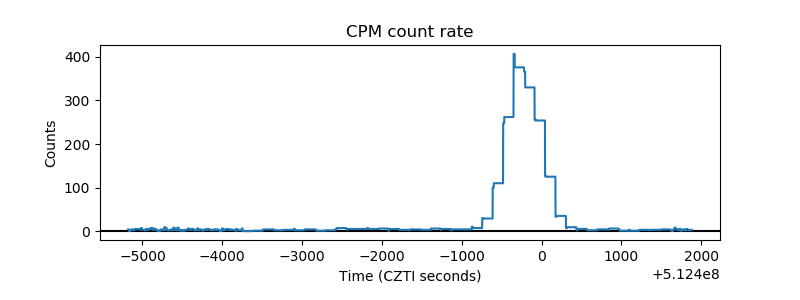 |
| CZT Counter | 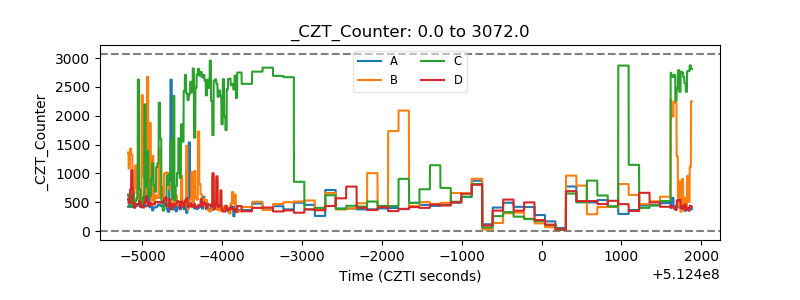 |
| +2.5 Volts monitor |  |
| +5 Volts monitor | 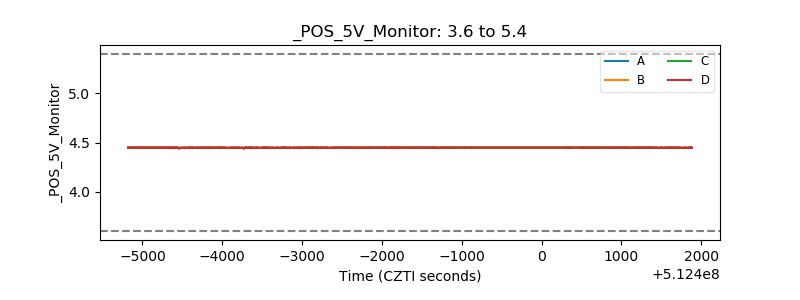 |
| _ROLL_ROT | 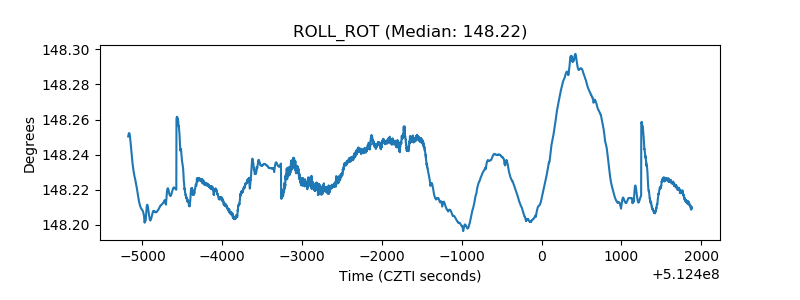 |
| _Roll_DEC | 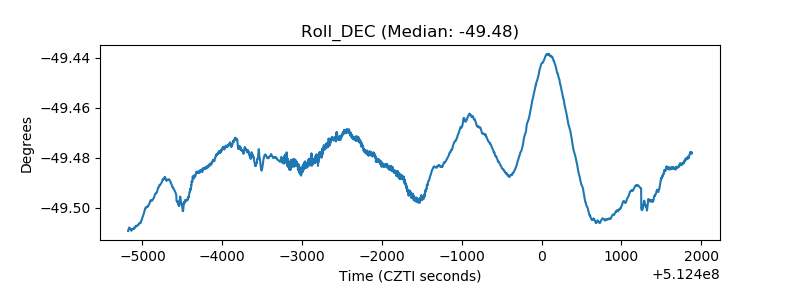 |
| _Roll_RA | 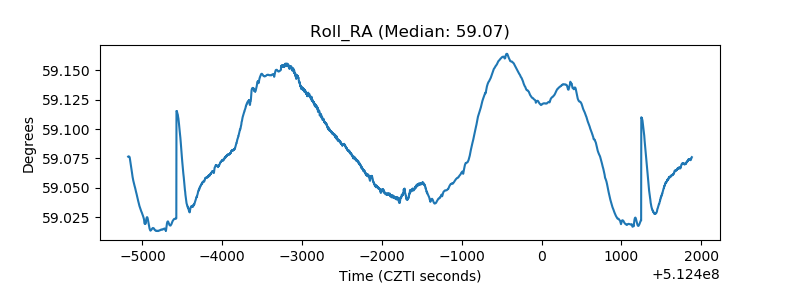 |
| Veto Counter | 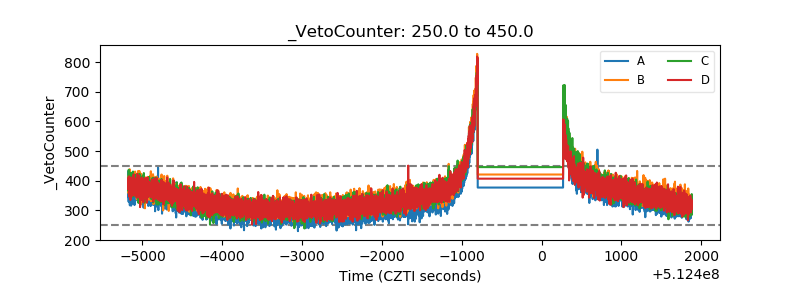 |