| Param | Original file | Final file |
|---|---|---|
| Filename | modeM0/AS1A14_083T03_9000006562_56799cztM0_level2.fits | modeM0/AS1A14_083T03_9000006562_56799cztM0_level2_quad_clean.evt |
| Size (bytes) | 546,969,600 | 83,108,160 |
| Size | 521.6 MB | 79.3 MB |
| Events in quadrant A | 3,338,151 | 574,832 |
| Events in quadrant B | 5,979,974 | 533,482 |
| Events in quadrant C | 7,113,815 | 454,739 |
| Events in quadrant D | 3,337,028 | 524,455 |
| Mode M9 | |||
|---|---|---|---|
| Quadrant | BADHDUFLAG | Total packets | Discarded packets |
| A | 0 | 11 | 0 |
| B | 0 | 11 | 0 |
| C | 0 | 11 | 0 |
| D | 0 | 11 | 0 |
| Mode SS | |||
|---|---|---|---|
| Quadrant | BADHDUFLAG | Total packets | Discarded packets |
| A | 0 | 122 | 0 |
| B | 0 | 122 | 0 |
| C | 0 | 122 | 0 |
| D | 0 | 122 | 0 |
| Mode M0 | |||
|---|---|---|---|
| Quadrant | BADHDUFLAG | Total packets | Discarded packets |
| A | 0 | 14561 | 1 |
| B | 0 | 22024 | 1 |
| C | 0 | 25585 | 6 |
| D | 0 | 14449 | 1 |
| Quadrant | Total seconds | Saturated seconds | Saturation percentage |
|---|---|---|---|
| A | 6151 | 215 | 3.495367% |
| B | 6151 | 1165 | 18.940010% |
| C | 6151 | 1347 | 21.898878% |
| D | 6151 | 129 | 2.097220% |
Noise dominated data is calculated using 1-second bins in cleaned event files. If a bin has >2000 counts, and if more than 50% of those come from <1% of pixels, then it is considered to be noise-dominated and hence unusable.
| Quadrant | # 1 sec bins | Bins with >0 counts | Bins with >2000 counts | High rate bins dominated by noise | Noise dominated (total time) | Noise dominated (detector-on time) | Marked lightcurve |
|---|---|---|---|---|---|---|---|
| A | 7176 | 6152 | 185 | 185 | 2.58% | 3.01% | 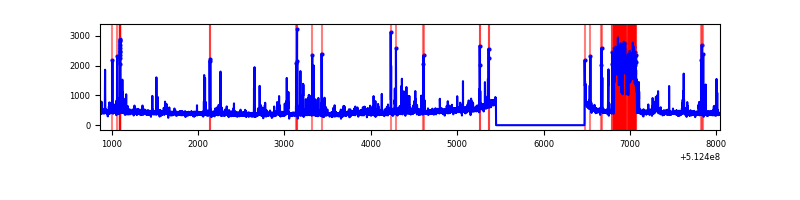 |
| B | 7175 | 6151 | 933 | 933 | 13.00% | 15.17% | 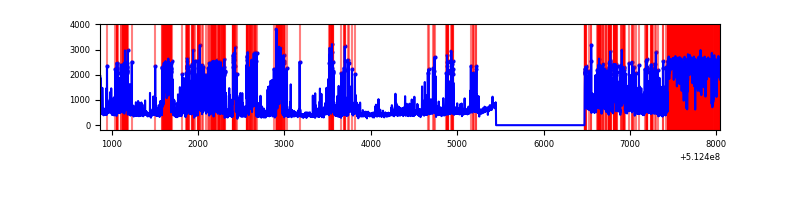 |
| C | 7175 | 6151 | 1319 | 1319 | 18.38% | 21.44% | 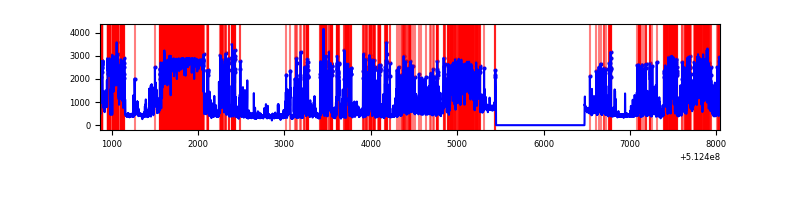 |
| D | 7176 | 6152 | 126 | 126 | 1.76% | 2.05% | 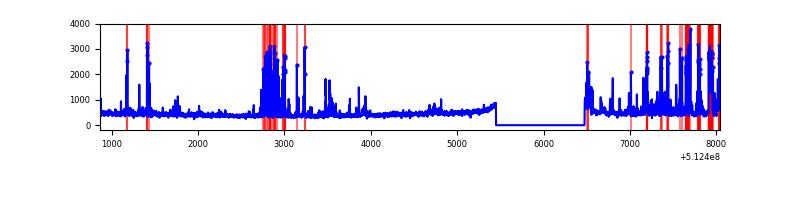 |
Top three noisy pixels from each quadrant. If the there are fewer than three noisy pixels in the level2.evt file, extra rows are filled as -1
| Pixel properties | Quadrant properties | ||||||
|---|---|---|---|---|---|---|---|
| Quadrant | DetID | PixID | Counts | Sigma | Mean | Median | Sigma |
| A | 4 | 249 | 434005 | 2690.93 | 649 | 630 | 161.1 |
| A | 10 | 251 | 295361 | 1830.05 | 649 | 630 | 161.1 |
| A | 4 | 236 | 35744 | 218.03 | 649 | 630 | 161.1 |
| B | 4 | 206 | 2683158 | 20871.31 | 600 | 580 | 128.5 |
| B | 8 | 128 | 329556 | 2559.54 | 600 | 580 | 128.5 |
| B | 2 | 249 | 270570 | 2100.61 | 600 | 580 | 128.5 |
| C | 13 | 3 | 2643023 | 16944.69 | 565 | 559 | 155.9 |
| C | 15 | 230 | 1526017 | 9781.93 | 565 | 559 | 155.9 |
| C | 9 | 38 | 568470 | 3641.7 | 565 | 559 | 155.9 |
| D | 2 | 249 | 593635 | 3345.43 | 623 | 594 | 177.3 |
| D | 3 | 176 | 95038 | 532.77 | 623 | 594 | 177.3 |
| D | 8 | 160 | 58657 | 327.54 | 623 | 594 | 177.3 |
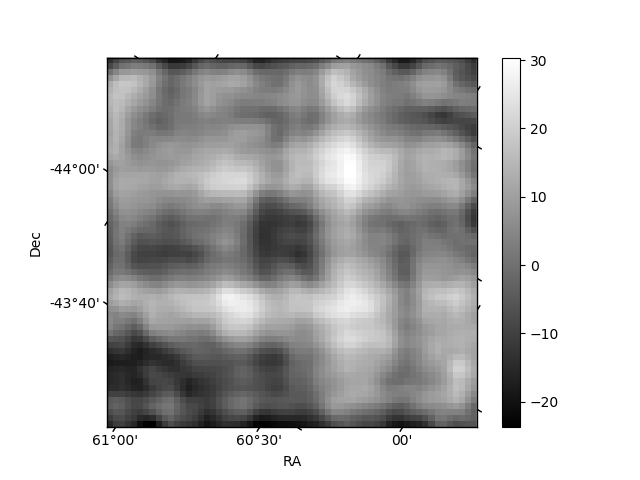
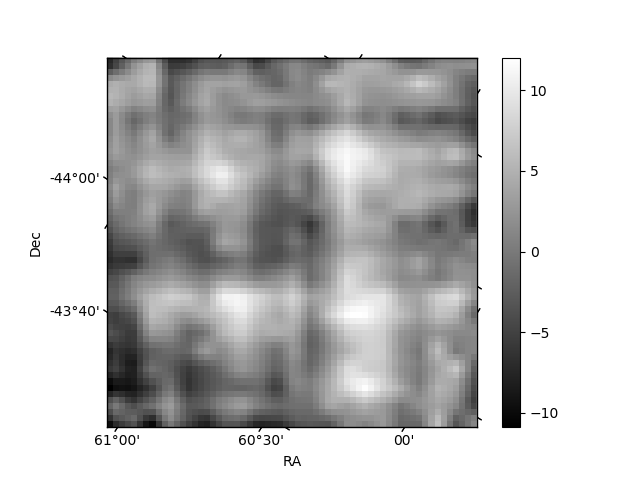
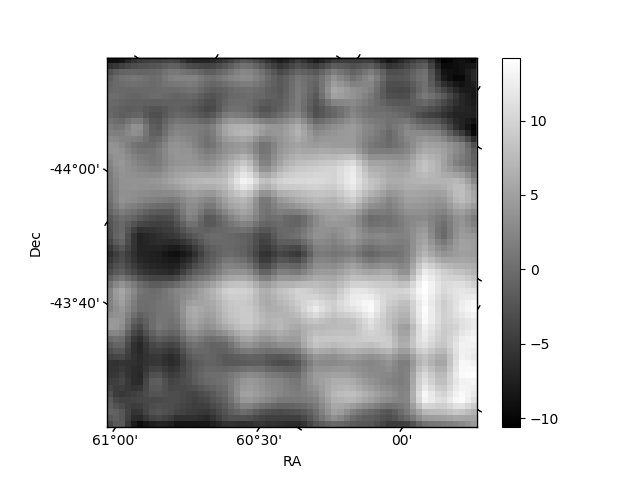
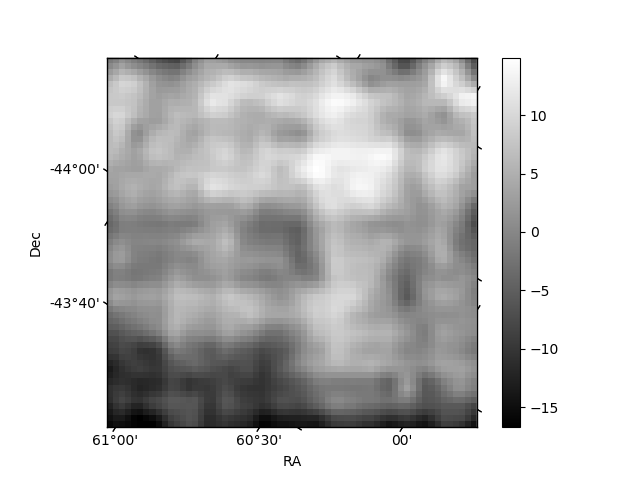
Histogram calculated using DETX and DETY for each event in the final _common_clean file
| Quadrant A | 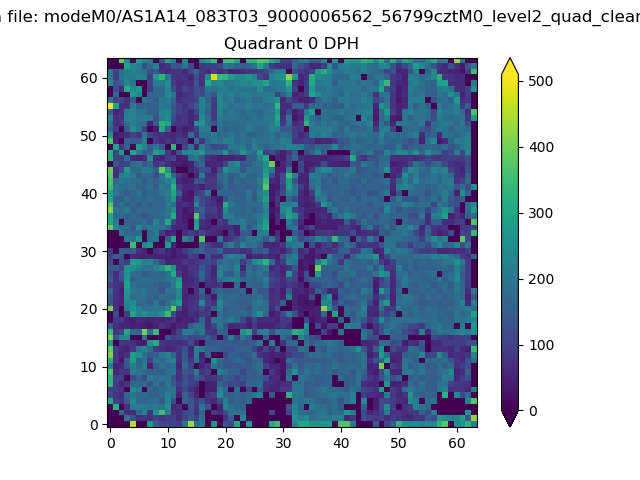 |
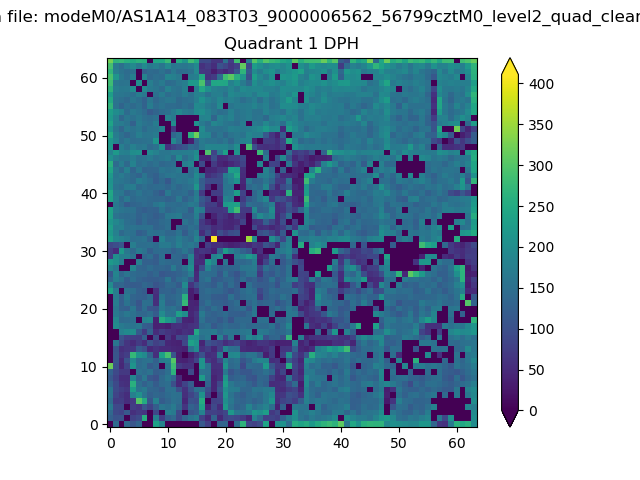 |
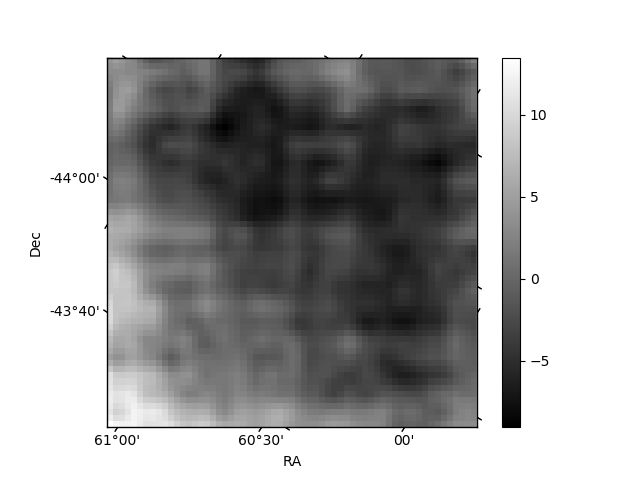
Quadrant B |
|---|---|---|---|
| Quadrant D | 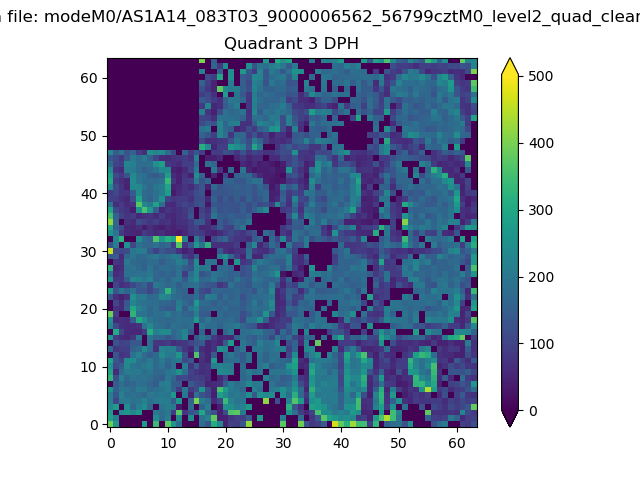 |
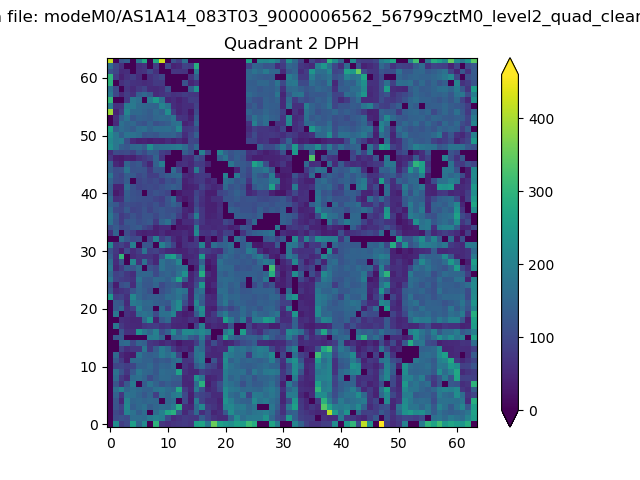 |
Quadrant C |
| Plot type | Count rate plots | Images |
|---|---|---|
| Comparison with Poisson distribution Blue bars denote a histogram of data divided into 1 sec bins. Red curve is a Poisson curve with rate = median count rate of data. |
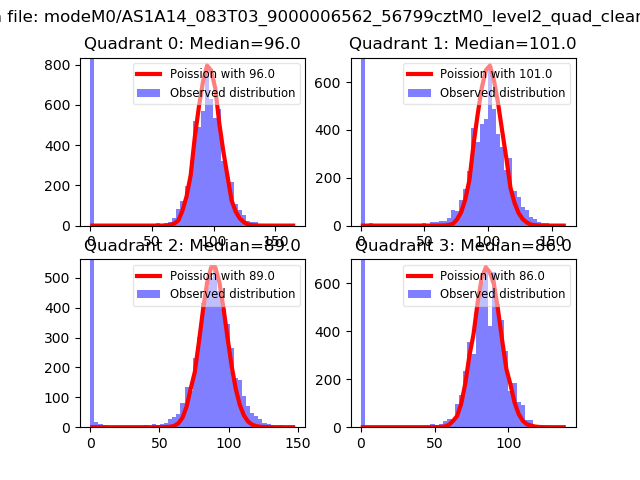 |
 |
| Quadrant-wise count rates Data is divided into 100 sec bins |
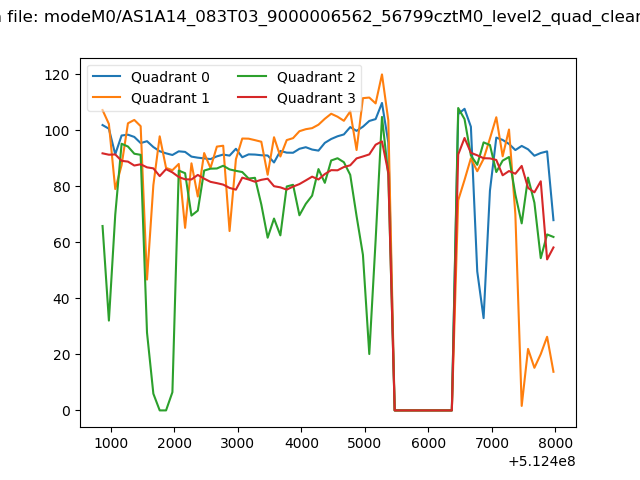 |
|
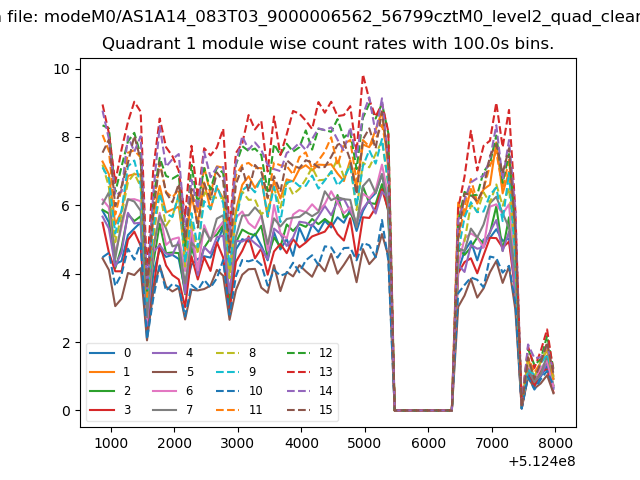
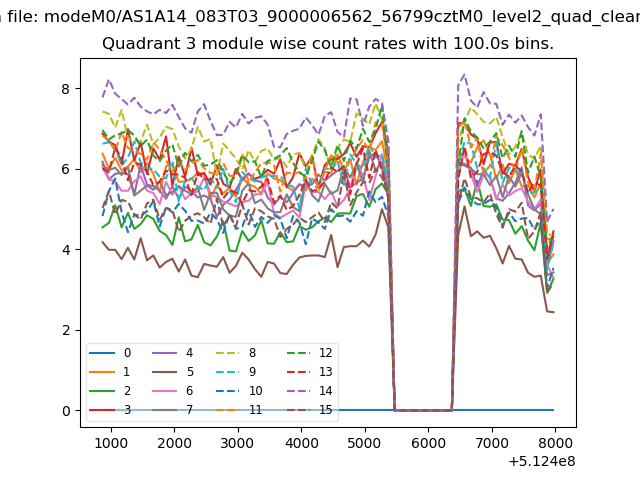
| Module-wise count rates for Quadrant A Data is divided into 100 sec bins |
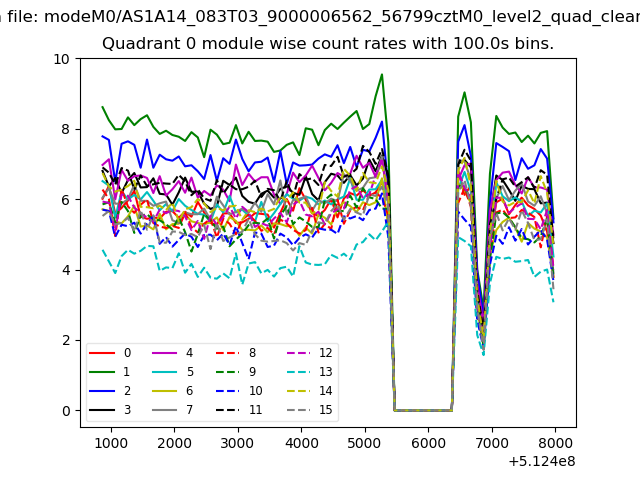 |
 |
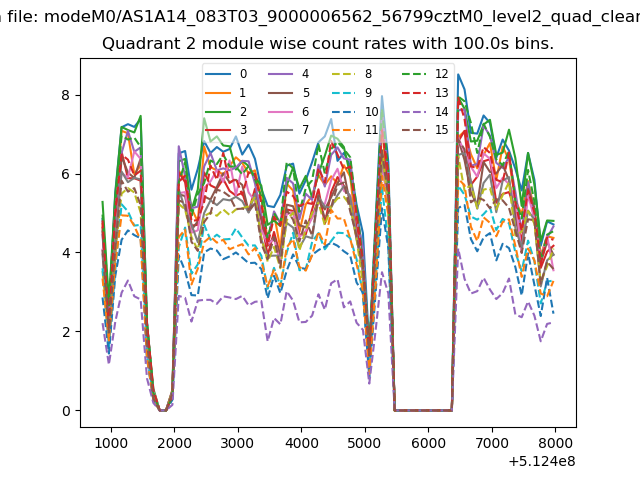
| Module-wise count rates for Quadrant B Data is divided into 100 sec bins |
 |
 |
| Module-wise count rates for Quadrant C Data is divided into 100 sec bins |
 |
 |
| Module-wise count rates for Quadrant D Data is divided into 100 sec bins |
 |
 |
| Parameter | Plot |
|---|---|
| CZT HV Monitor |  |
| D_VDD | 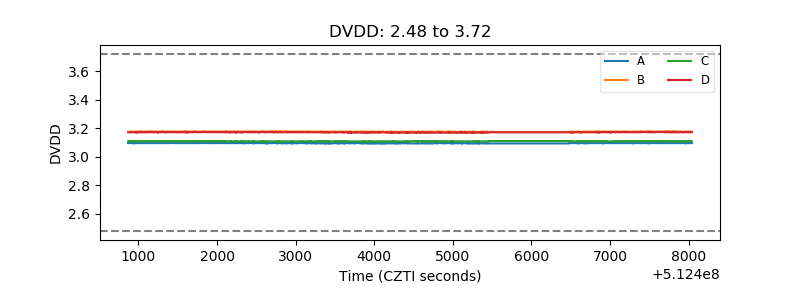 |
| Temperature 1 | 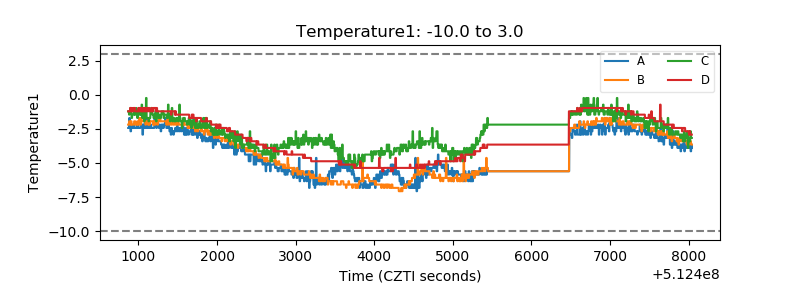 |
| Veto HV Monitor | 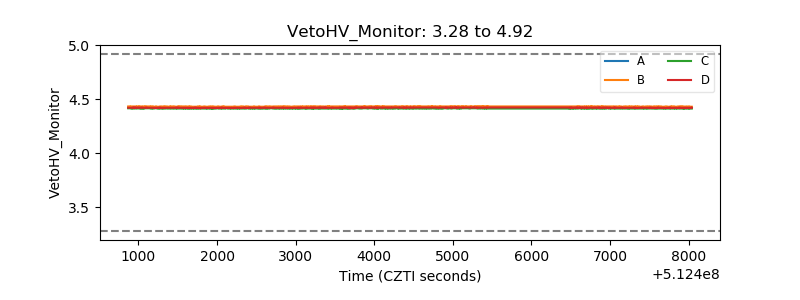 |
| Veto LLD | 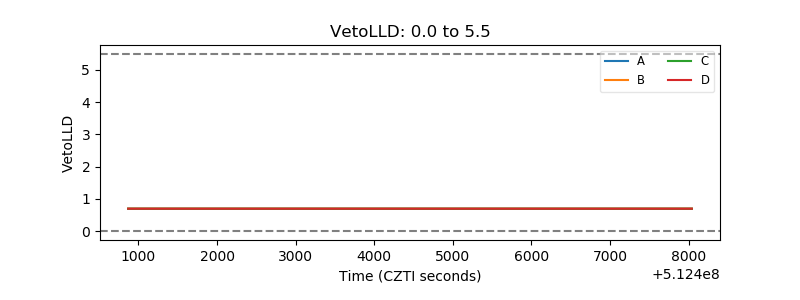 |
| Alpha Counter | 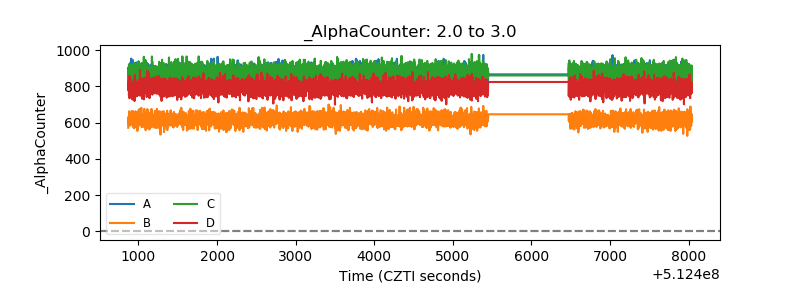 |
| _CPM_Rate | 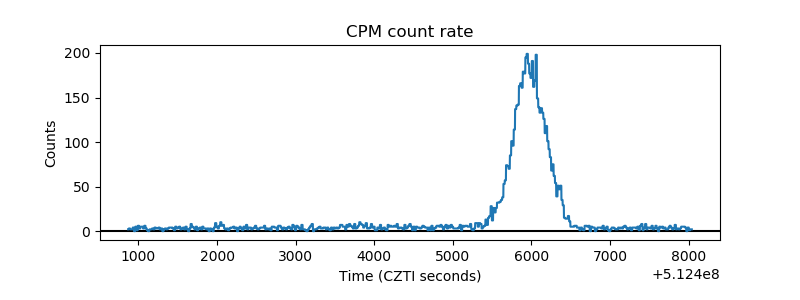 |
| CZT Counter | 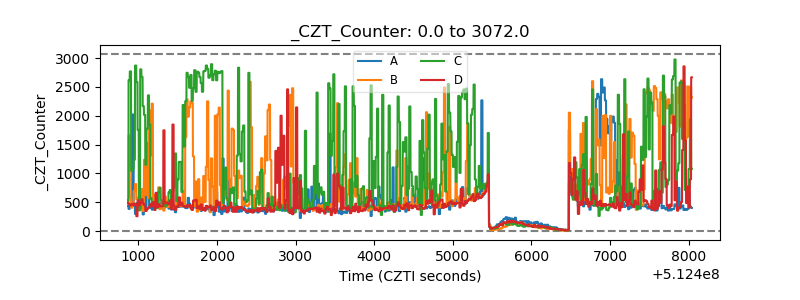 |
| +2.5 Volts monitor |  |
| +5 Volts monitor |  |
| _ROLL_ROT | 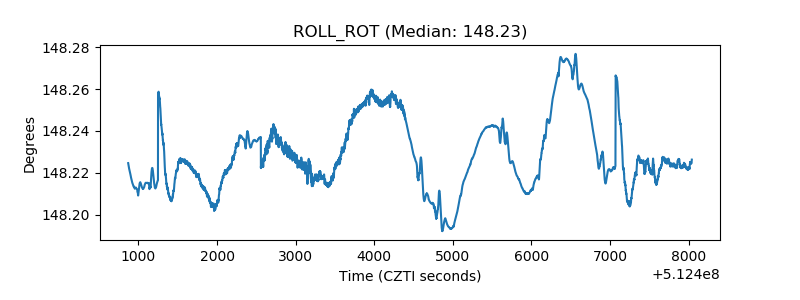 |
| _Roll_DEC | 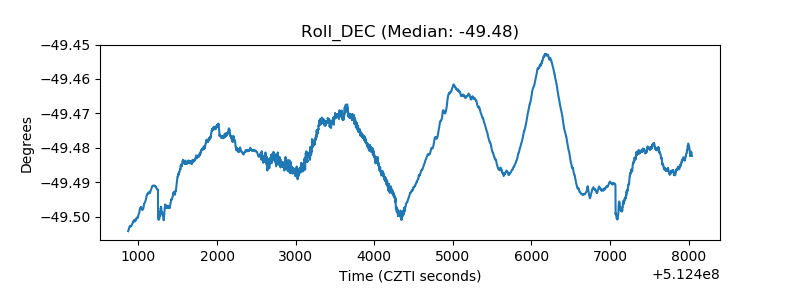 |
| _Roll_RA | 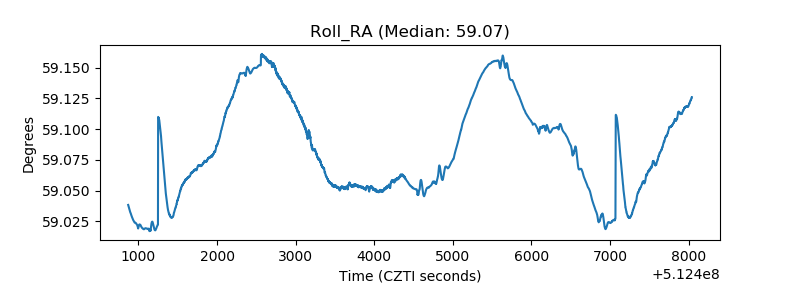 |
| Veto Counter | 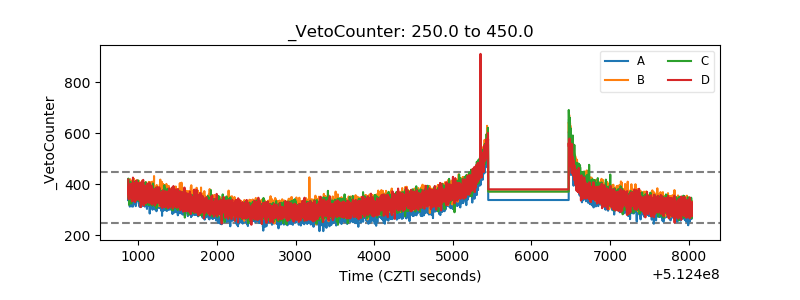 |