| Param | Original file | Final file |
|---|---|---|
| Filename | modeM0/AS1A14_083T03_9000006562_56800cztM0_level2.fits | modeM0/AS1A14_083T03_9000006562_56800cztM0_level2_quad_clean.evt |
| Size (bytes) | 513,558,720 | 86,529,600 |
| Size | 489.8 MB | 82.5 MB |
| Events in quadrant A | 3,205,132 | 594,614 |
| Events in quadrant B | 6,270,000 | 527,561 |
| Events in quadrant C | 5,248,094 | 523,150 |
| Events in quadrant D | 3,792,941 | 531,328 |
| Mode M9 | |||
|---|---|---|---|
| Quadrant | BADHDUFLAG | Total packets | Discarded packets |
| A | 0 | 8 | 0 |
| B | 0 | 8 | 0 |
| C | 0 | 8 | 0 |
| D | 0 | 8 | 0 |
| Mode SS | |||
|---|---|---|---|
| Quadrant | BADHDUFLAG | Total packets | Discarded packets |
| A | 0 | 128 | 0 |
| B | 0 | 128 | 0 |
| C | 0 | 128 | 0 |
| D | 0 | 128 | 0 |
| Mode M0 | |||
|---|---|---|---|
| Quadrant | BADHDUFLAG | Total packets | Discarded packets |
| A | 0 | 14416 | 1 |
| B | 0 | 23094 | 1 |
| C | 0 | 20222 | 1 |
| D | 0 | 15755 | 1 |
| Quadrant | Total seconds | Saturated seconds | Saturation percentage |
|---|---|---|---|
| A | 6355 | 137 | 2.155783% |
| B | 6356 | 1340 | 21.082442% |
| C | 6356 | 672 | 10.572687% |
| D | 6356 | 167 | 2.627439% |
Noise dominated data is calculated using 1-second bins in cleaned event files. If a bin has >2000 counts, and if more than 50% of those come from <1% of pixels, then it is considered to be noise-dominated and hence unusable.
| Quadrant | # 1 sec bins | Bins with >0 counts | Bins with >2000 counts | High rate bins dominated by noise | Noise dominated (total time) | Noise dominated (detector-on time) | Marked lightcurve |
|---|---|---|---|---|---|---|---|
| A | 7145 | 6356 | 124 | 124 | 1.74% | 1.95% | 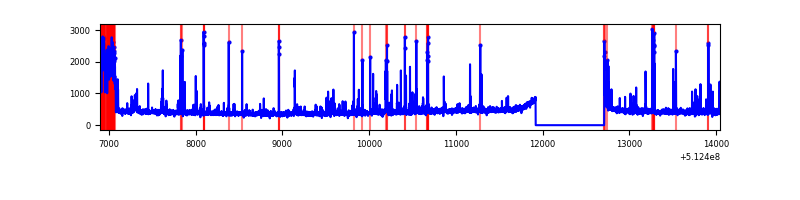 |
| B | 7146 | 6356 | 1047 | 1047 | 14.65% | 16.47% | 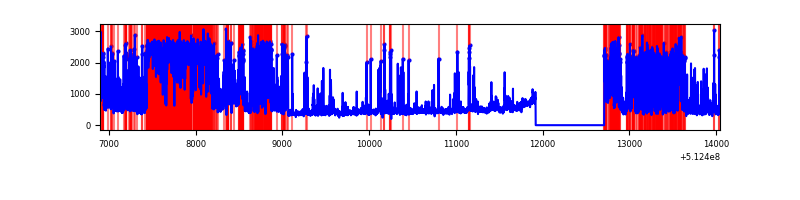 |
| C | 7146 | 6357 | 721 | 721 | 10.09% | 11.34% | 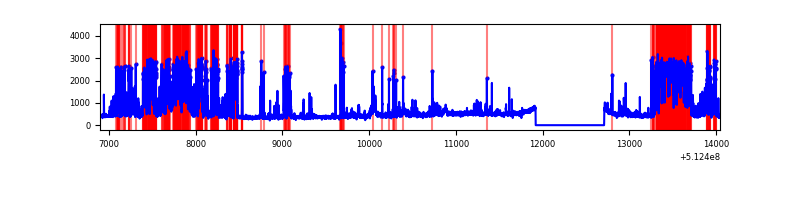 |
| D | 7146 | 6356 | 186 | 186 | 2.60% | 2.93% | 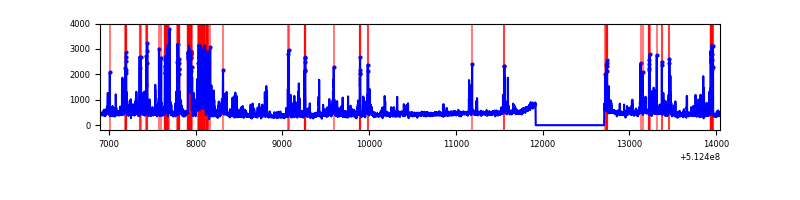 |
Top three noisy pixels from each quadrant. If the there are fewer than three noisy pixels in the level2.evt file, extra rows are filled as -1
| Pixel properties | Quadrant properties | ||||||
|---|---|---|---|---|---|---|---|
| Quadrant | DetID | PixID | Counts | Sigma | Mean | Median | Sigma |
| A | 4 | 249 | 297686 | 1796.35 | 668 | 648 | 165.4 |
| A | 10 | 251 | 265668 | 1602.72 | 668 | 648 | 165.4 |
| A | 3 | 62 | 17730 | 103.3 | 668 | 648 | 165.4 |
| B | 4 | 206 | 3223856 | 24731.03 | 606 | 583 | 130.3 |
| B | 5 | 172 | 204600 | 1565.35 | 606 | 583 | 130.3 |
| B | 8 | 128 | 184908 | 1414.26 | 606 | 583 | 130.3 |
| C | 13 | 3 | 1349137 | 7951.87 | 616 | 608 | 169.6 |
| C | 15 | 230 | 1287274 | 7587.08 | 616 | 608 | 169.6 |
| C | 9 | 38 | 86133 | 504.32 | 616 | 608 | 169.6 |
| D | 2 | 249 | 870534 | 4858.05 | 637 | 608 | 179.1 |
| D | 8 | 160 | 94677 | 525.32 | 637 | 608 | 179.1 |
| D | 2 | 31 | 92129 | 511.09 | 637 | 608 | 179.1 |
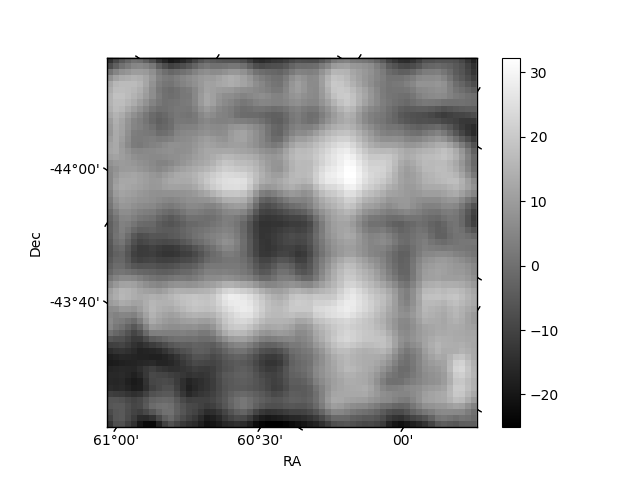
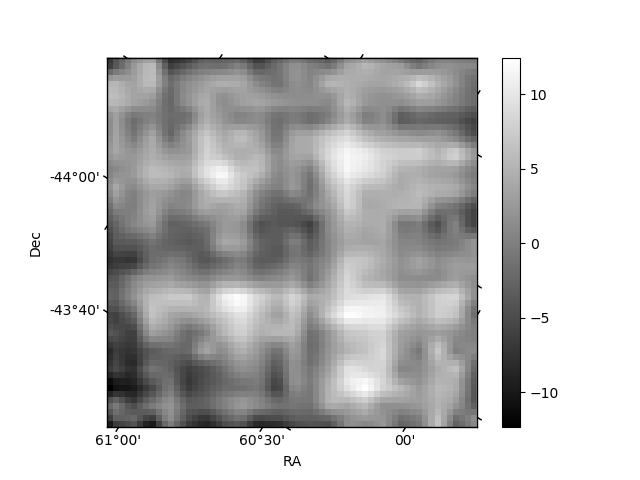
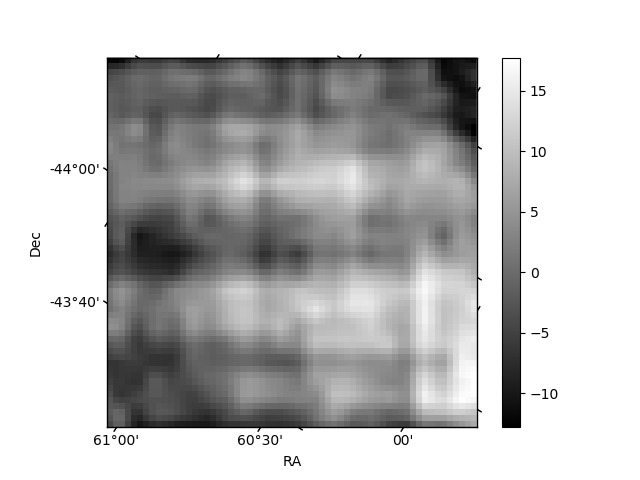
Histogram calculated using DETX and DETY for each event in the final _common_clean file
| Quadrant A | 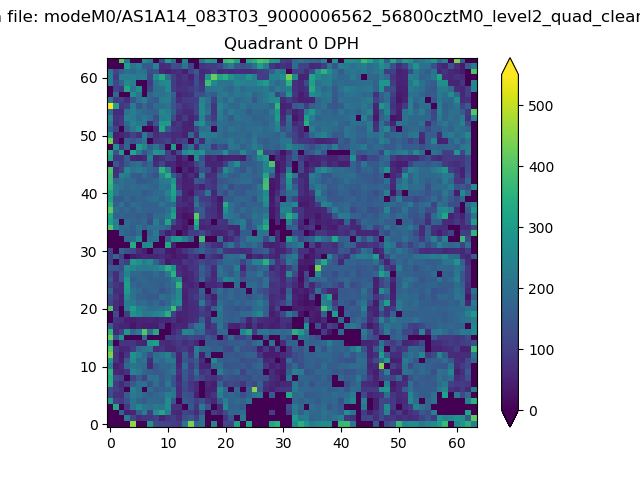 |
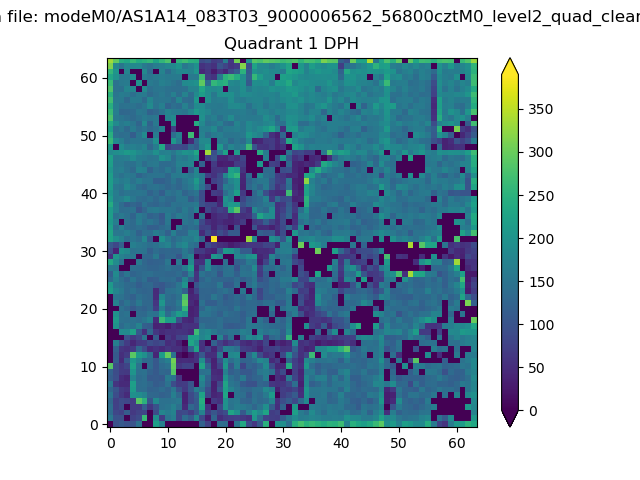 |
Quadrant B |
|---|---|---|---|
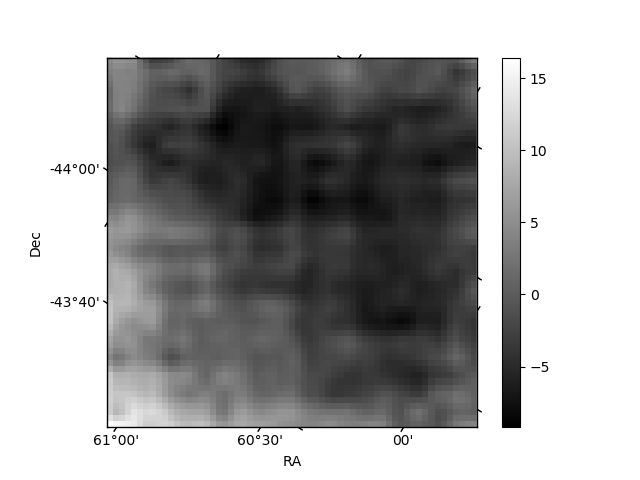
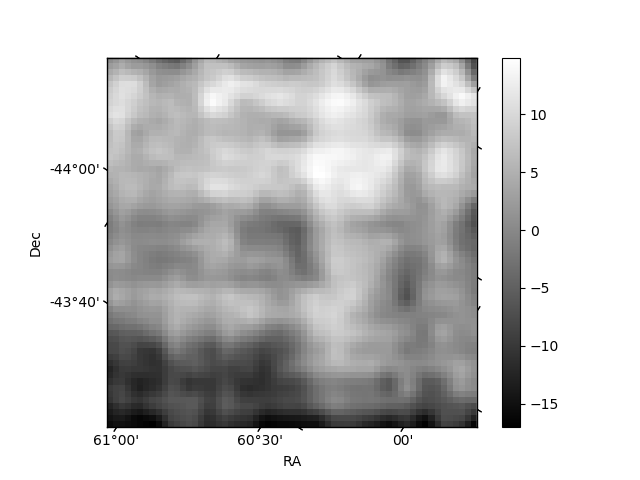
| Quadrant D | 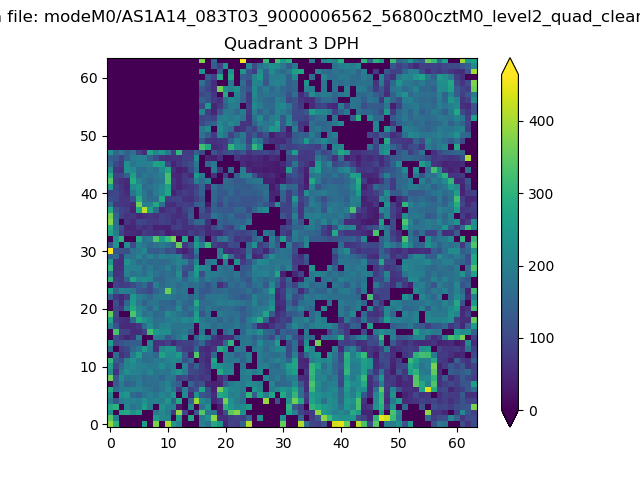 |
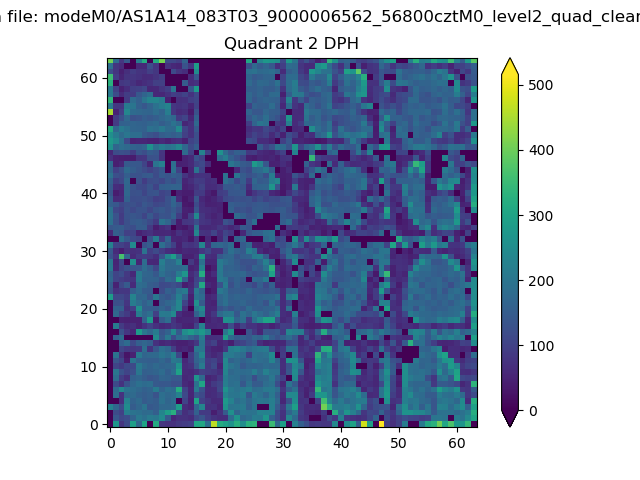 |
Quadrant C |
| Plot type | Count rate plots | Images |
|---|---|---|
| Comparison with Poisson distribution Blue bars denote a histogram of data divided into 1 sec bins. Red curve is a Poisson curve with rate = median count rate of data. |
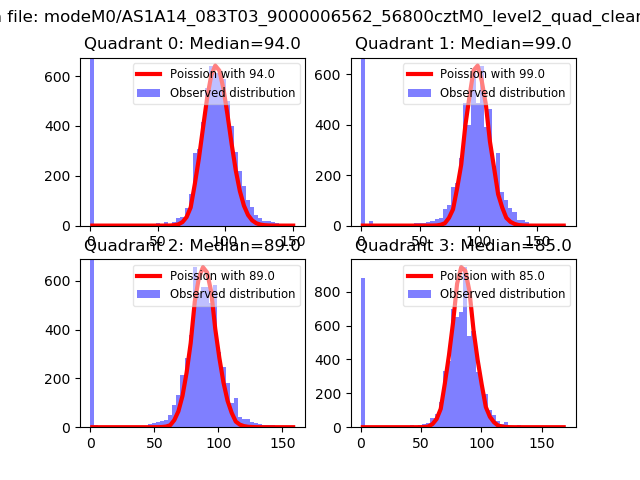 |
 |
| Quadrant-wise count rates Data is divided into 100 sec bins |
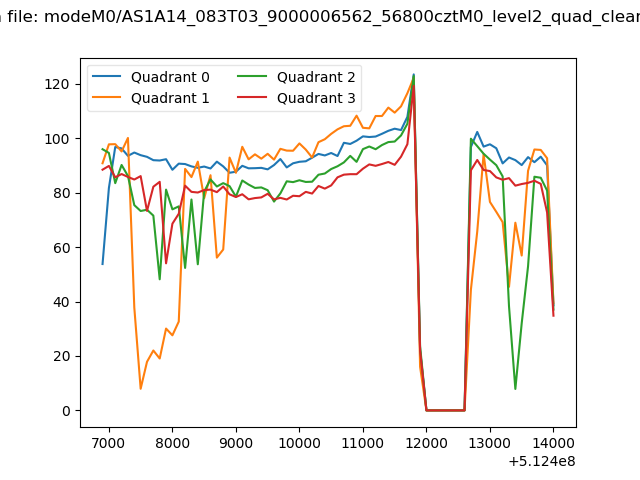 |
|
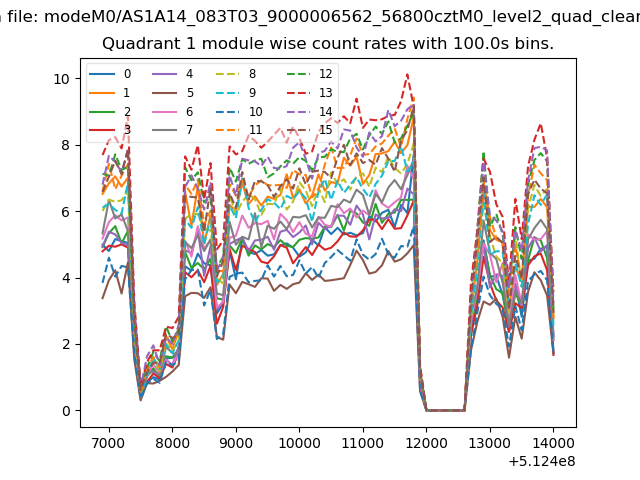
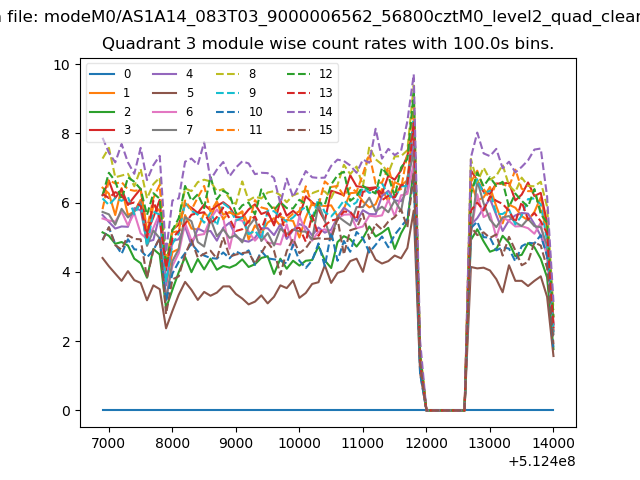
| Module-wise count rates for Quadrant A Data is divided into 100 sec bins |
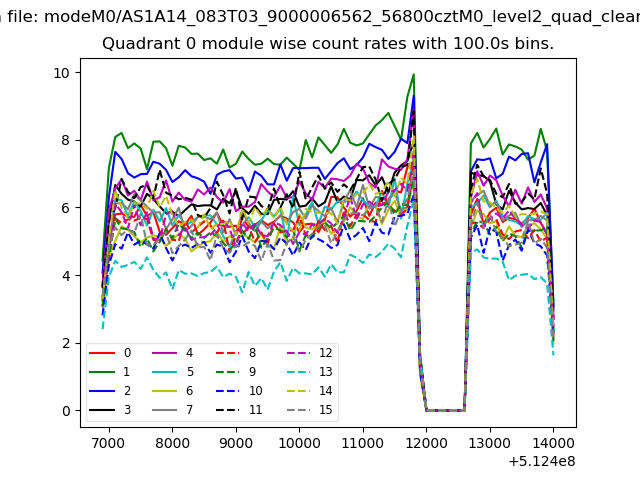 |
 |
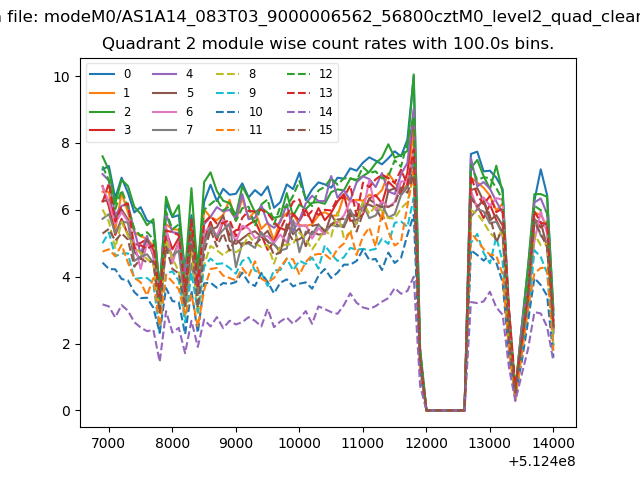
| Module-wise count rates for Quadrant B Data is divided into 100 sec bins |
 |
 |
| Module-wise count rates for Quadrant C Data is divided into 100 sec bins |
 |
 |
| Module-wise count rates for Quadrant D Data is divided into 100 sec bins |
 |
 |
| Parameter | Plot |
|---|---|
| CZT HV Monitor | 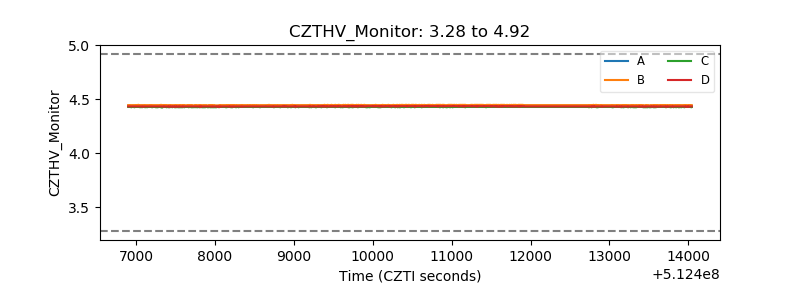 |
| D_VDD | 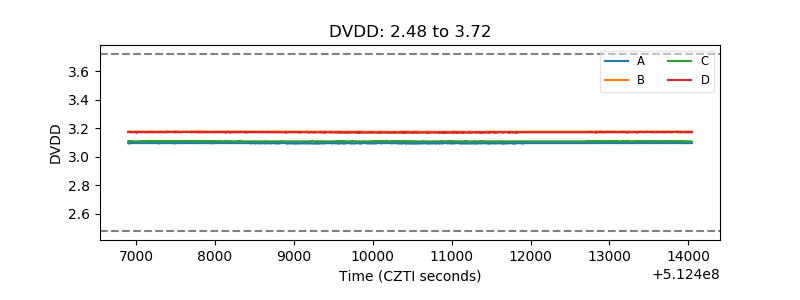 |
| Temperature 1 | 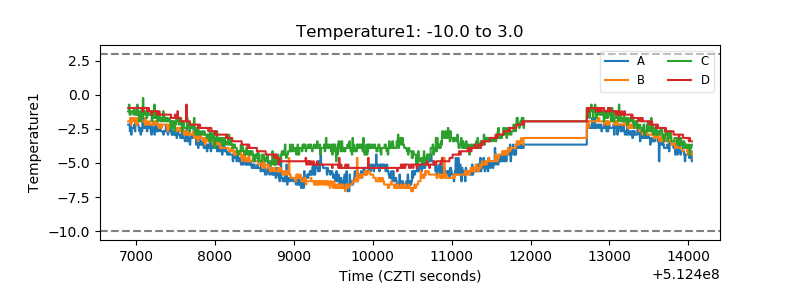 |
| Veto HV Monitor | 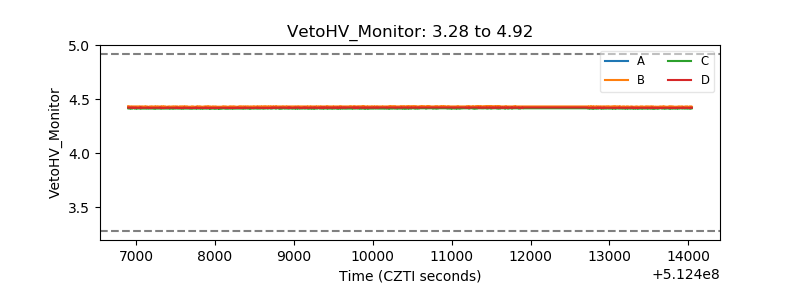 |
| Veto LLD | 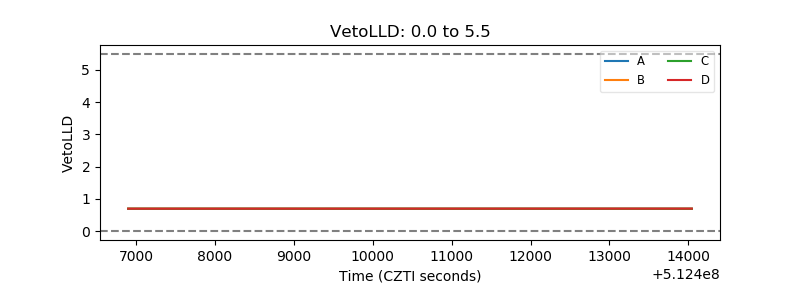 |
| Alpha Counter | 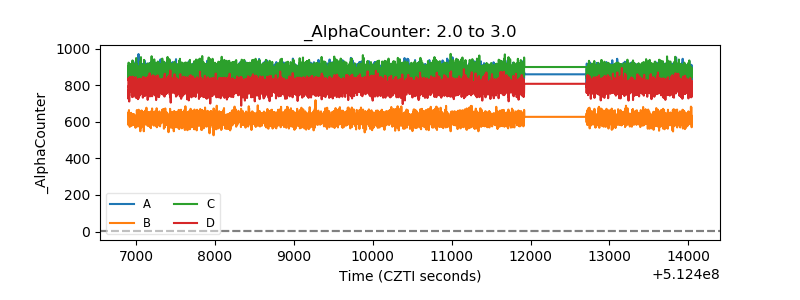 |
| _CPM_Rate | 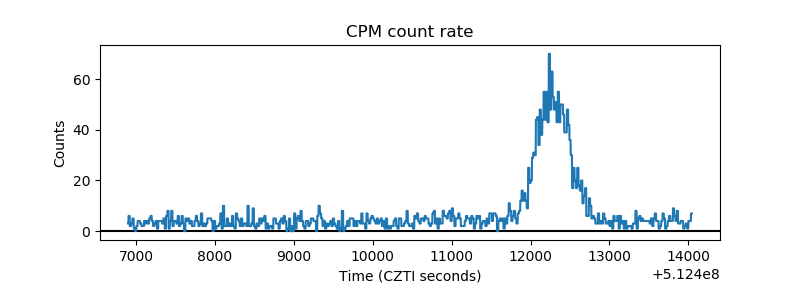 |
| CZT Counter | 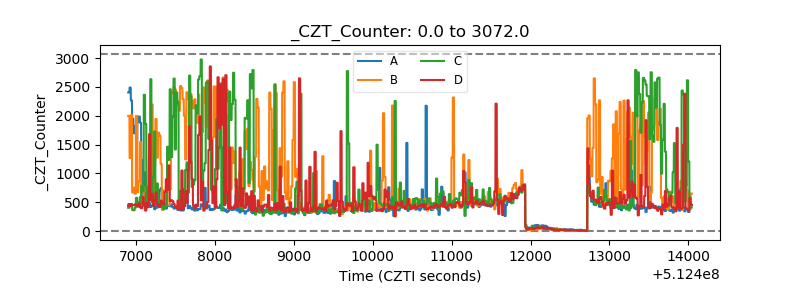 |
| +2.5 Volts monitor |  |
| +5 Volts monitor | 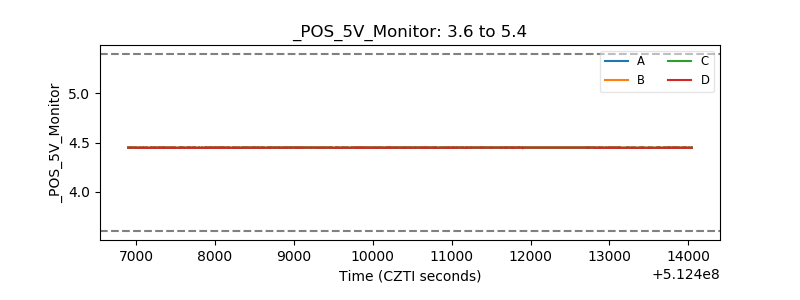 |
| _ROLL_ROT | 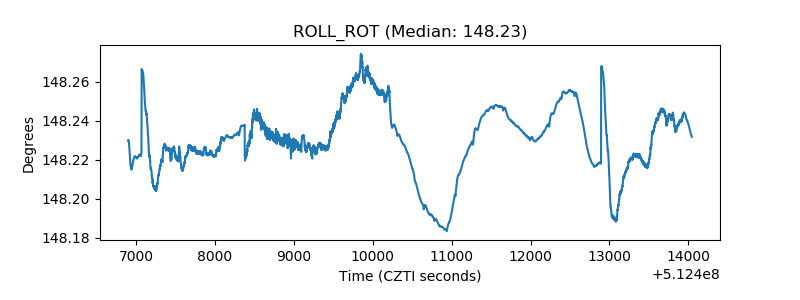 |
| _Roll_DEC | 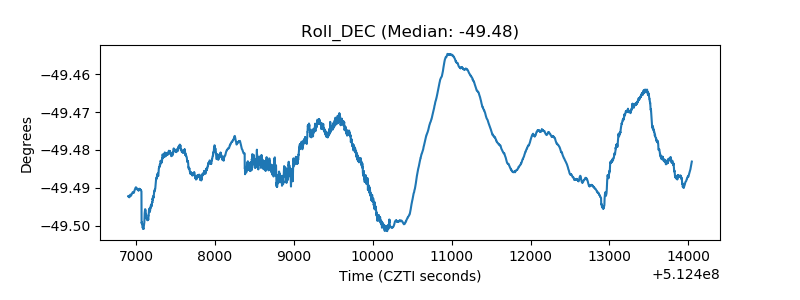 |
| _Roll_RA | 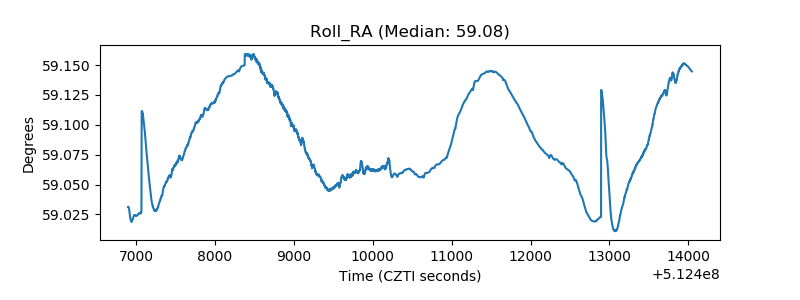 |
| Veto Counter | 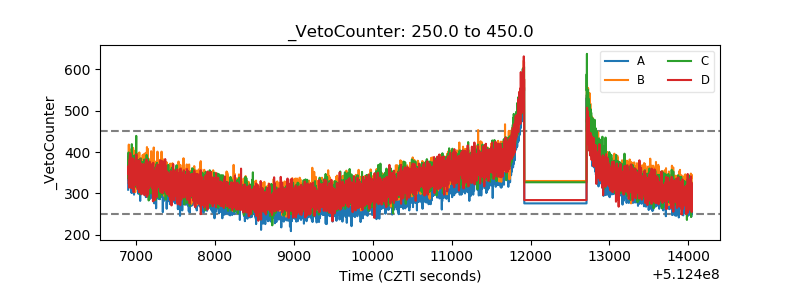 |