| Param | Original file | Final file |
|---|---|---|
| Filename | modeM0/AS1A14_083T03_9000006562_56801cztM0_level2.fits | modeM0/AS1A14_083T03_9000006562_56801cztM0_level2_quad_clean.evt |
| Size (bytes) | 528,716,160 | 100,995,840 |
| Size | 504.2 MB | 96.3 MB |
| Events in quadrant A | 4,044,501 | 674,217 |
| Events in quadrant B | 6,278,524 | 636,045 |
| Events in quadrant C | 4,874,390 | 616,873 |
| Events in quadrant D | 3,802,024 | 618,027 |
| Mode SS | |||
|---|---|---|---|
| Quadrant | BADHDUFLAG | Total packets | Discarded packets |
| A | 0 | 150 | 0 |
| B | 0 | 150 | 0 |
| C | 0 | 150 | 0 |
| D | 0 | 150 | 0 |
| Mode M0 | |||
|---|---|---|---|
| Quadrant | BADHDUFLAG | Total packets | Discarded packets |
| A | 0 | 17607 | 3 |
| B | 0 | 23875 | 3 |
| C | 0 | 19922 | 3 |
| D | 0 | 16644 | 3 |
| Quadrant | Total seconds | Saturated seconds | Saturation percentage |
|---|---|---|---|
| A | 7355 | 266 | 3.616587% |
| B | 7356 | 1236 | 16.802610% |
| C | 7356 | 513 | 6.973899% |
| D | 7356 | 99 | 1.345840% |
Noise dominated data is calculated using 1-second bins in cleaned event files. If a bin has >2000 counts, and if more than 50% of those come from <1% of pixels, then it is considered to be noise-dominated and hence unusable.
| Quadrant | # 1 sec bins | Bins with >0 counts | Bins with >2000 counts | High rate bins dominated by noise | Noise dominated (total time) | Noise dominated (detector-on time) | Marked lightcurve |
|---|---|---|---|---|---|---|---|
| A | 7490 | 7355 | 145 | 145 | 1.94% | 1.97% | 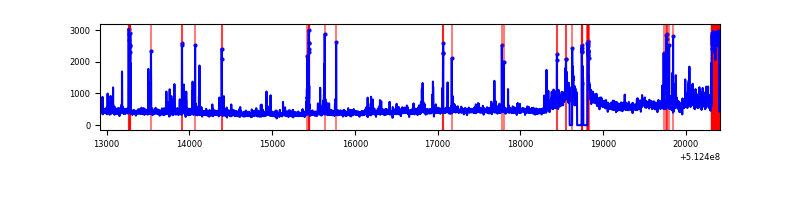 |
| B | 7491 | 7356 | 632 | 632 | 8.44% | 8.59% | 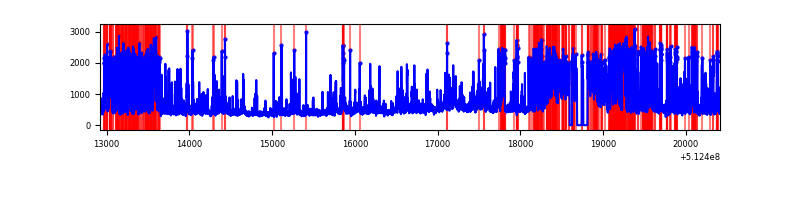 |
| C | 7491 | 7357 | 473 | 473 | 6.31% | 6.43% | 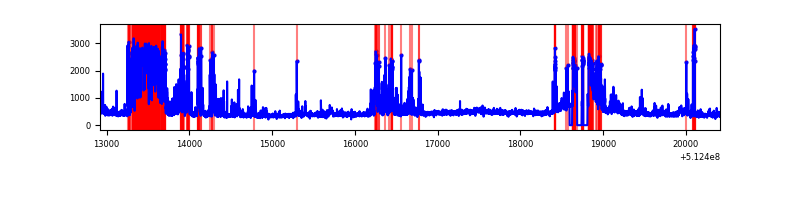 |
| D | 7491 | 7359 | 61 | 61 | 0.81% | 0.83% | 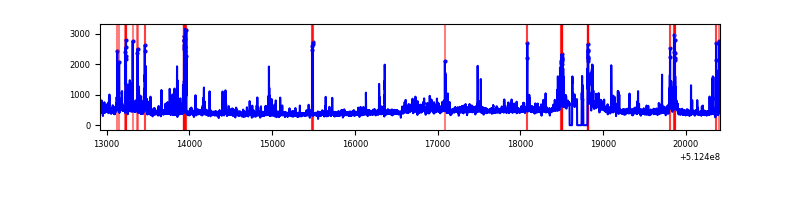 |
Top three noisy pixels from each quadrant. If the there are fewer than three noisy pixels in the level2.evt file, extra rows are filled as -1
| Pixel properties | Quadrant properties | ||||||
|---|---|---|---|---|---|---|---|
| Quadrant | DetID | PixID | Counts | Sigma | Mean | Median | Sigma |
| A | 4 | 249 | 440100 | 2284.67 | 774 | 752 | 192.3 |
| A | 10 | 251 | 275196 | 1427.15 | 774 | 752 | 192.3 |
| A | 3 | 14 | 246935 | 1280.19 | 774 | 752 | 192.3 |
| B | 4 | 206 | 2425521 | 15618.91 | 717 | 690 | 155.2 |
| B | 8 | 128 | 276018 | 1773.45 | 717 | 690 | 155.2 |
| B | 5 | 185 | 229116 | 1471.35 | 717 | 690 | 155.2 |
| C | 15 | 230 | 1600790 | 7949.69 | 732 | 724 | 201.3 |
| C | 13 | 3 | 130514 | 644.84 | 732 | 724 | 201.3 |
| C | 14 | 254 | 61823 | 303.56 | 732 | 724 | 201.3 |
| D | 8 | 160 | 232375 | 1092.22 | 754 | 719 | 212.1 |
| D | 2 | 249 | 221757 | 1042.15 | 754 | 719 | 212.1 |
| D | 2 | 31 | 66782 | 311.47 | 754 | 719 | 212.1 |
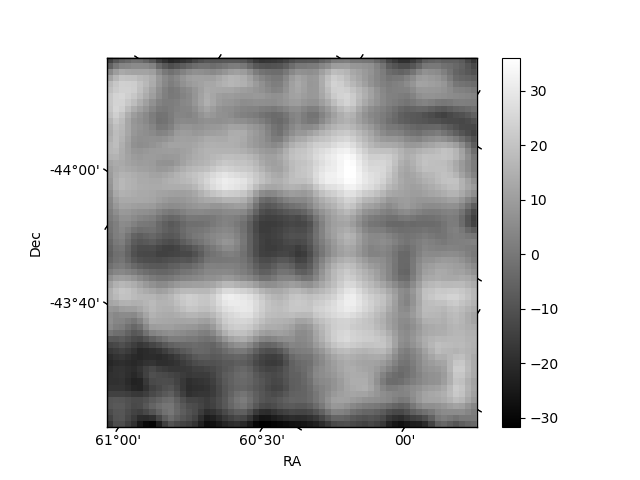
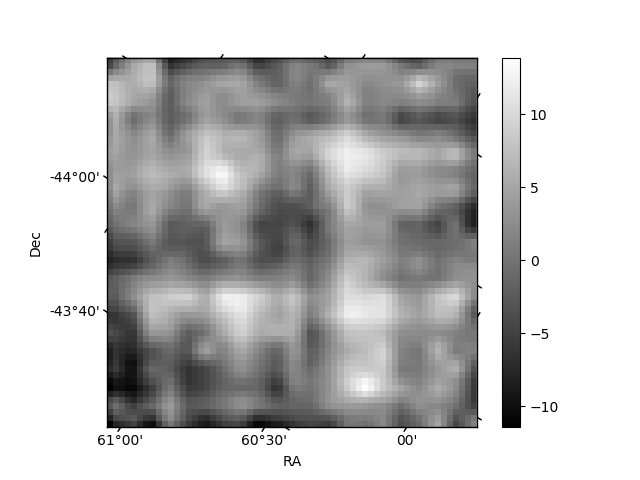
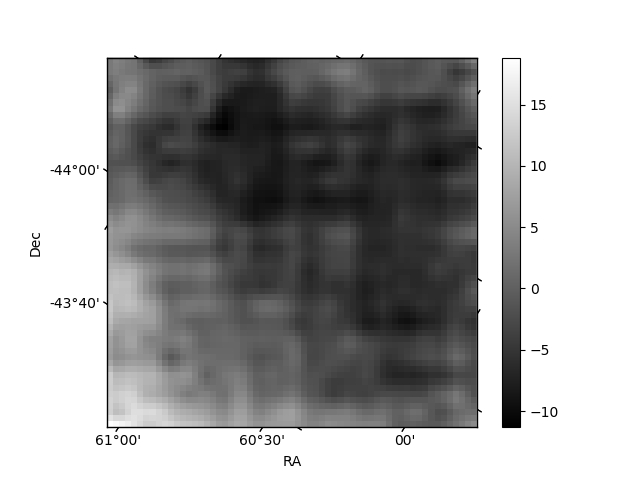
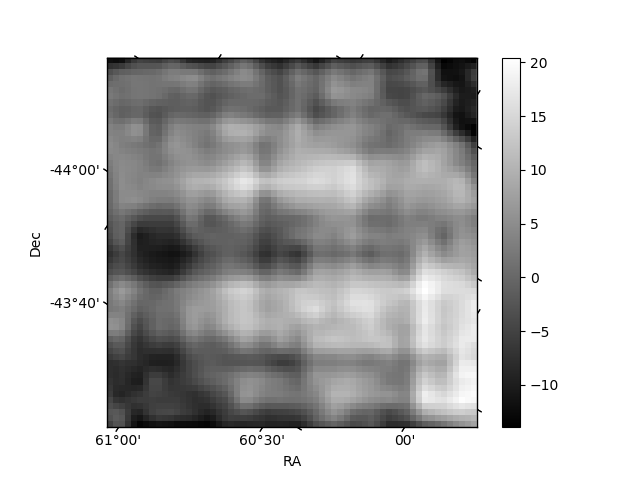
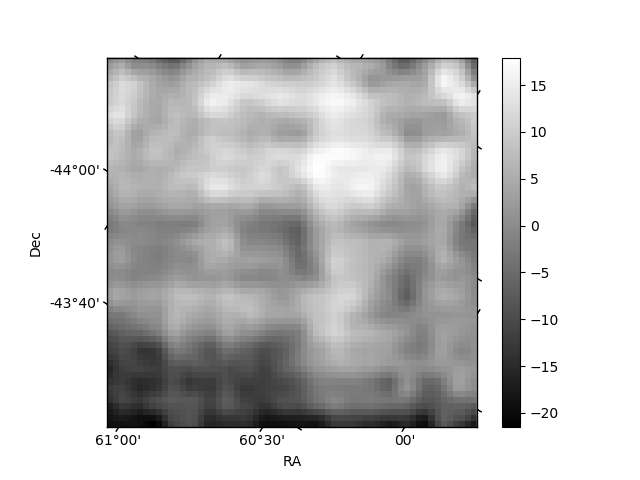
Histogram calculated using DETX and DETY for each event in the final _common_clean file
| Quadrant A | 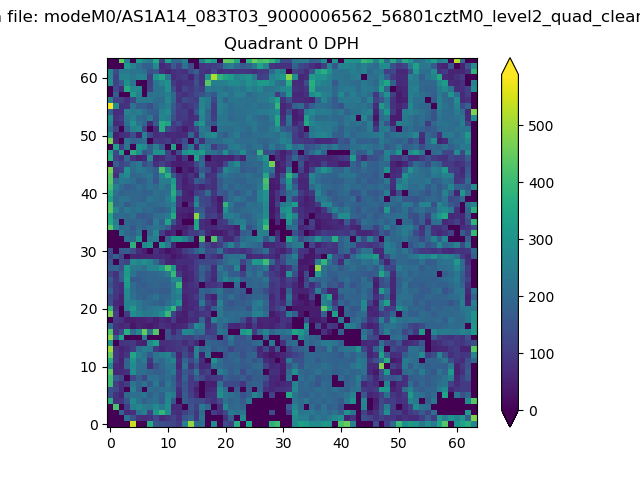 |
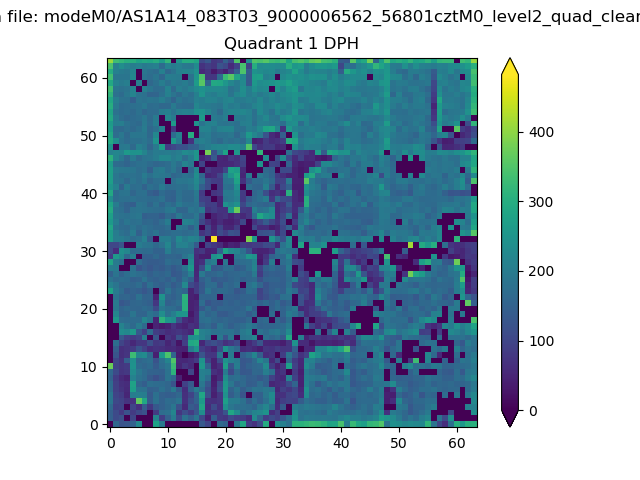 |
Quadrant B |
|---|---|---|---|
| Quadrant D | 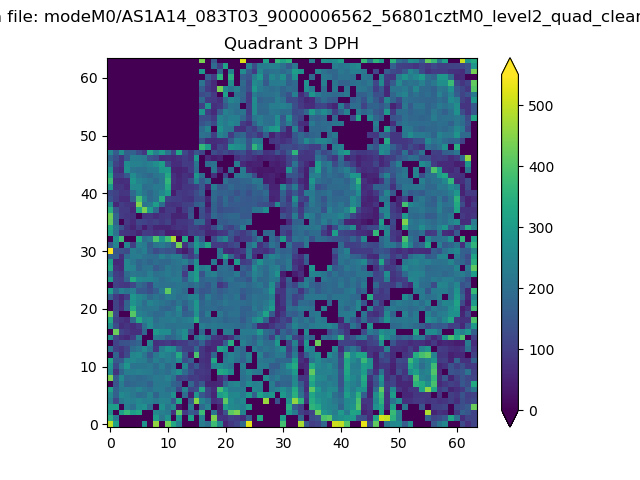 |
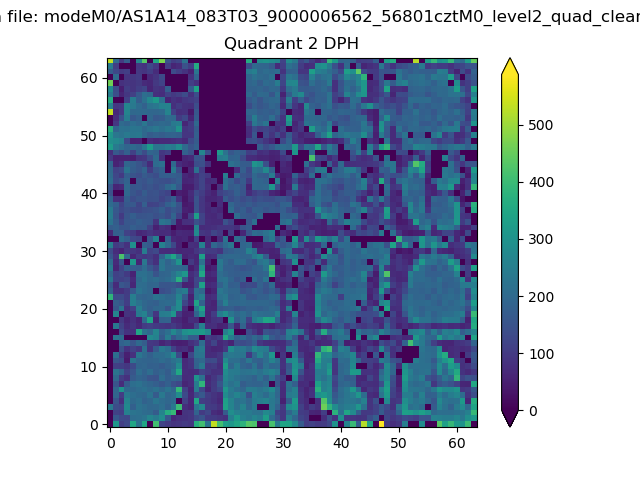 |
Quadrant C |
| Plot type | Count rate plots | Images |
|---|---|---|
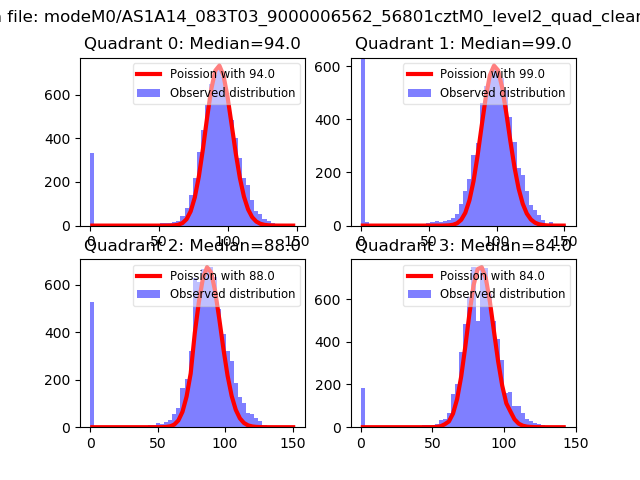
| Comparison with Poisson distribution Blue bars denote a histogram of data divided into 1 sec bins. Red curve is a Poisson curve with rate = median count rate of data. |
 |
 |
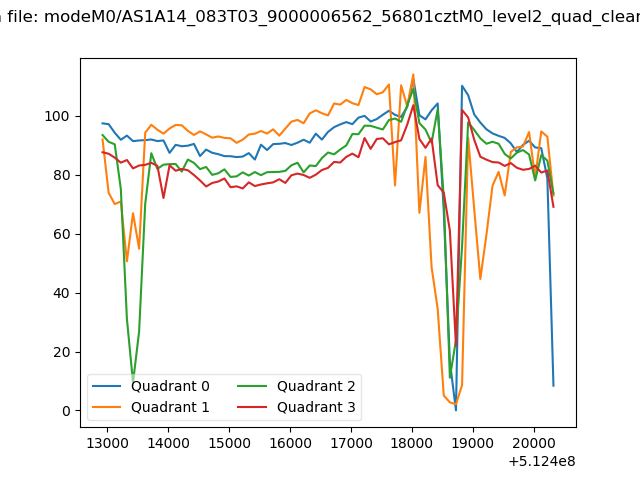
| Quadrant-wise count rates Data is divided into 100 sec bins |
 |
|
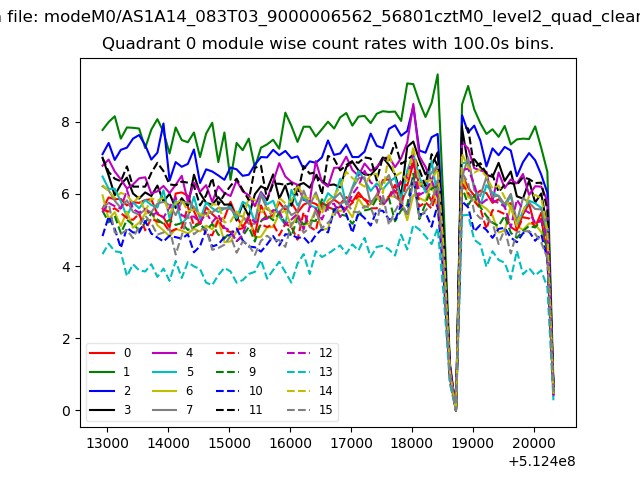
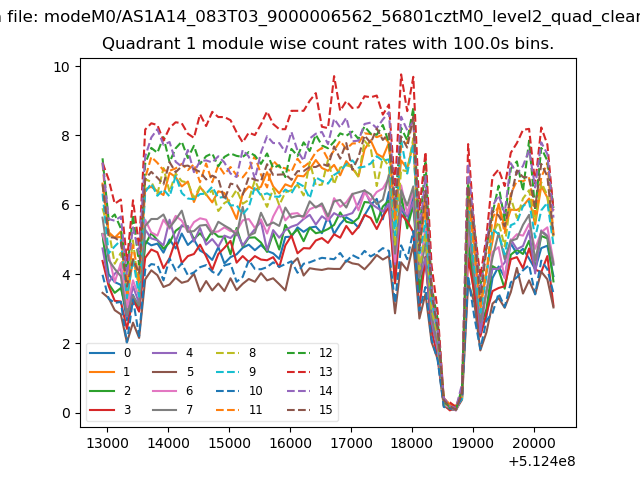
| Module-wise count rates for Quadrant A Data is divided into 100 sec bins |
 |
 |
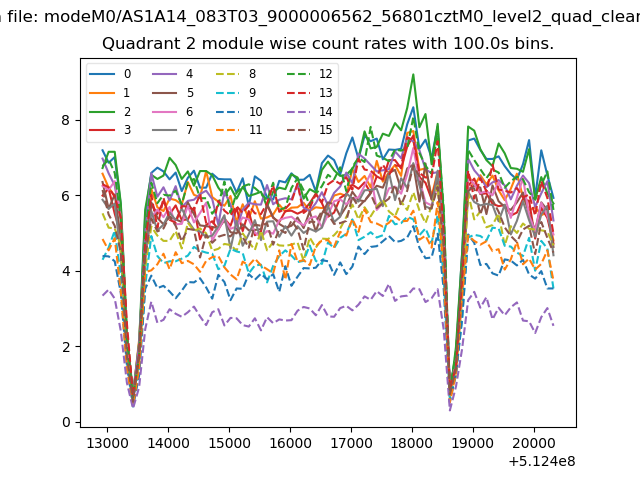
| Module-wise count rates for Quadrant B Data is divided into 100 sec bins |
 |
 |
| Module-wise count rates for Quadrant C Data is divided into 100 sec bins |
 |
 |
| Module-wise count rates for Quadrant D Data is divided into 100 sec bins |
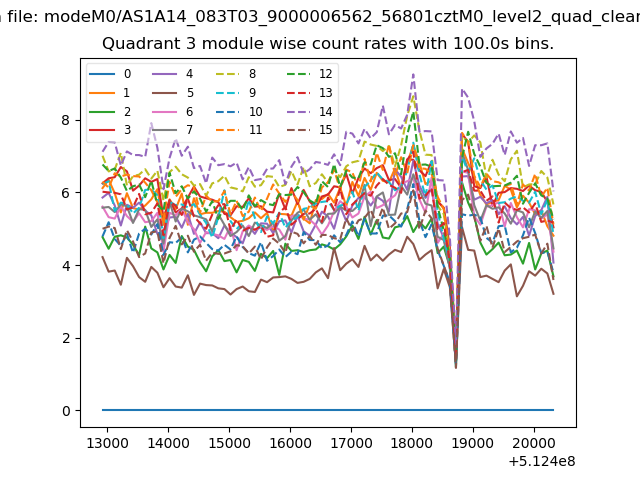 |
 |
| Parameter | Plot |
|---|---|
| CZT HV Monitor | 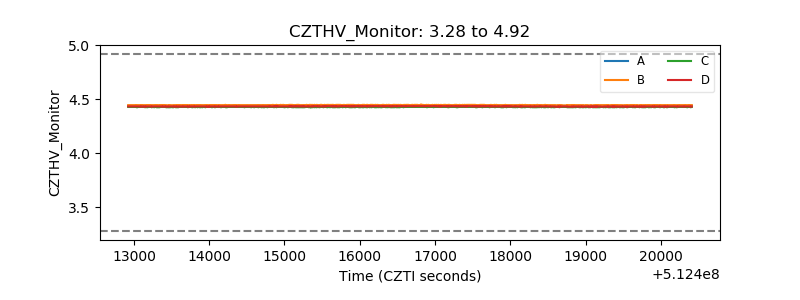 |
| D_VDD | 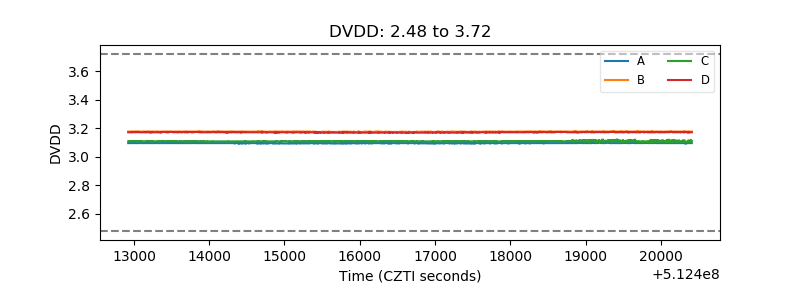 |
| Temperature 1 | 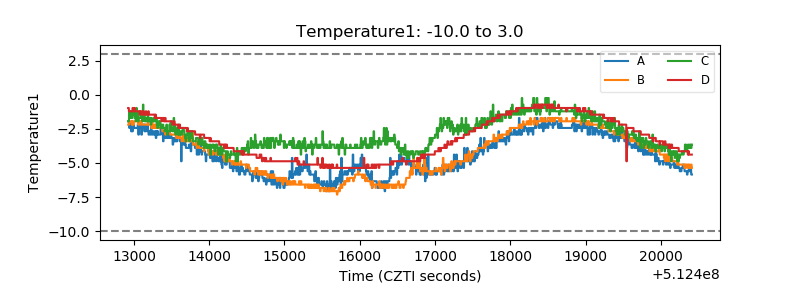 |
| Veto HV Monitor | 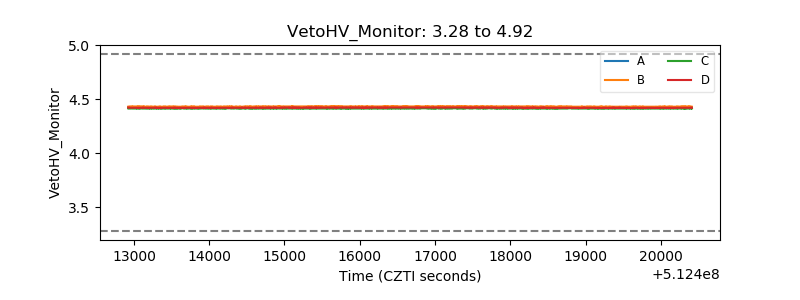 |
| Veto LLD | 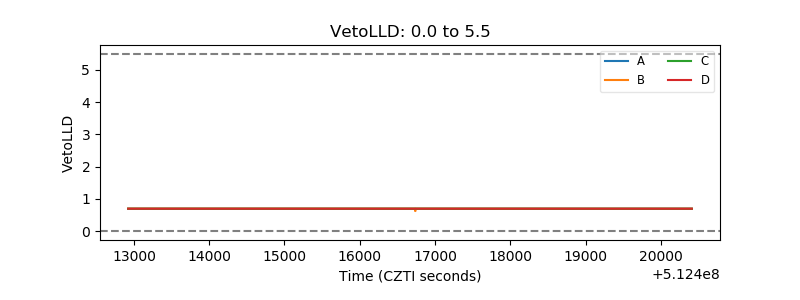 |
| Alpha Counter | 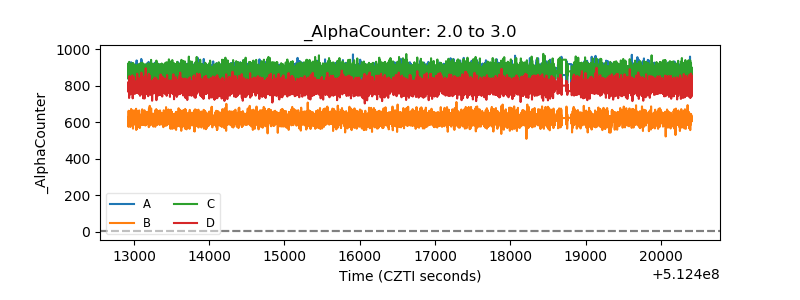 |
| _CPM_Rate | 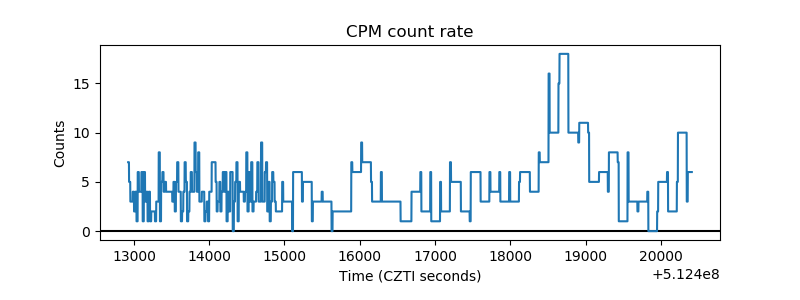 |
| CZT Counter | 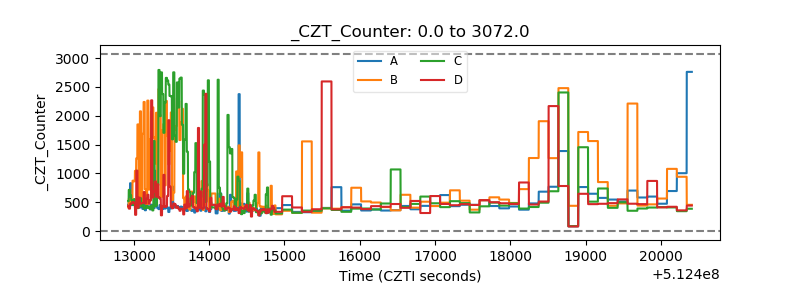 |
| +2.5 Volts monitor | 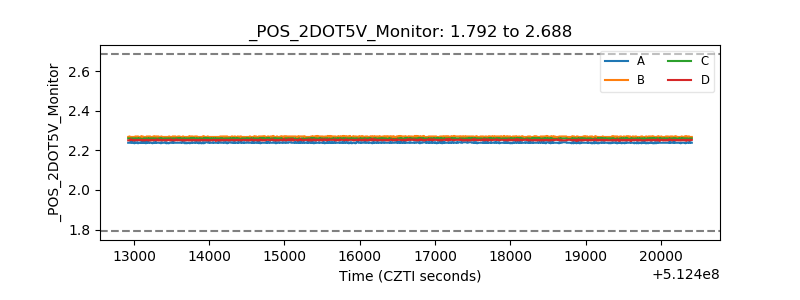 |
| +5 Volts monitor | 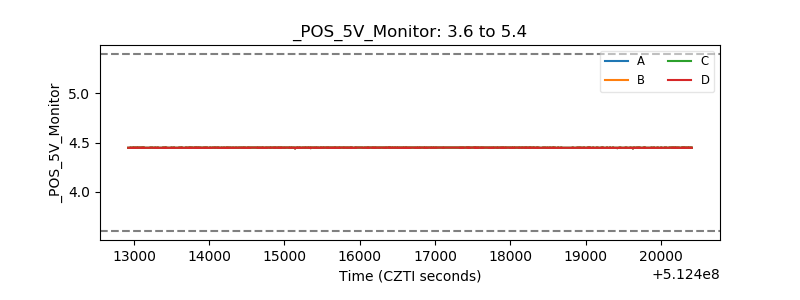 |
| _ROLL_ROT | 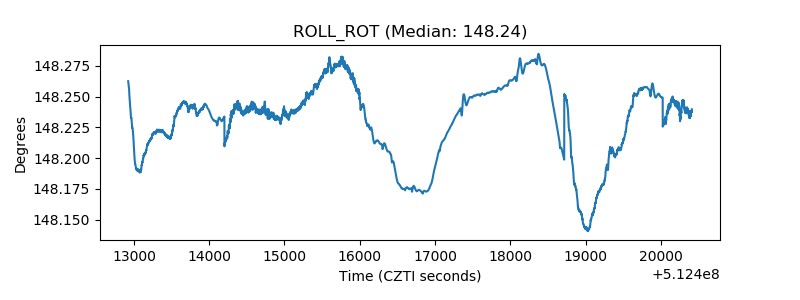 |
| _Roll_DEC | 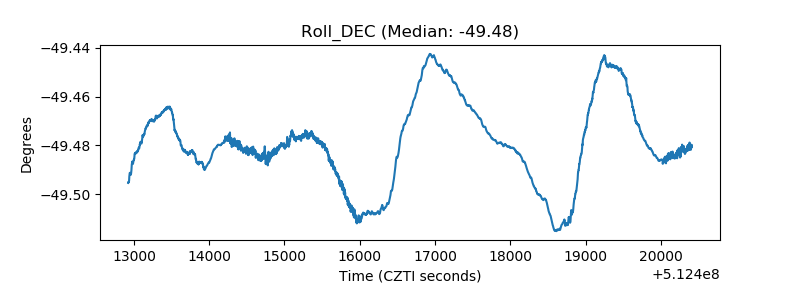 |
| _Roll_RA | 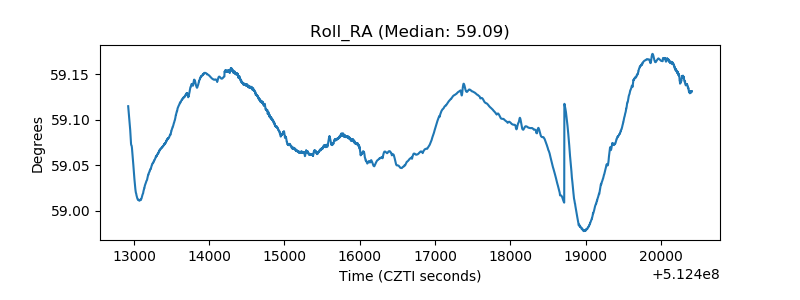 |
| Veto Counter | 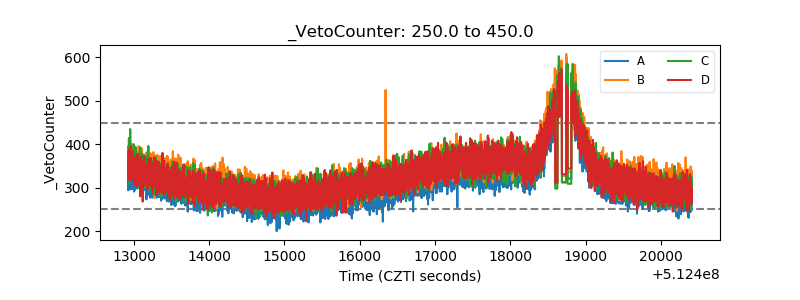 |