| Param | Original file | Final file |
|---|---|---|
| Filename | modeM0/AS1A14_083T03_9000006562_56806cztM0_level2.fits | modeM0/AS1A14_083T03_9000006562_56806cztM0_level2_quad_clean.evt |
| Size (bytes) | 1,204,185,600 | 187,145,280 |
| Size | 1.1 GB | 178.5 MB |
| Events in quadrant A | 7,314,051 | 1,324,300 |
| Events in quadrant B | 20,734,465 | 950,220 |
| Events in quadrant C | 7,704,192 | 1,224,032 |
| Events in quadrant D | 7,691,480 | 1,159,621 |
| Mode M9 | |||
|---|---|---|---|
| Quadrant | BADHDUFLAG | Total packets | Discarded packets |
| A | 0 | 7 | 0 |
| B | 0 | 7 | 0 |
| C | 0 | 7 | 0 |
| D | 0 | 7 | 0 |
| Mode SS | |||
|---|---|---|---|
| Quadrant | BADHDUFLAG | Total packets | Discarded packets |
| A | 0 | 296 | 0 |
| B | 0 | 296 | 0 |
| C | 0 | 296 | 0 |
| D | 0 | 296 | 0 |
| Mode M0 | |||
|---|---|---|---|
| Quadrant | BADHDUFLAG | Total packets | Discarded packets |
| A | 0 | 31910 | 2 |
| B | 0 | 71762 | 2 |
| C | 0 | 34014 | 5 |
| D | 0 | 33664 | 2 |
| Quadrant | Total seconds | Saturated seconds | Saturation percentage |
|---|---|---|---|
| A | 14595 | 229 | 1.569030% |
| B | 14596 | 5492 | 37.626747% |
| C | 14594 | 480 | 3.289023% |
| D | 14596 | 332 | 2.274596% |
Noise dominated data is calculated using 1-second bins in cleaned event files. If a bin has >2000 counts, and if more than 50% of those come from <1% of pixels, then it is considered to be noise-dominated and hence unusable.
| Quadrant | # 1 sec bins | Bins with >0 counts | Bins with >2000 counts | High rate bins dominated by noise | Noise dominated (total time) | Noise dominated (detector-on time) | Marked lightcurve |
|---|---|---|---|---|---|---|---|
| A | 15295 | 14596 | 97 | 97 | 0.63% | 0.66% | 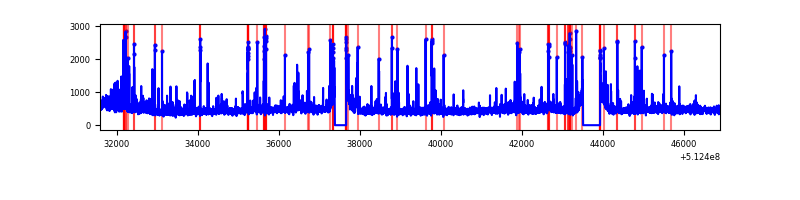 |
| B | 15295 | 14596 | 4599 | 4599 | 30.07% | 31.51% | 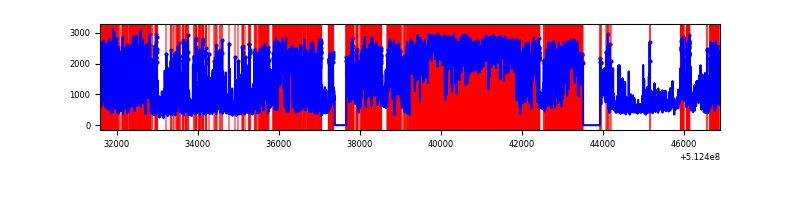 |
| C | 15296 | 14595 | 383 | 383 | 2.50% | 2.62% | 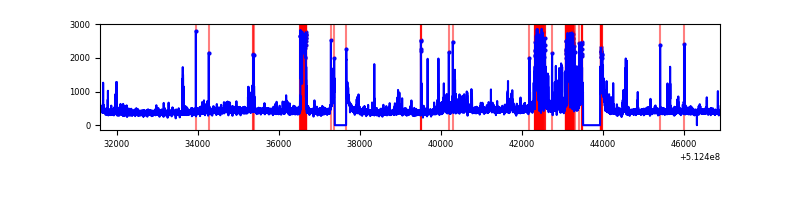 |
| D | 15296 | 14597 | 269 | 269 | 1.76% | 1.84% | 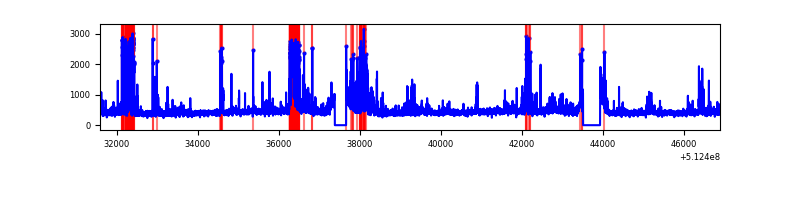 |
Top three noisy pixels from each quadrant. If the there are fewer than three noisy pixels in the level2.evt file, extra rows are filled as -1
| Pixel properties | Quadrant properties | ||||||
|---|---|---|---|---|---|---|---|
| Quadrant | DetID | PixID | Counts | Sigma | Mean | Median | Sigma |
| A | 3 | 14 | 751846 | 1992.69 | 1539 | 1496 | 376.6 |
| A | 10 | 251 | 330215 | 872.97 | 1539 | 1496 | 376.6 |
| A | 3 | 62 | 81890 | 213.5 | 1539 | 1496 | 376.6 |
| B | 5 | 172 | 7921510 | 29491.52 | 1251 | 1202 | 268.6 |
| B | 5 | 185 | 4054204 | 15091.48 | 1251 | 1202 | 268.6 |
| B | 4 | 206 | 2751670 | 10241.46 | 1251 | 1202 | 268.6 |
| C | 15 | 230 | 1017027 | 2543.21 | 1478 | 1467 | 399.3 |
| C | 9 | 38 | 497187 | 1241.41 | 1478 | 1467 | 399.3 |
| C | 14 | 96 | 158973 | 394.43 | 1478 | 1467 | 399.3 |
| D | 2 | 249 | 1164937 | 2793.92 | 1487 | 1423 | 416.4 |
| D | 8 | 160 | 230389 | 549.81 | 1487 | 1423 | 416.4 |
| D | 5 | 173 | 140655 | 334.33 | 1487 | 1423 | 416.4 |
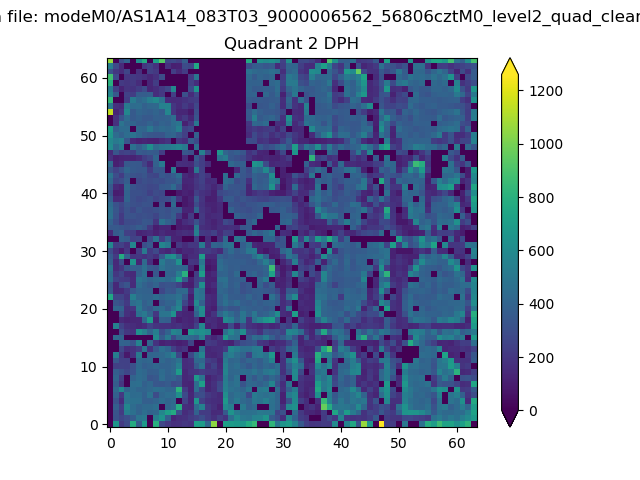
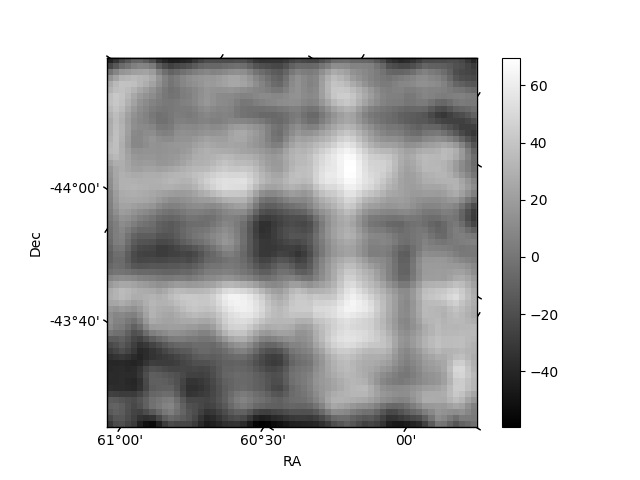
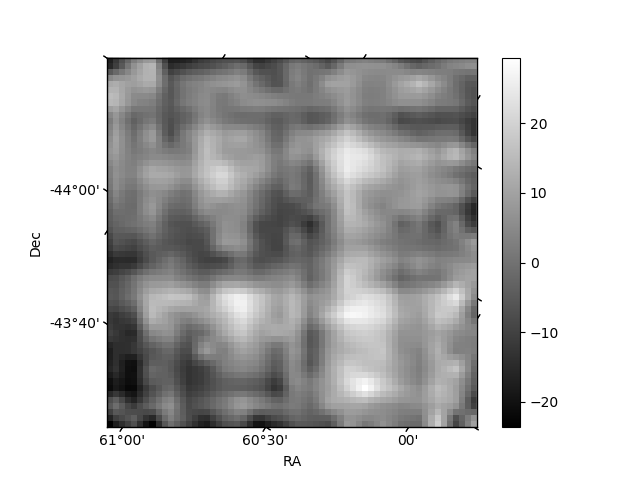
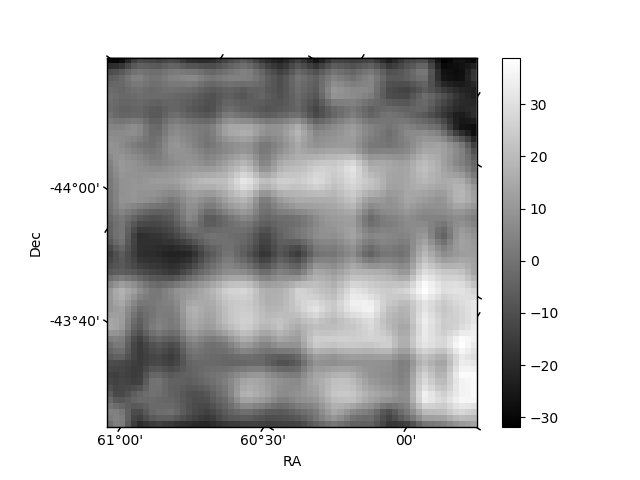
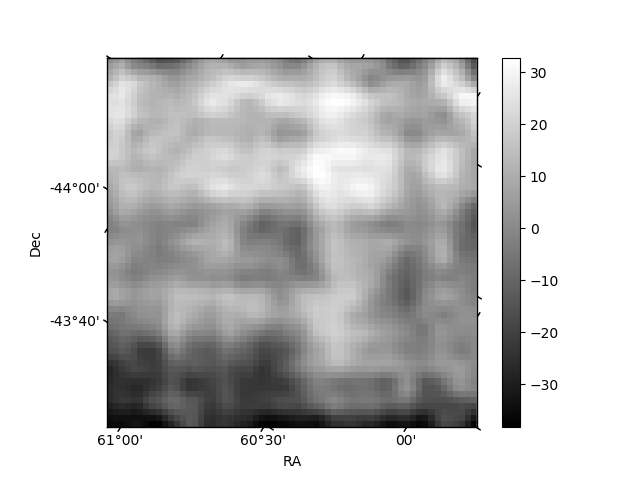
Histogram calculated using DETX and DETY for each event in the final _common_clean file
| Quadrant A | 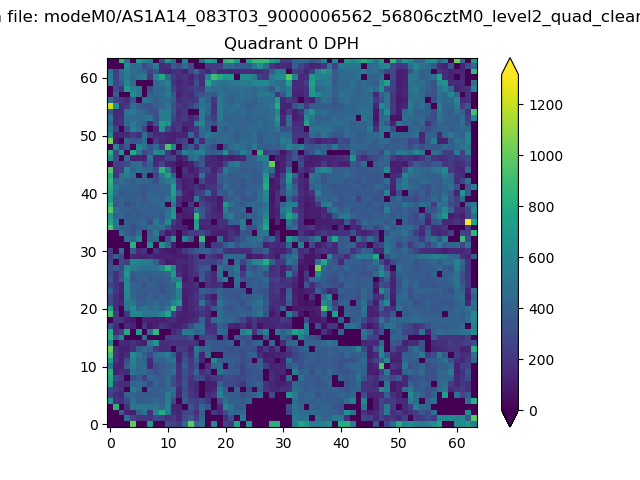 |
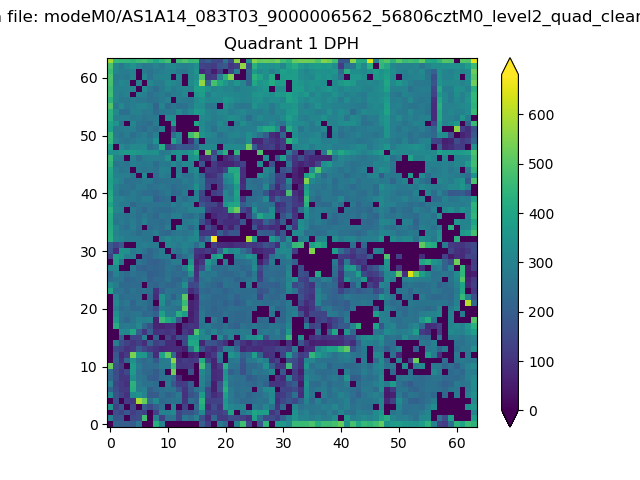 |
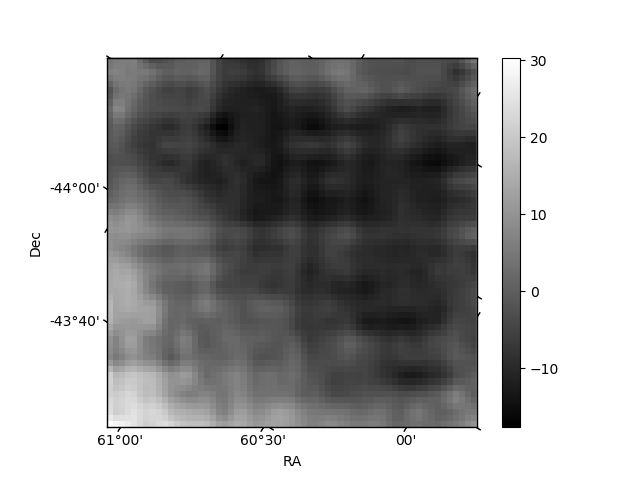
Quadrant B |
|---|---|---|---|
| Quadrant D | 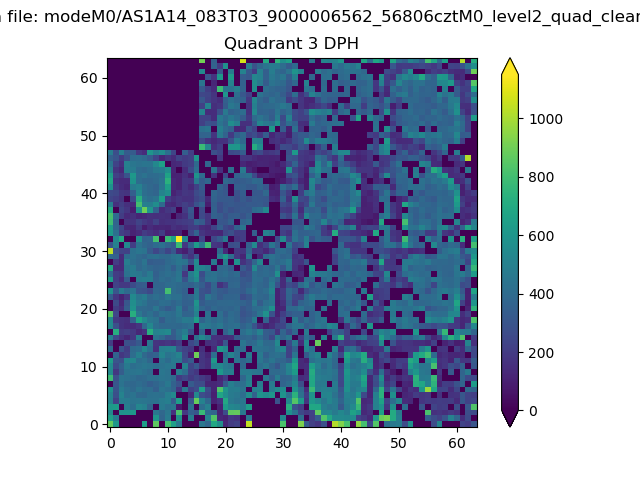 |
 |
Quadrant C |
| Plot type | Count rate plots | Images |
|---|---|---|
| Comparison with Poisson distribution Blue bars denote a histogram of data divided into 1 sec bins. Red curve is a Poisson curve with rate = median count rate of data. |
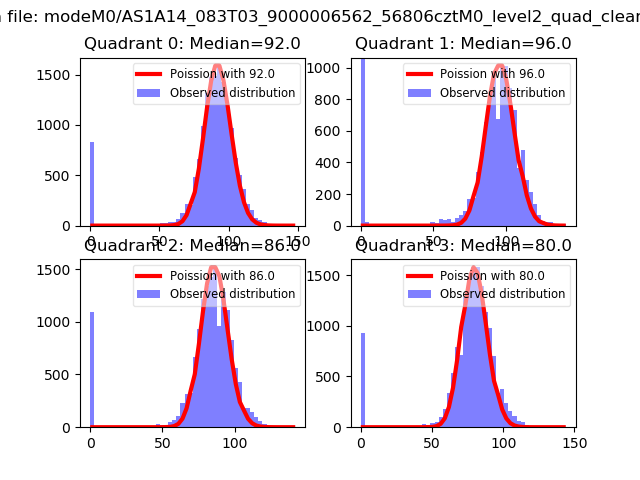 |
 |
| Quadrant-wise count rates Data is divided into 100 sec bins |
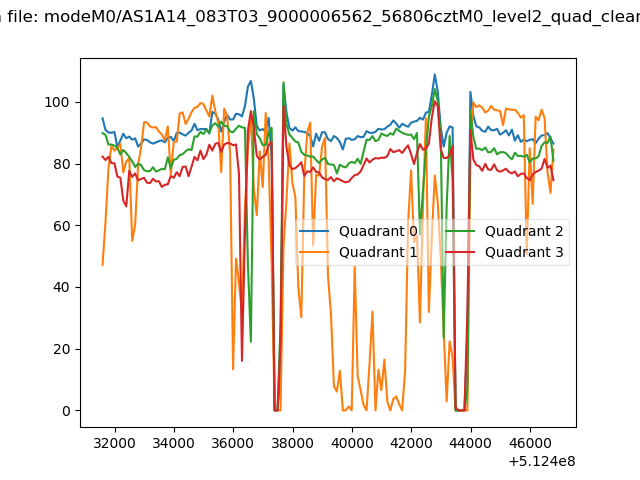 |
|
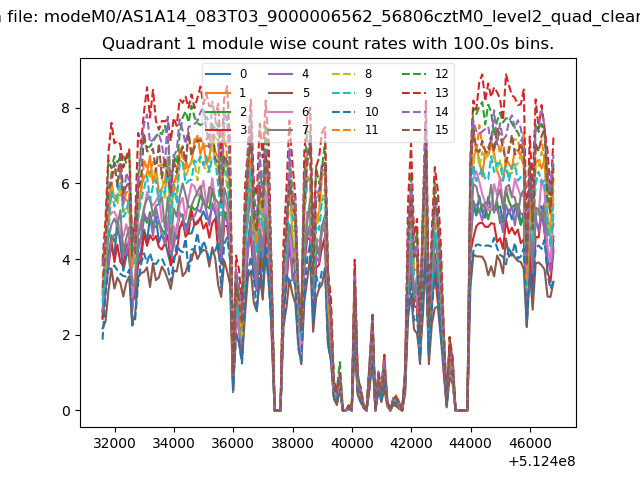
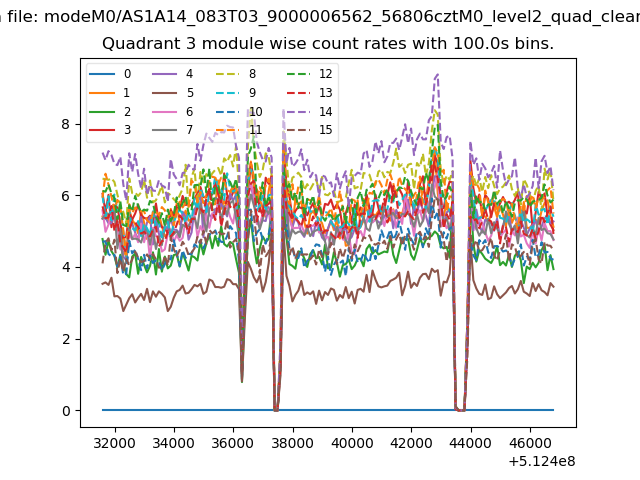
| Module-wise count rates for Quadrant A Data is divided into 100 sec bins |
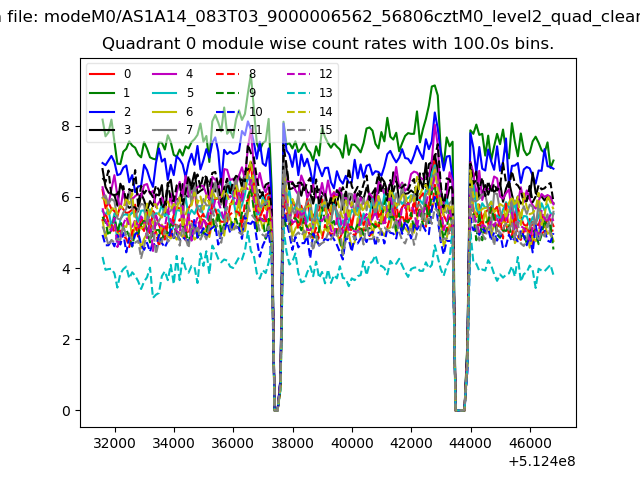 |
 |
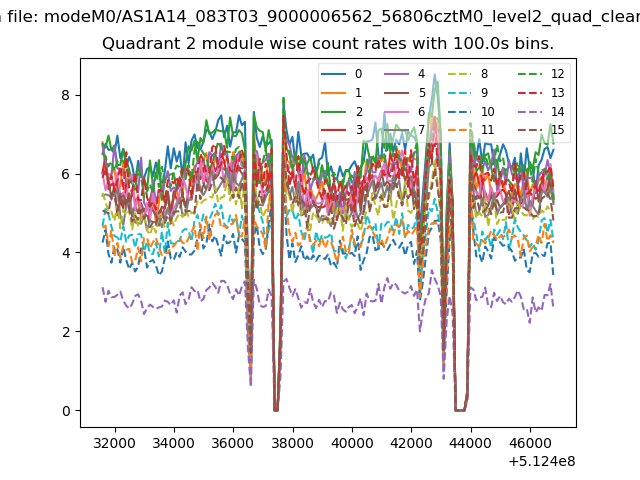
| Module-wise count rates for Quadrant B Data is divided into 100 sec bins |
 |
 |
| Module-wise count rates for Quadrant C Data is divided into 100 sec bins |
 |
 |
| Module-wise count rates for Quadrant D Data is divided into 100 sec bins |
 |
 |
| Parameter | Plot |
|---|---|
| CZT HV Monitor | 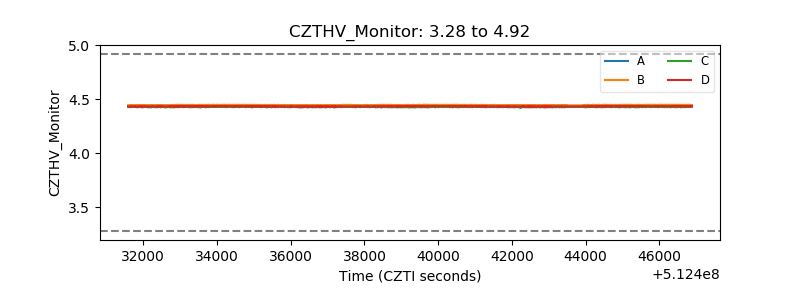 |
| D_VDD | 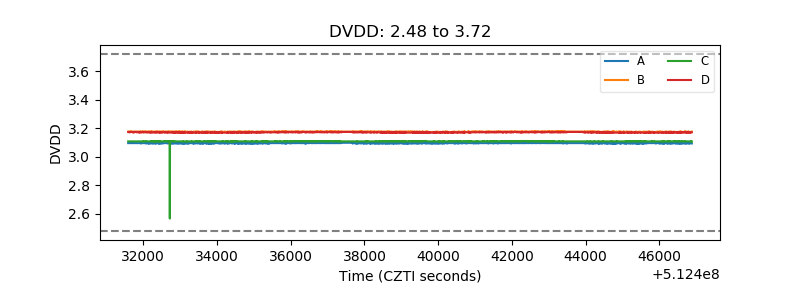 |
| Temperature 1 | 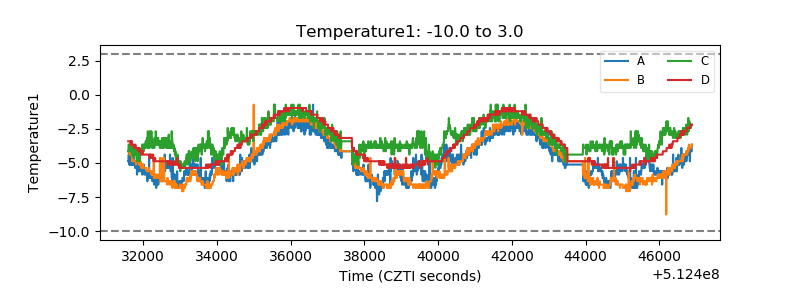 |
| Veto HV Monitor | 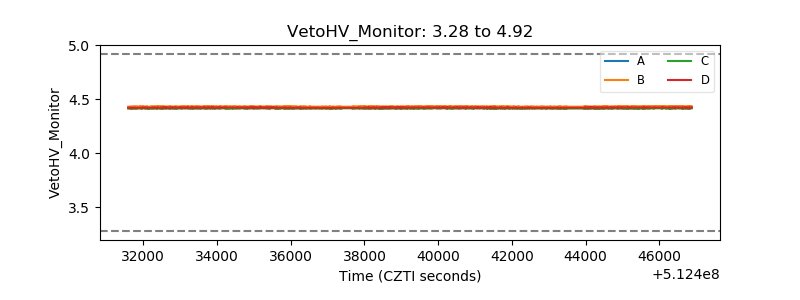 |
| Veto LLD | 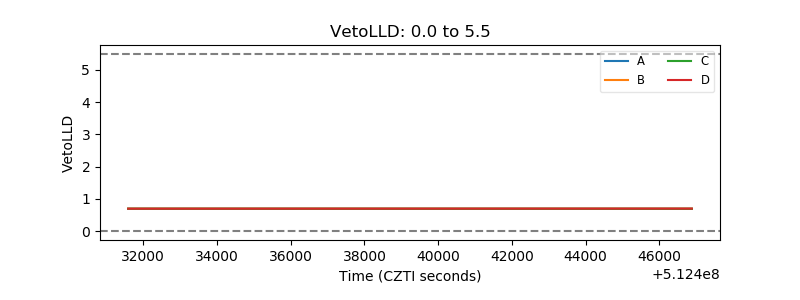 |
| Alpha Counter | 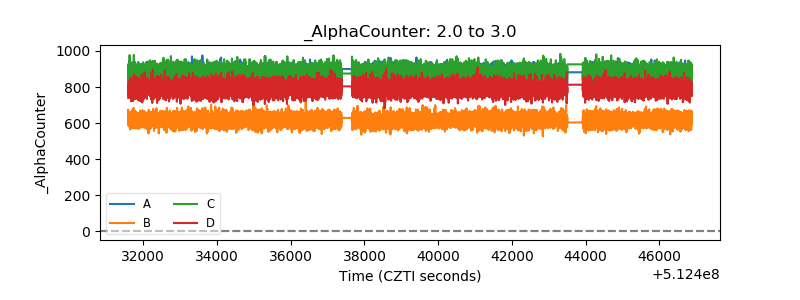 |
| _CPM_Rate | 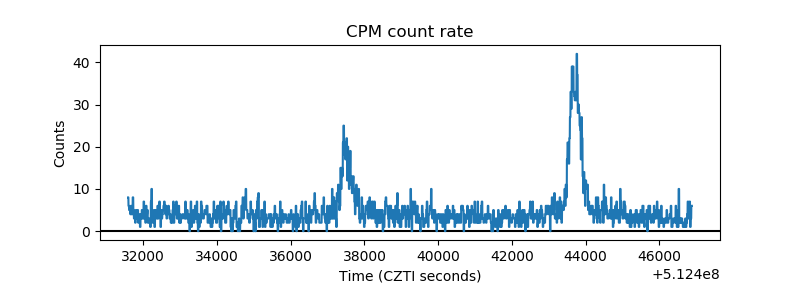 |
| CZT Counter | 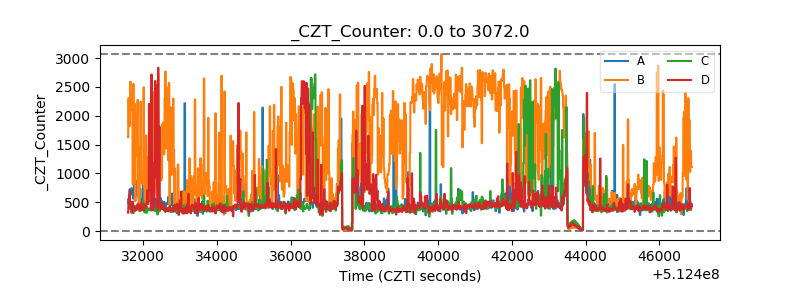 |
| +2.5 Volts monitor | 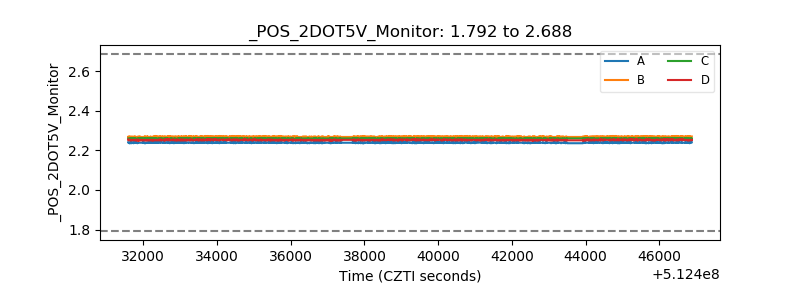 |
| +5 Volts monitor | 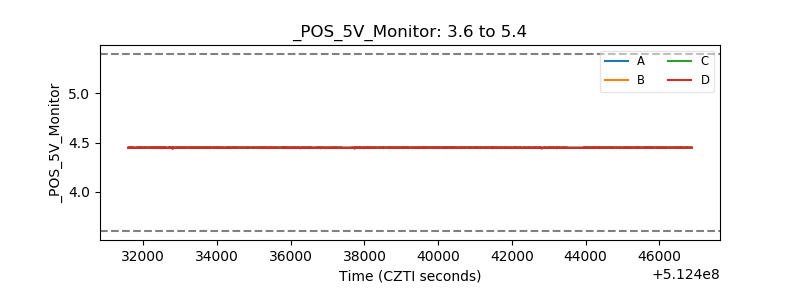 |
| _ROLL_ROT | 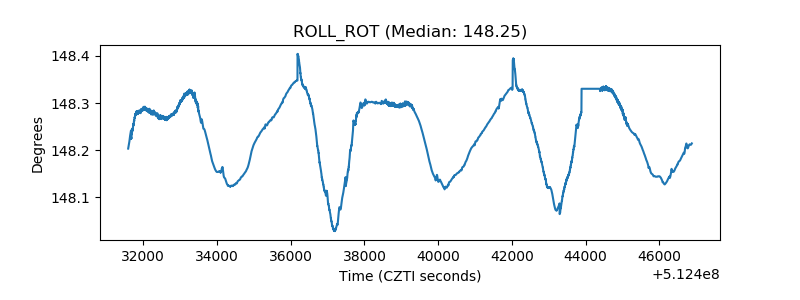 |
| _Roll_DEC | 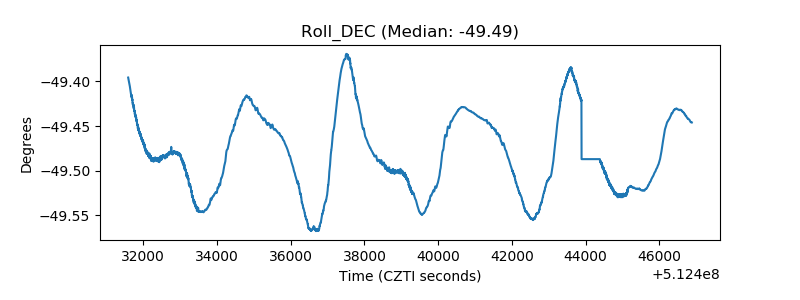 |
| _Roll_RA | 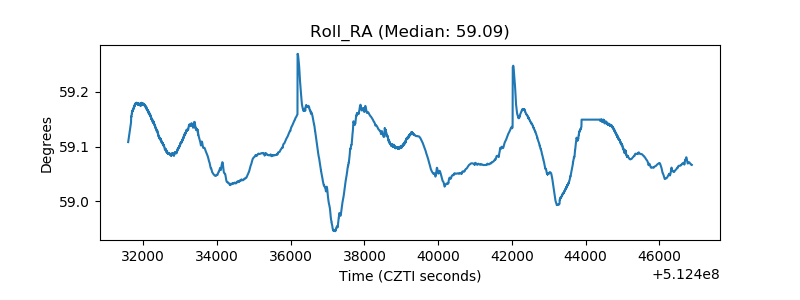 |
| Veto Counter | 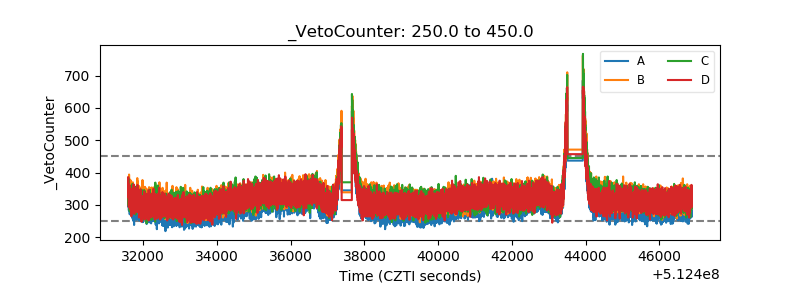 |