| Param | Original file | Final file |
|---|---|---|
| Filename | modeM0/AS1A14_083T03_9000006562_56807cztM0_level2.fits | modeM0/AS1A14_083T03_9000006562_56807cztM0_level2_quad_clean.evt |
| Size (bytes) | 777,602,880 | 137,252,160 |
| Size | 741.6 MB | 130.9 MB |
| Events in quadrant A | 5,909,449 | 933,201 |
| Events in quadrant B | 9,882,198 | 853,660 |
| Events in quadrant C | 6,312,467 | 832,754 |
| Events in quadrant D | 5,897,388 | 836,574 |
| Mode M9 | |||
|---|---|---|---|
| Quadrant | BADHDUFLAG | Total packets | Discarded packets |
| A | 0 | 15 | 0 |
| B | 0 | 15 | 0 |
| C | 0 | 15 | 0 |
| D | 0 | 15 | 0 |
| Mode SS | |||
|---|---|---|---|
| Quadrant | BADHDUFLAG | Total packets | Discarded packets |
| A | 0 | 206 | 0 |
| B | 0 | 206 | 0 |
| C | 0 | 206 | 0 |
| D | 0 | 206 | 0 |
| Mode M0 | |||
|---|---|---|---|
| Quadrant | BADHDUFLAG | Total packets | Discarded packets |
| A | 0 | 24205 | 2 |
| B | 0 | 36278 | 2 |
| C | 0 | 26560 | 2 |
| D | 0 | 24713 | 2 |
| Quadrant | Total seconds | Saturated seconds | Saturation percentage |
|---|---|---|---|
| A | 10092 | 219 | 2.170036% |
| B | 10092 | 1834 | 18.172810% |
| C | 10093 | 855 | 8.471218% |
| D | 10093 | 312 | 3.091251% |
Noise dominated data is calculated using 1-second bins in cleaned event files. If a bin has >2000 counts, and if more than 50% of those come from <1% of pixels, then it is considered to be noise-dominated and hence unusable.
| Quadrant | # 1 sec bins | Bins with >0 counts | Bins with >2000 counts | High rate bins dominated by noise | Noise dominated (total time) | Noise dominated (detector-on time) | Marked lightcurve |
|---|---|---|---|---|---|---|---|
| A | 11606 | 10091 | 104 | 104 | 0.90% | 1.03% | 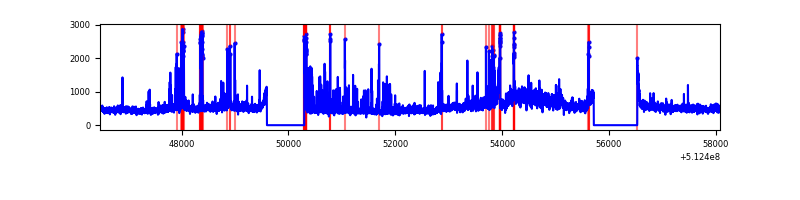 |
| B | 11606 | 10091 | 1415 | 1415 | 12.19% | 14.02% | 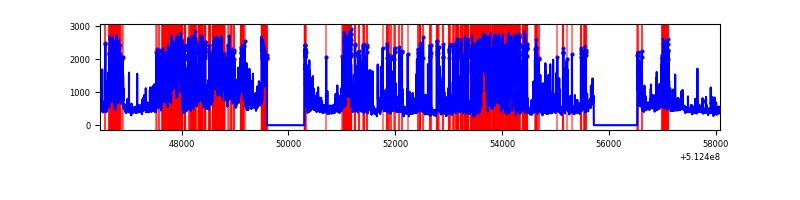 |
| C | 11607 | 10092 | 733 | 733 | 6.32% | 7.26% | 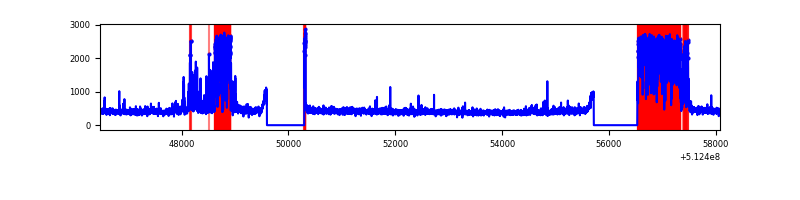 |
| D | 11607 | 10092 | 257 | 257 | 2.21% | 2.55% | 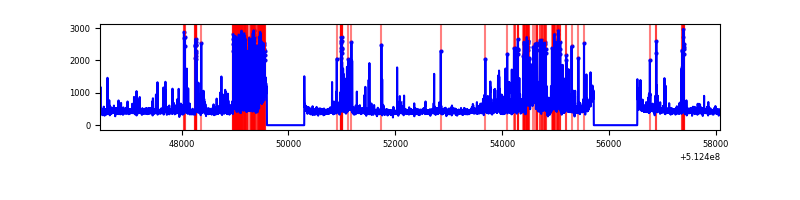 |
Top three noisy pixels from each quadrant. If the there are fewer than three noisy pixels in the level2.evt file, extra rows are filled as -1
| Pixel properties | Quadrant properties | ||||||
|---|---|---|---|---|---|---|---|
| Quadrant | DetID | PixID | Counts | Sigma | Mean | Median | Sigma |
| A | 3 | 14 | 1388063 | 5191.46 | 1079 | 1047 | 267.2 |
| A | 10 | 251 | 207795 | 773.84 | 1079 | 1047 | 267.2 |
| A | 3 | 62 | 88959 | 329.04 | 1079 | 1047 | 267.2 |
| B | 4 | 206 | 3170573 | 15152.84 | 980 | 941 | 209.2 |
| B | 5 | 185 | 1285346 | 6140.27 | 980 | 941 | 209.2 |
| B | 8 | 128 | 586895 | 2801.23 | 980 | 941 | 209.2 |
| C | 15 | 230 | 2158515 | 7656.72 | 1029 | 1017 | 281.8 |
| C | 6 | 13 | 39167 | 135.39 | 1029 | 1017 | 281.8 |
| C | 12 | 112 | 22391 | 75.85 | 1029 | 1017 | 281.8 |
| D | 2 | 249 | 619571 | 2108.87 | 1045 | 1000 | 293.3 |
| D | 6 | 239 | 547995 | 1864.85 | 1045 | 1000 | 293.3 |
| D | 2 | 31 | 234989 | 797.73 | 1045 | 1000 | 293.3 |
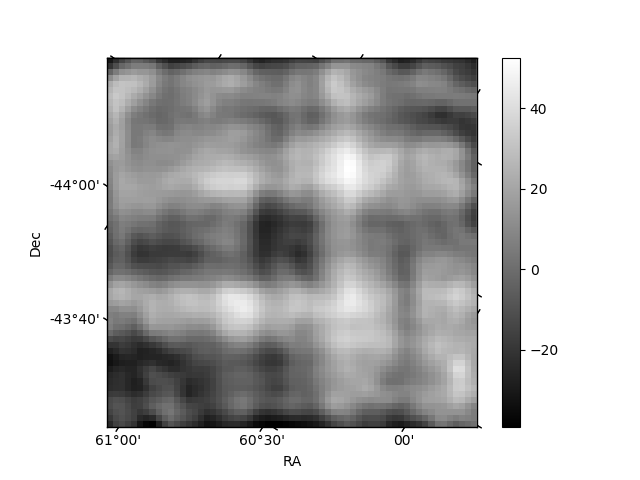
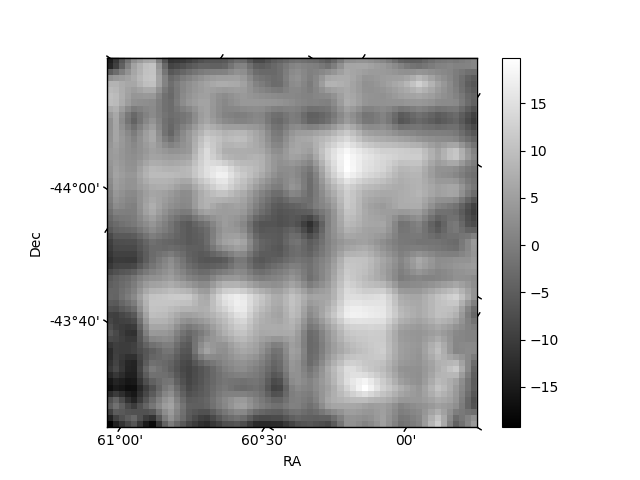
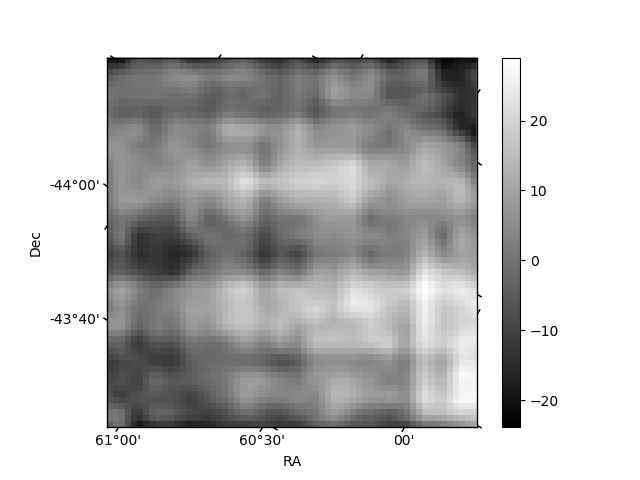
Histogram calculated using DETX and DETY for each event in the final _common_clean file
| Quadrant A | 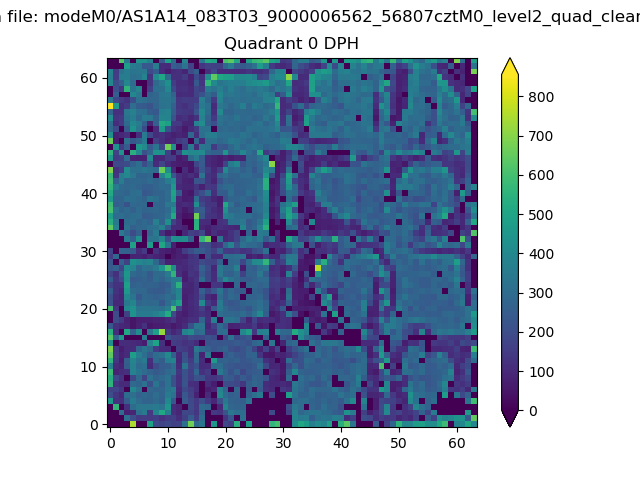 |
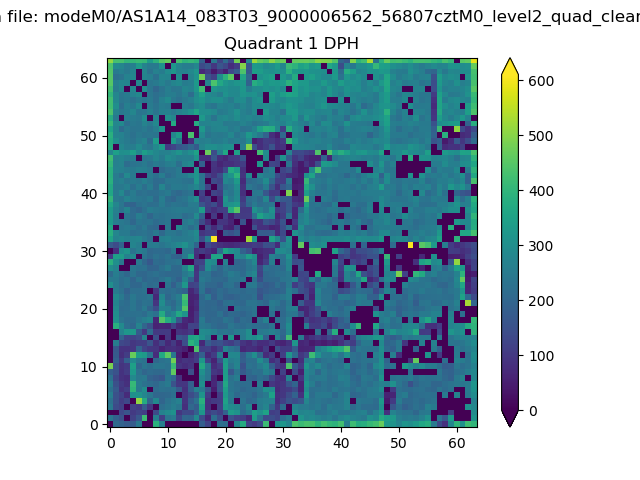 |
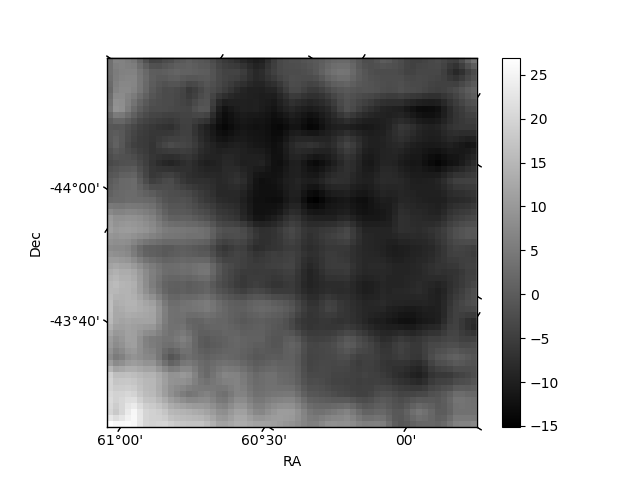
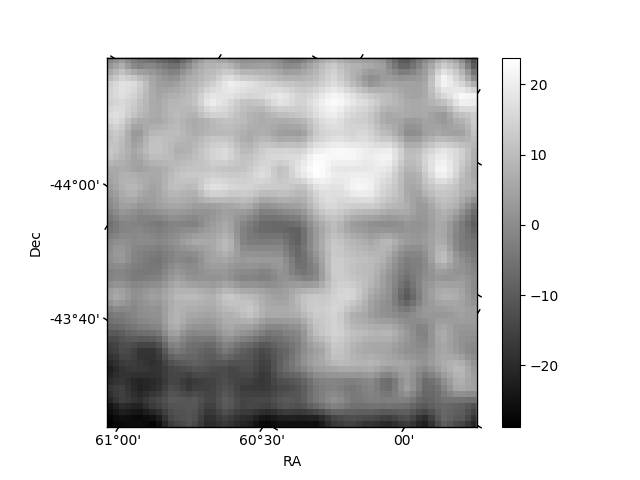
Quadrant B |
|---|---|---|---|
| Quadrant D | 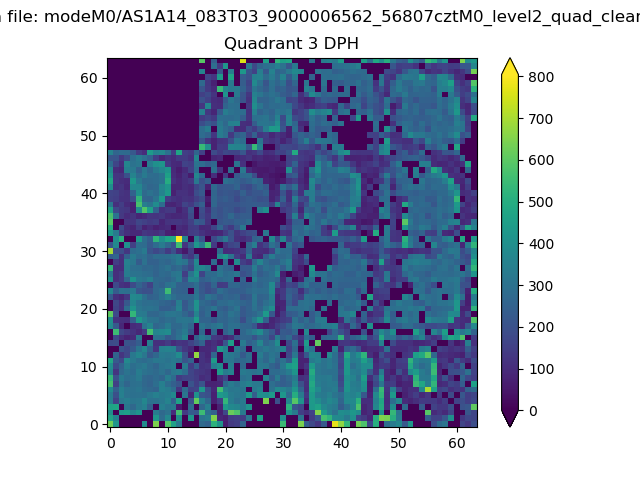 |
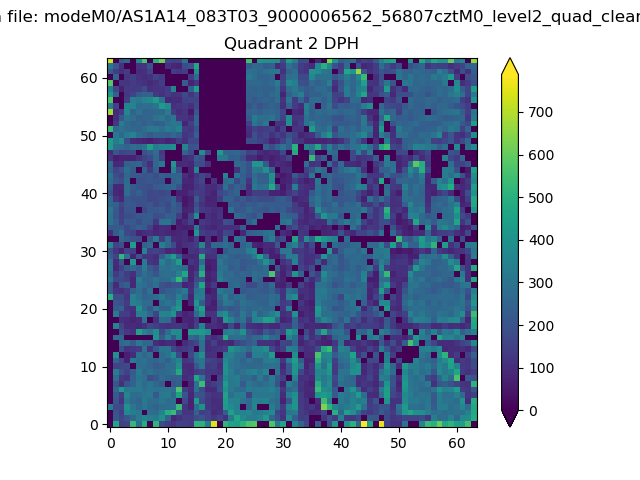 |
Quadrant C |
| Plot type | Count rate plots | Images |
|---|---|---|
| Comparison with Poisson distribution Blue bars denote a histogram of data divided into 1 sec bins. Red curve is a Poisson curve with rate = median count rate of data. |
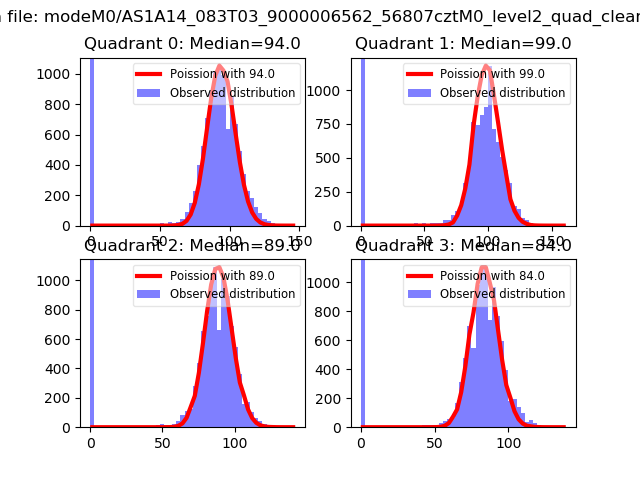 |
 |
| Quadrant-wise count rates Data is divided into 100 sec bins |
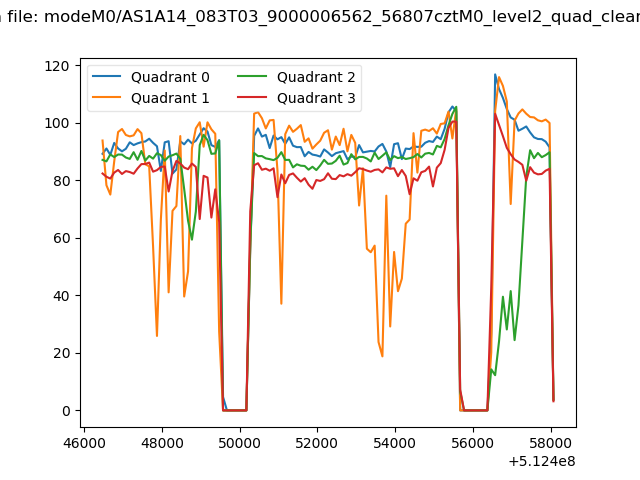 |
|
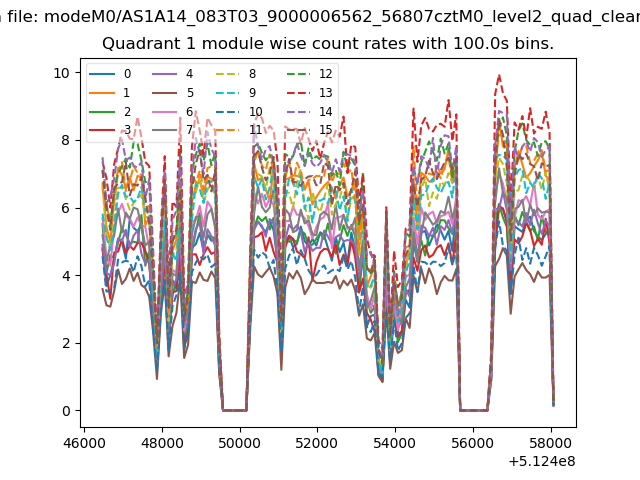
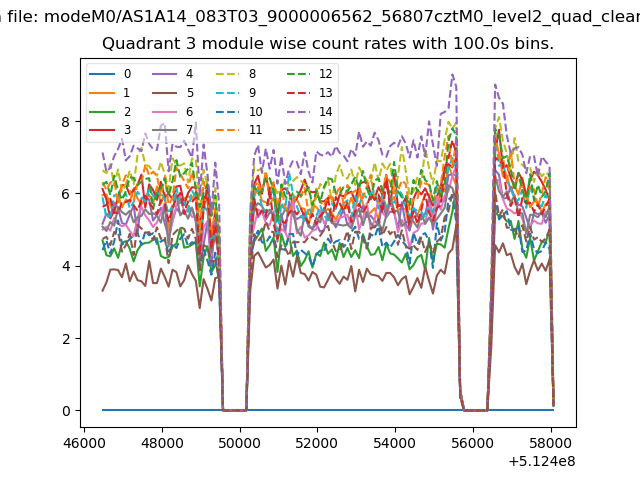
| Module-wise count rates for Quadrant A Data is divided into 100 sec bins |
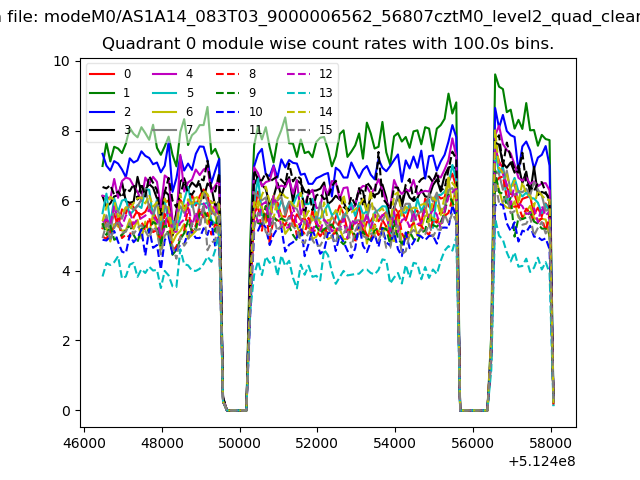 |
 |
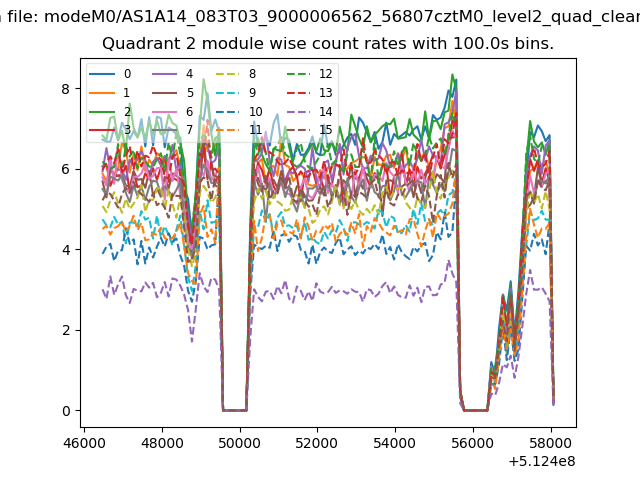
| Module-wise count rates for Quadrant B Data is divided into 100 sec bins |
 |
 |
| Module-wise count rates for Quadrant C Data is divided into 100 sec bins |
 |
 |
| Module-wise count rates for Quadrant D Data is divided into 100 sec bins |
 |
 |
| Parameter | Plot |
|---|---|
| CZT HV Monitor | 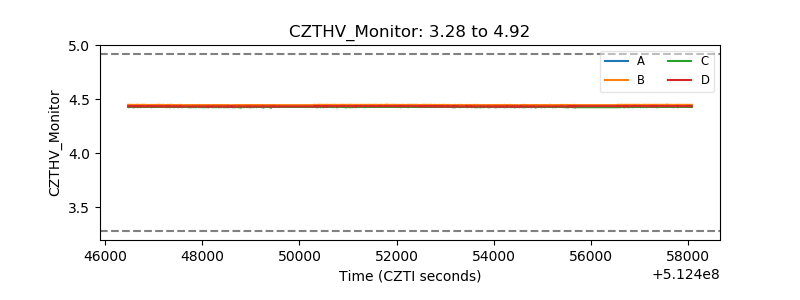 |
| D_VDD | 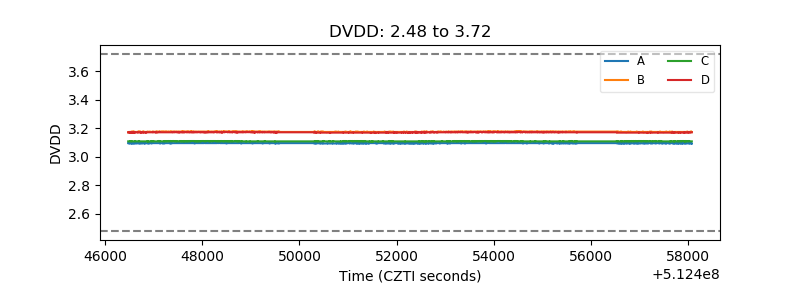 |
| Temperature 1 | 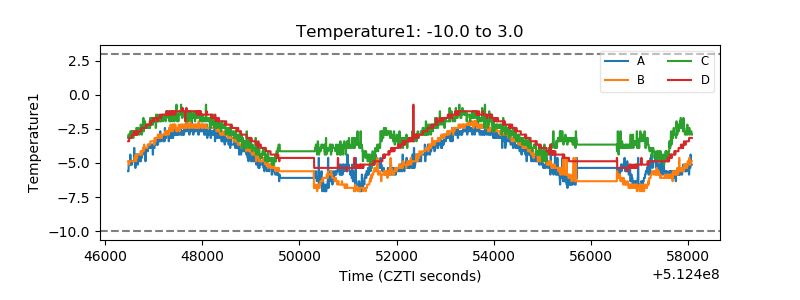 |
| Veto HV Monitor | 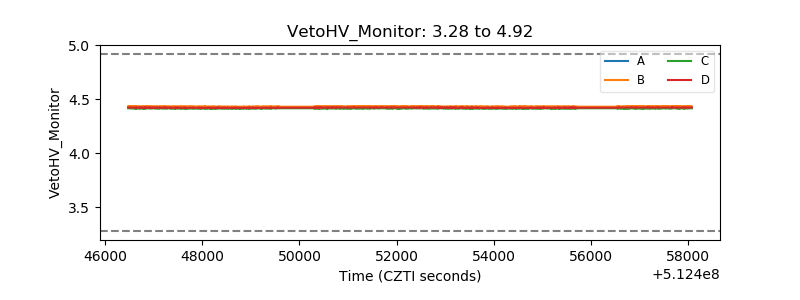 |
| Veto LLD | 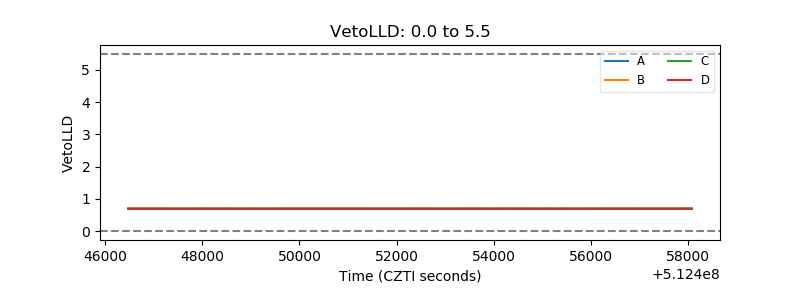 |
| Alpha Counter | 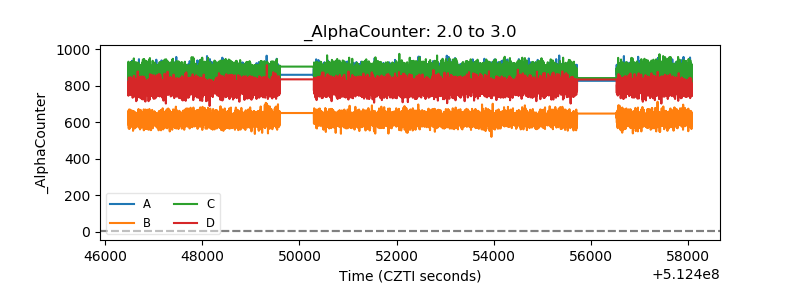 |
| _CPM_Rate | 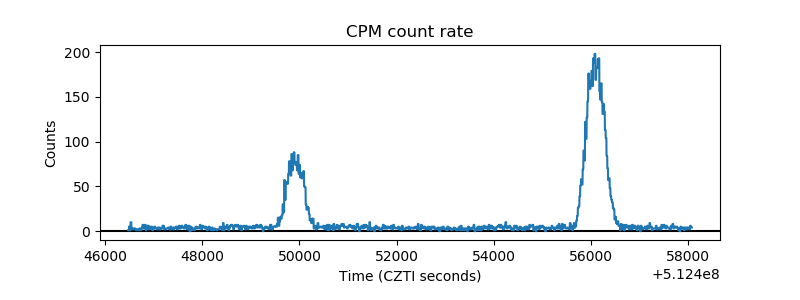 |
| CZT Counter | 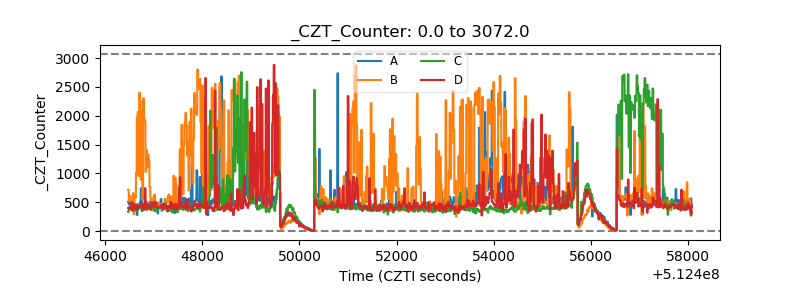 |
| +2.5 Volts monitor | 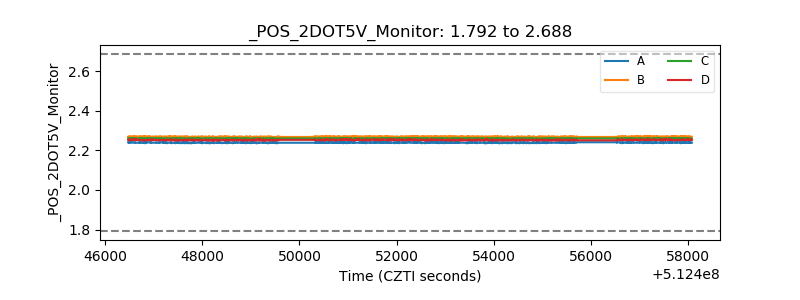 |
| +5 Volts monitor | 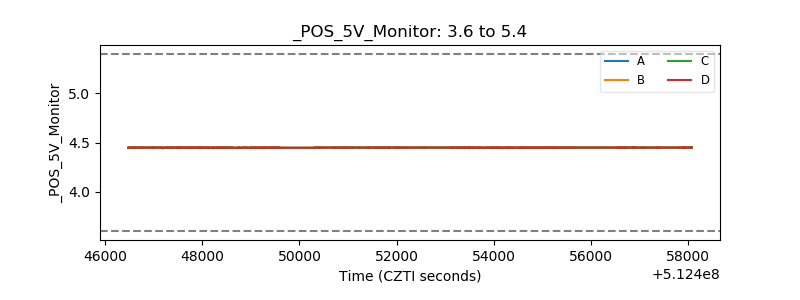 |
| _ROLL_ROT | 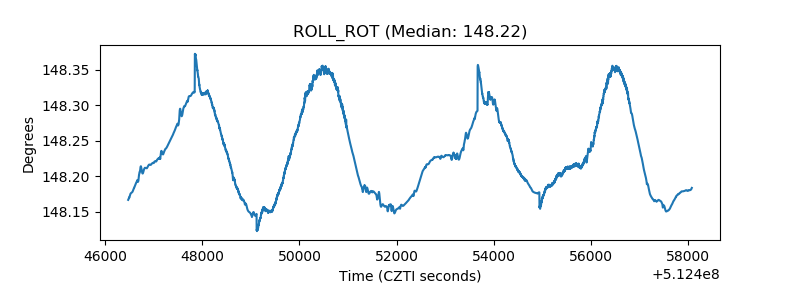 |
| _Roll_DEC | 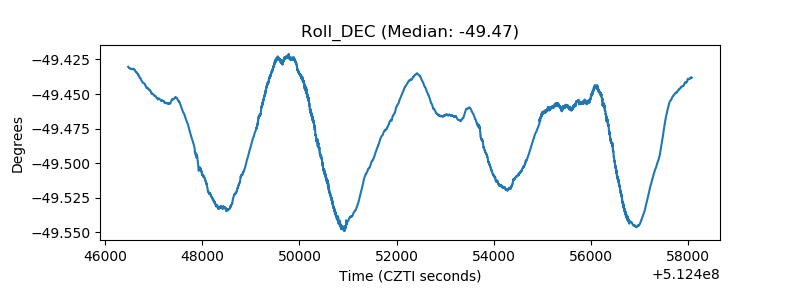 |
| _Roll_RA | 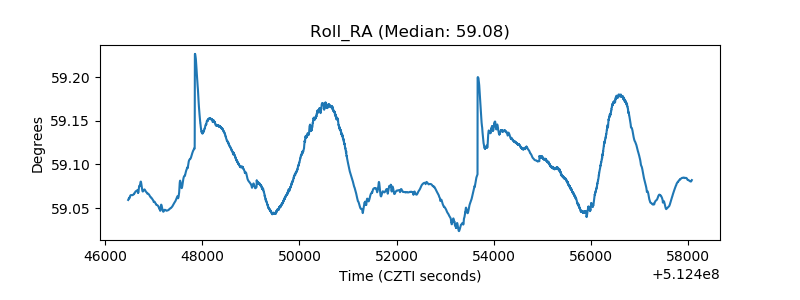 |
| Veto Counter | 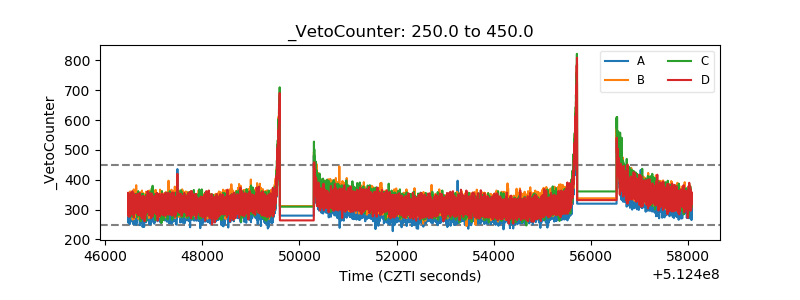 |