| Param | Original file | Final file |
|---|---|---|
| Filename | modeM0/AS1A14_083T03_9000006562_56809cztM0_level2.fits | modeM0/AS1A14_083T03_9000006562_56809cztM0_level2_quad_clean.evt |
| Size (bytes) | 551,736,000 | 89,956,800 |
| Size | 526.2 MB | 85.8 MB |
| Events in quadrant A | 3,470,883 | 629,404 |
| Events in quadrant B | 7,275,733 | 530,411 |
| Events in quadrant C | 5,398,626 | 546,437 |
| Events in quadrant D | 3,768,526 | 560,347 |
| Mode M9 | |||
|---|---|---|---|
| Quadrant | BADHDUFLAG | Total packets | Discarded packets |
| A | 0 | 10 | 0 |
| B | 0 | 10 | 0 |
| C | 0 | 10 | 0 |
| D | 0 | 10 | 0 |
| Mode SS | |||
|---|---|---|---|
| Quadrant | BADHDUFLAG | Total packets | Discarded packets |
| A | 0 | 132 | 0 |
| B | 0 | 132 | 0 |
| C | 0 | 132 | 0 |
| D | 0 | 132 | 0 |
| Mode M0 | |||
|---|---|---|---|
| Quadrant | BADHDUFLAG | Total packets | Discarded packets |
| A | 0 | 14350 | 1 |
| B | 0 | 26196 | 1 |
| C | 0 | 20793 | 1 |
| D | 0 | 15832 | 1 |
| Quadrant | Total seconds | Saturated seconds | Saturation percentage |
|---|---|---|---|
| A | 6560 | 75 | 1.143293% |
| B | 6559 | 1680 | 25.613661% |
| C | 6559 | 770 | 11.739594% |
| D | 6559 | 194 | 2.957768% |
Noise dominated data is calculated using 1-second bins in cleaned event files. If a bin has >2000 counts, and if more than 50% of those come from <1% of pixels, then it is considered to be noise-dominated and hence unusable.
| Quadrant | # 1 sec bins | Bins with >0 counts | Bins with >2000 counts | High rate bins dominated by noise | Noise dominated (total time) | Noise dominated (detector-on time) | Marked lightcurve |
|---|---|---|---|---|---|---|---|
| A | 7504 | 6560 | 22 | 22 | 0.29% | 0.34% | 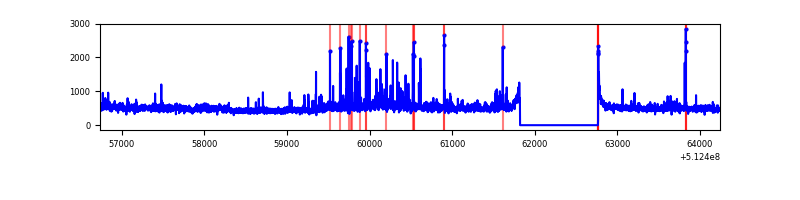 |
| B | 7503 | 6559 | 1304 | 1304 | 17.38% | 19.88% | 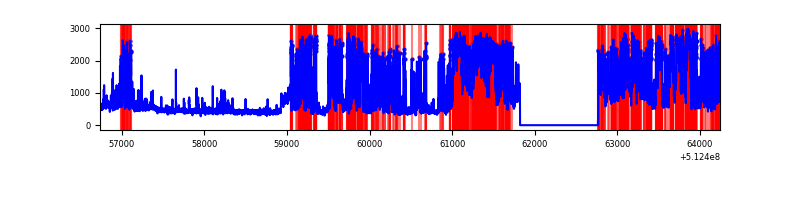 |
| C | 7504 | 6560 | 765 | 765 | 10.19% | 11.66% | 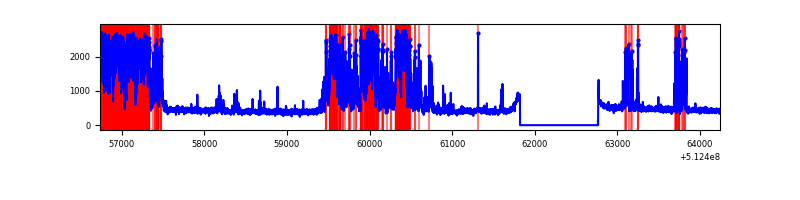 |
| D | 7504 | 6560 | 184 | 184 | 2.45% | 2.80% | 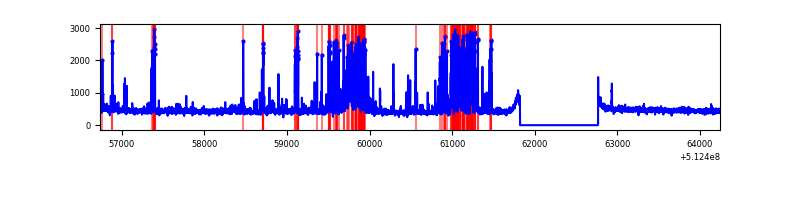 |
Top three noisy pixels from each quadrant. If the there are fewer than three noisy pixels in the level2.evt file, extra rows are filled as -1
| Pixel properties | Quadrant properties | ||||||
|---|---|---|---|---|---|---|---|
| Quadrant | DetID | PixID | Counts | Sigma | Mean | Median | Sigma |
| A | 3 | 14 | 516835 | 2940.21 | 712 | 695 | 175.5 |
| A | 10 | 251 | 129634 | 734.51 | 712 | 695 | 175.5 |
| A | 14 | 235 | 30668 | 170.74 | 712 | 695 | 175.5 |
| B | 4 | 206 | 1469160 | 10832.26 | 626 | 603 | 135.6 |
| B | 2 | 249 | 1228776 | 9059.16 | 626 | 603 | 135.6 |
| B | 8 | 128 | 1211822 | 8934.11 | 626 | 603 | 135.6 |
| C | 15 | 230 | 2496805 | 13577.36 | 672 | 665 | 183.8 |
| C | 14 | 96 | 208077 | 1128.18 | 672 | 665 | 183.8 |
| C | 12 | 252 | 22613 | 119.38 | 672 | 665 | 183.8 |
| D | 2 | 249 | 671380 | 3426.66 | 689 | 657 | 195.7 |
| D | 8 | 240 | 110429 | 560.81 | 689 | 657 | 195.7 |
| D | 6 | 239 | 94789 | 480.91 | 689 | 657 | 195.7 |
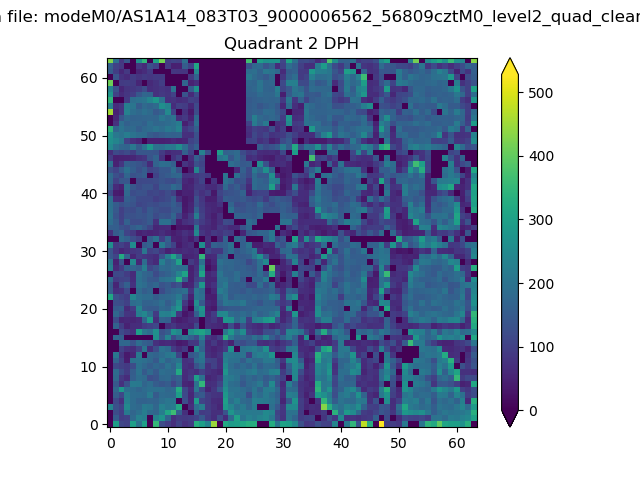
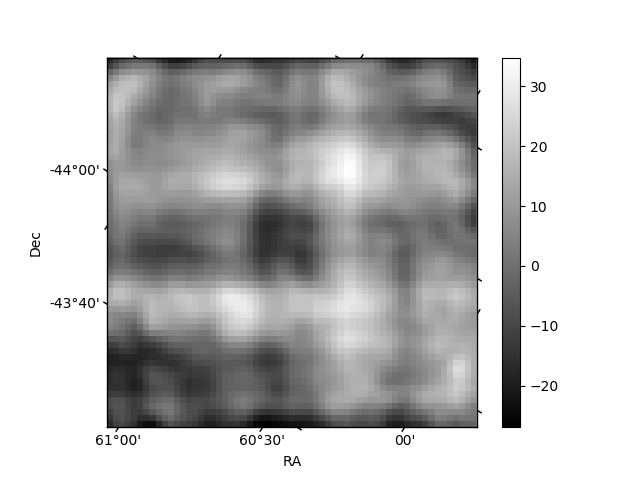
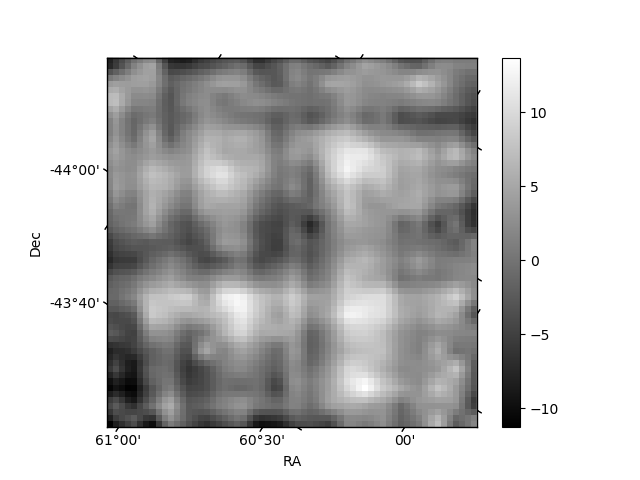
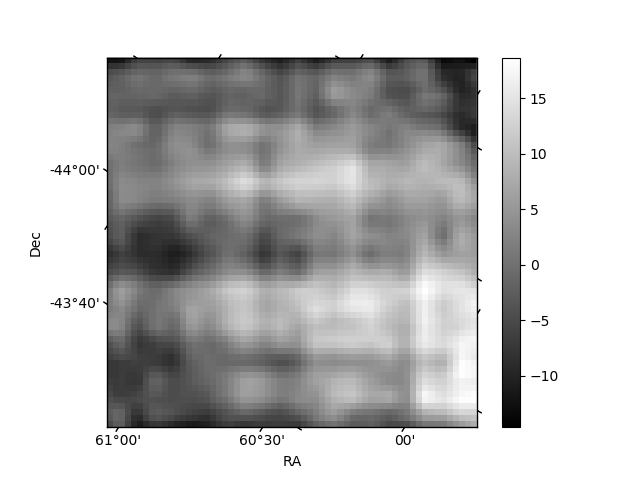
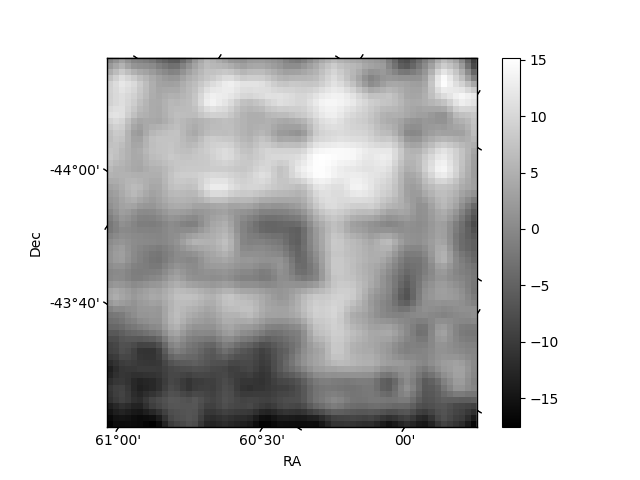
Histogram calculated using DETX and DETY for each event in the final _common_clean file
| Quadrant A | 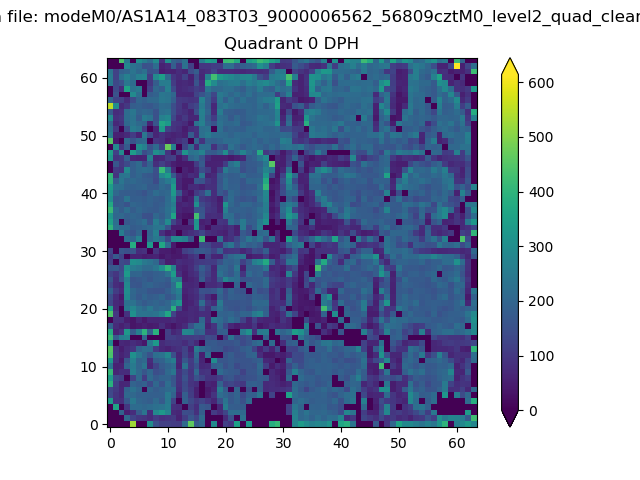 |
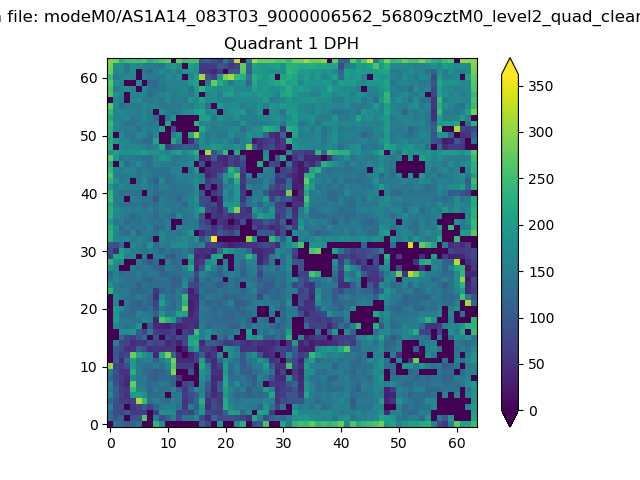 |
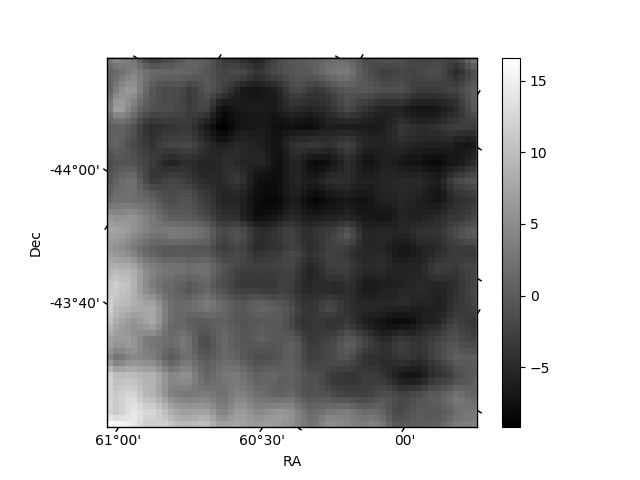
Quadrant B |
|---|---|---|---|
| Quadrant D | 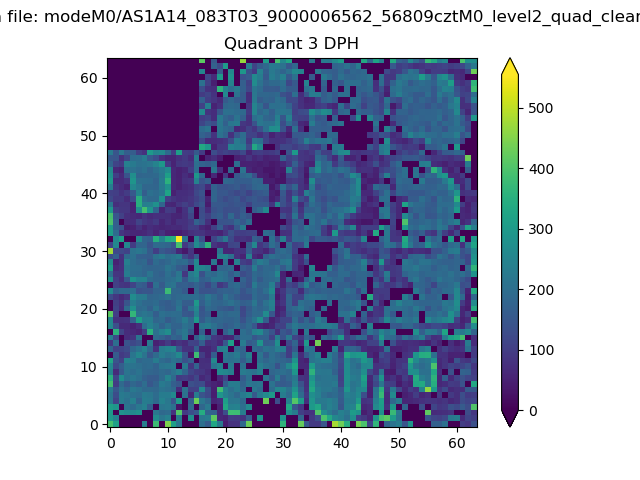 |
 |
Quadrant C |
| Plot type | Count rate plots | Images |
|---|---|---|
| Comparison with Poisson distribution Blue bars denote a histogram of data divided into 1 sec bins. Red curve is a Poisson curve with rate = median count rate of data. |
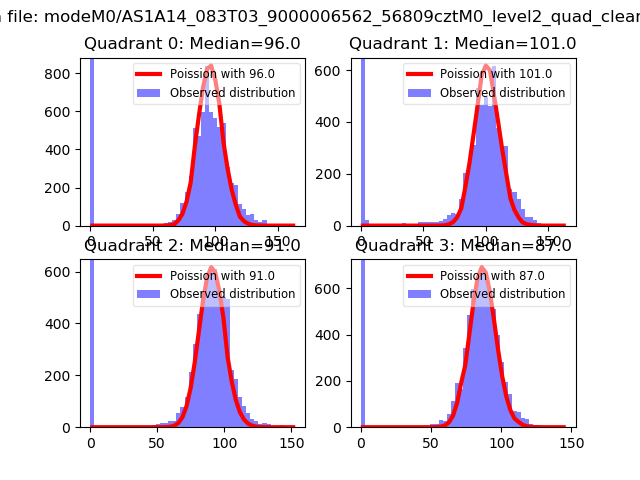 |
 |
| Quadrant-wise count rates Data is divided into 100 sec bins |
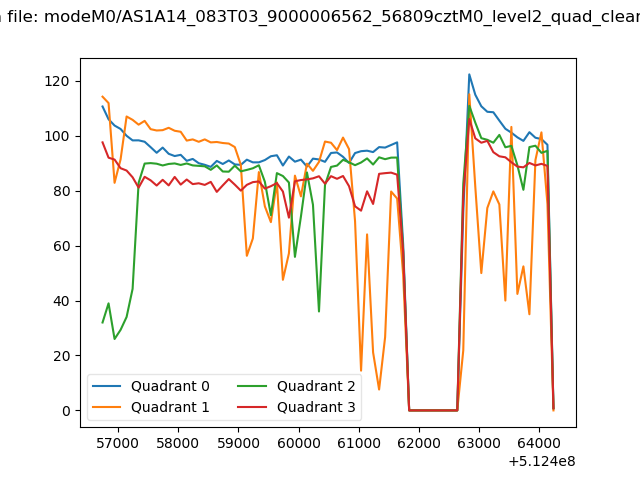 |
|
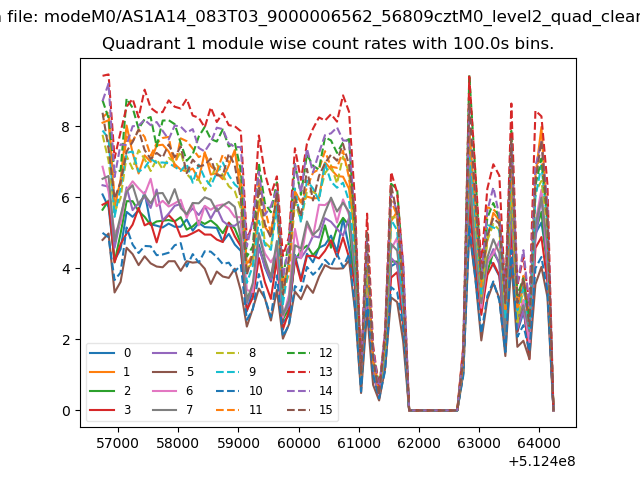
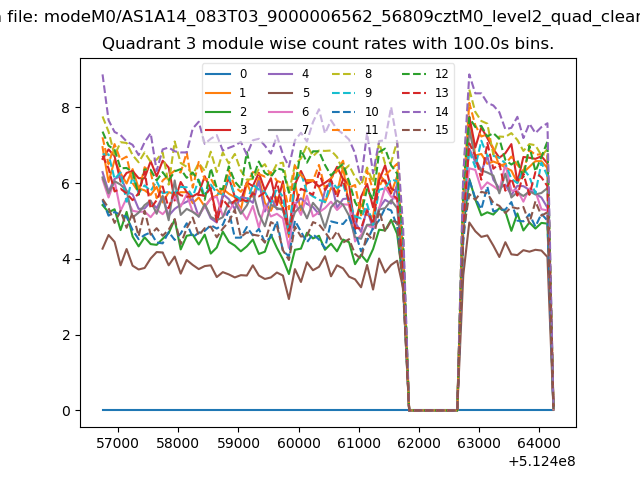
| Module-wise count rates for Quadrant A Data is divided into 100 sec bins |
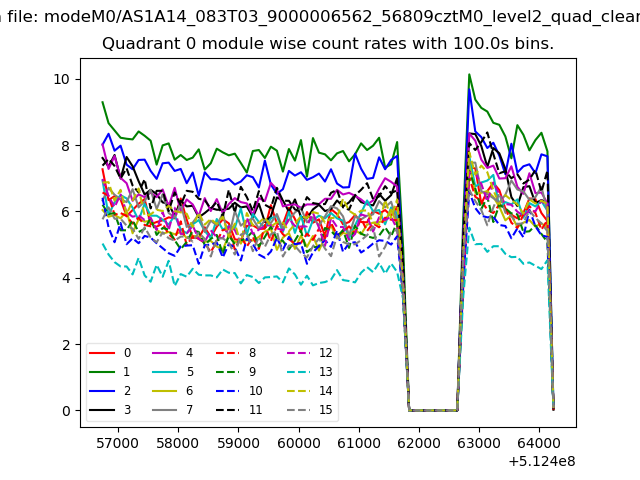 |
 |
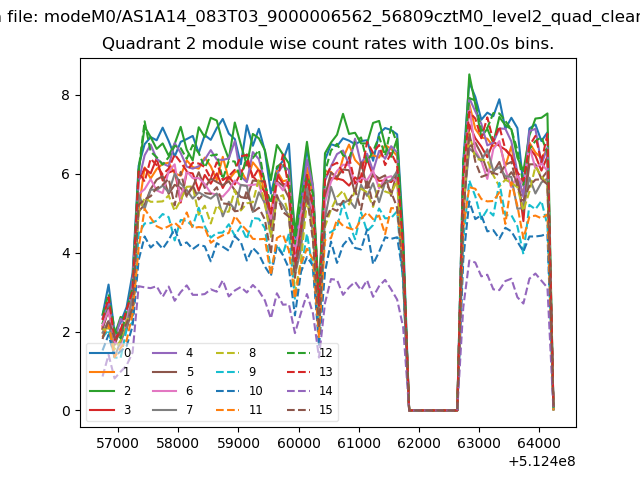
| Module-wise count rates for Quadrant B Data is divided into 100 sec bins |
 |
 |
| Module-wise count rates for Quadrant C Data is divided into 100 sec bins |
 |
 |
| Module-wise count rates for Quadrant D Data is divided into 100 sec bins |
 |
 |
| Parameter | Plot |
|---|---|
| CZT HV Monitor | 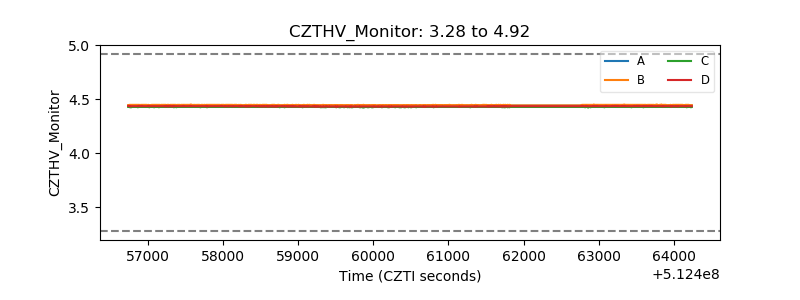 |
| D_VDD | 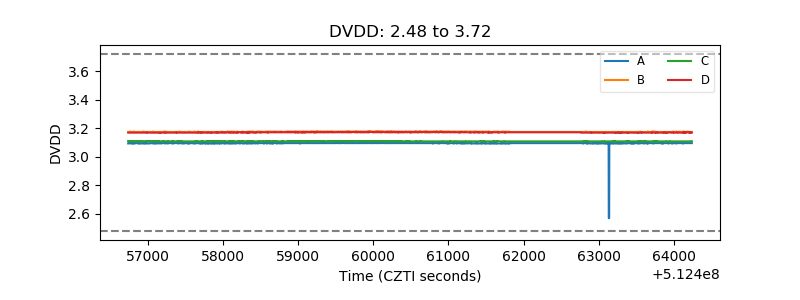 |
| Temperature 1 | 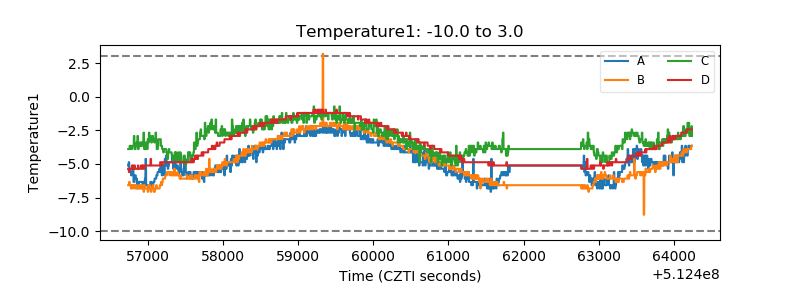 |
| Veto HV Monitor | 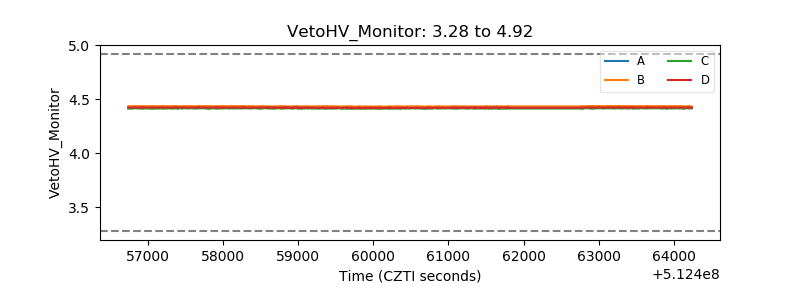 |
| Veto LLD | 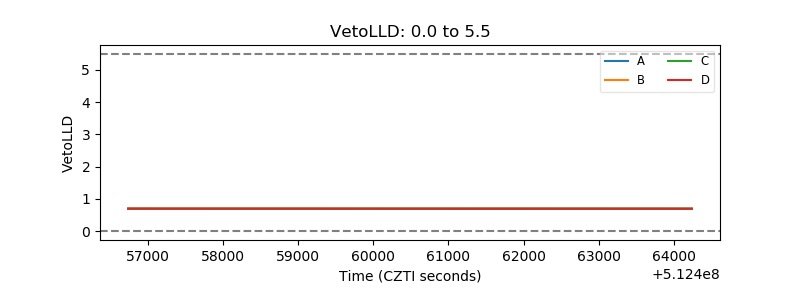 |
| Alpha Counter | 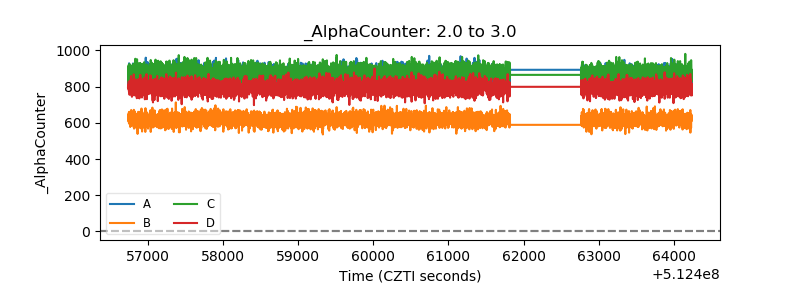 |
| _CPM_Rate | 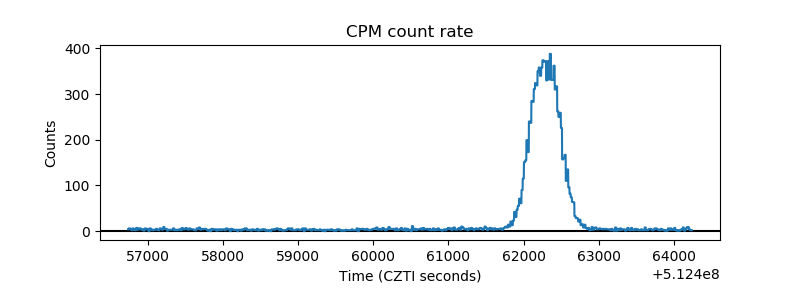 |
| CZT Counter | 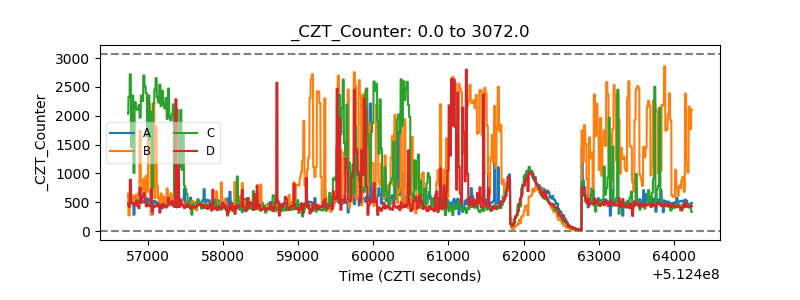 |
| +2.5 Volts monitor |  |
| +5 Volts monitor |  |
| _ROLL_ROT | 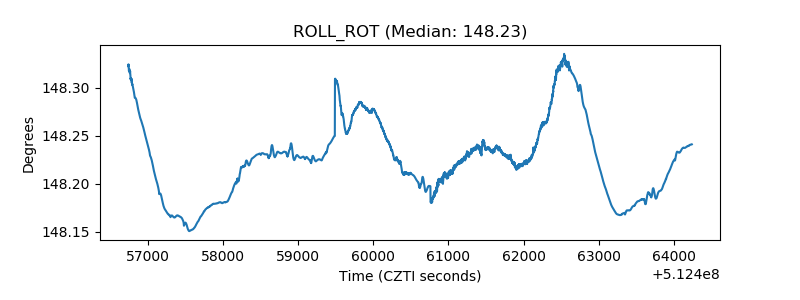 |
| _Roll_DEC | 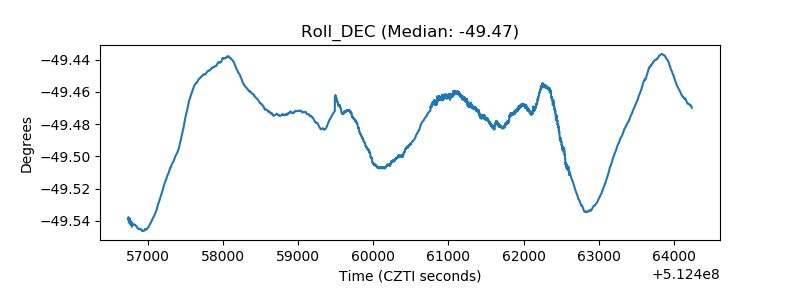 |
| _Roll_RA | 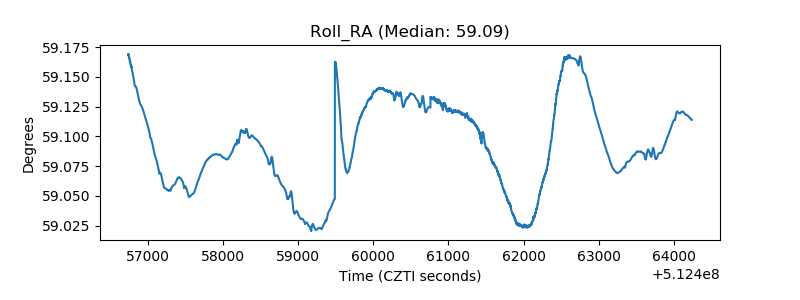 |
| Veto Counter | 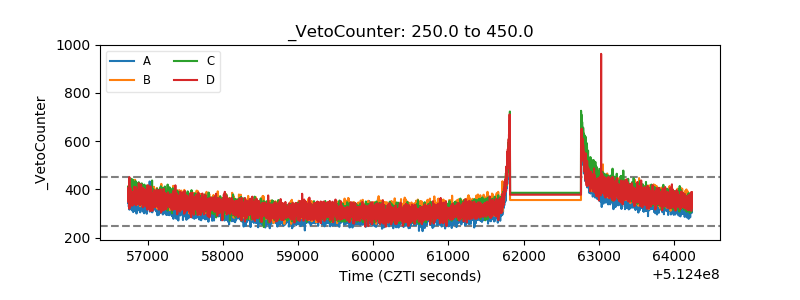 |