| Param | Original file | Final file |
|---|---|---|
| Filename | modeM0/AS1A14_083T03_9000006562_56810cztM0_level2.fits | modeM0/AS1A14_083T03_9000006562_56810cztM0_level2_quad_clean.evt |
| Size (bytes) | 467,294,400 | 81,774,720 |
| Size | 445.6 MB | 78.0 MB |
| Events in quadrant A | 3,046,906 | 570,644 |
| Events in quadrant B | 8,129,857 | 430,013 |
| Events in quadrant C | 2,600,802 | 549,704 |
| Events in quadrant D | 3,064,737 | 516,493 |
| Mode M9 | |||
|---|---|---|---|
| Quadrant | BADHDUFLAG | Total packets | Discarded packets |
| A | 0 | 10 | 0 |
| B | 0 | 10 | 0 |
| C | 0 | 10 | 0 |
| D | 0 | 10 | 0 |
| Mode SS | |||
|---|---|---|---|
| Quadrant | BADHDUFLAG | Total packets | Discarded packets |
| A | 0 | 120 | 0 |
| B | 0 | 120 | 0 |
| C | 0 | 120 | 0 |
| D | 0 | 120 | 0 |
| Mode M0 | |||
|---|---|---|---|
| Quadrant | BADHDUFLAG | Total packets | Discarded packets |
| A | 0 | 12619 | 1 |
| B | 0 | 28220 | 1 |
| C | 0 | 12213 | 1 |
| D | 0 | 13131 | 1 |
| Quadrant | Total seconds | Saturated seconds | Saturation percentage |
|---|---|---|---|
| A | 5852 | 79 | 1.349966% |
| B | 5852 | 2059 | 35.184552% |
| C | 5853 | 78 | 1.332650% |
| D | 5853 | 83 | 1.418076% |
Noise dominated data is calculated using 1-second bins in cleaned event files. If a bin has >2000 counts, and if more than 50% of those come from <1% of pixels, then it is considered to be noise-dominated and hence unusable.
| Quadrant | # 1 sec bins | Bins with >0 counts | Bins with >2000 counts | High rate bins dominated by noise | Noise dominated (total time) | Noise dominated (detector-on time) | Marked lightcurve |
|---|---|---|---|---|---|---|---|
| A | 6912 | 5853 | 11 | 11 | 0.16% | 0.19% | 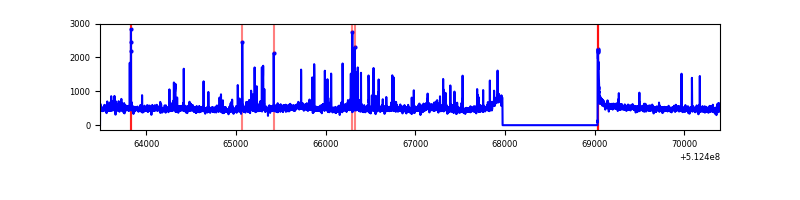 |
| B | 6912 | 5853 | 1637 | 1637 | 23.68% | 27.97% | 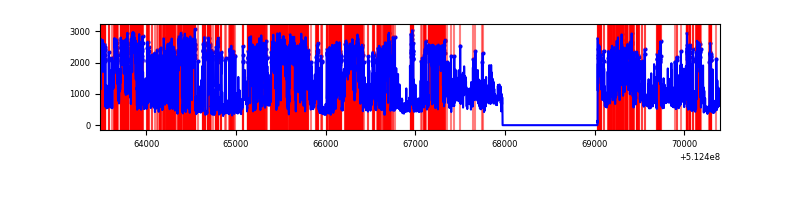 |
| C | 6913 | 5854 | 24 | 24 | 0.35% | 0.41% | 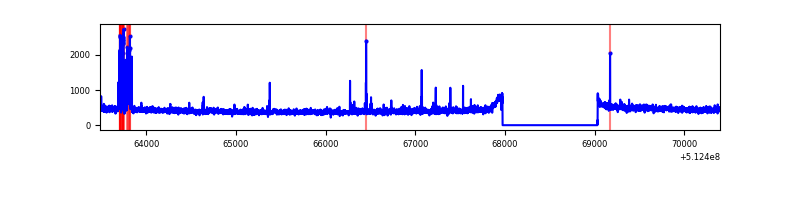 |
| D | 6913 | 5854 | 32 | 32 | 0.46% | 0.55% | 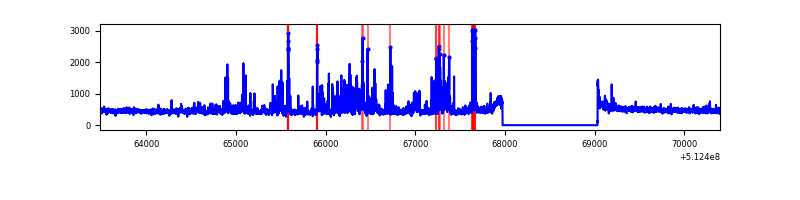 |
Top three noisy pixels from each quadrant. If the there are fewer than three noisy pixels in the level2.evt file, extra rows are filled as -1
| Pixel properties | Quadrant properties | ||||||
|---|---|---|---|---|---|---|---|
| Quadrant | DetID | PixID | Counts | Sigma | Mean | Median | Sigma |
| A | 3 | 14 | 431838 | 2708.32 | 641 | 624 | 159.2 |
| A | 10 | 251 | 88802 | 553.82 | 641 | 624 | 159.2 |
| A | 12 | 3 | 18776 | 114.01 | 641 | 624 | 159.2 |
| B | 4 | 206 | 2324799 | 20144.97 | 530 | 510 | 115.4 |
| B | 5 | 185 | 2185153 | 18934.63 | 530 | 510 | 115.4 |
| B | 8 | 128 | 675412 | 5849.48 | 530 | 510 | 115.4 |
| C | 14 | 96 | 119963 | 702.19 | 621 | 613 | 170.0 |
| C | 14 | 254 | 18837 | 107.22 | 621 | 613 | 170.0 |
| C | 12 | 252 | 15566 | 87.98 | 621 | 613 | 170.0 |
| D | 2 | 31 | 156286 | 882.47 | 623 | 595 | 176.4 |
| D | 2 | 249 | 128264 | 723.64 | 623 | 595 | 176.4 |
| D | 6 | 239 | 77349 | 435.05 | 623 | 595 | 176.4 |
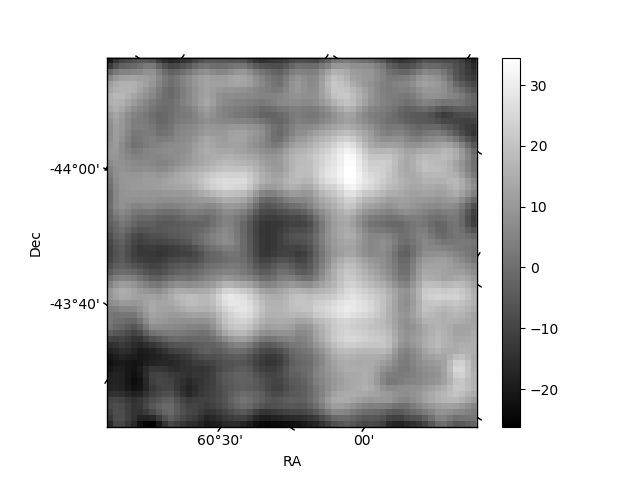
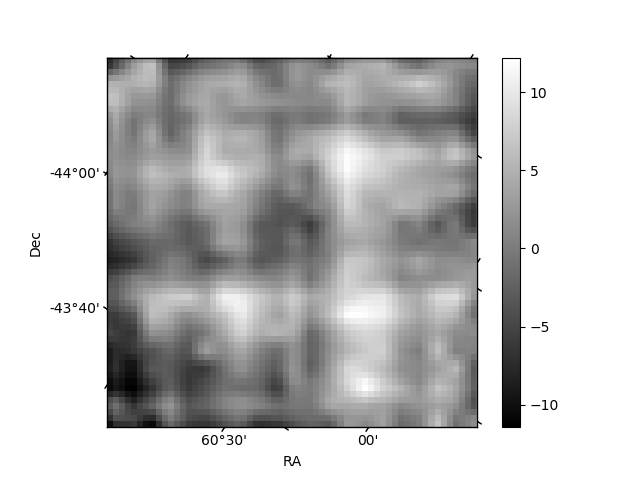
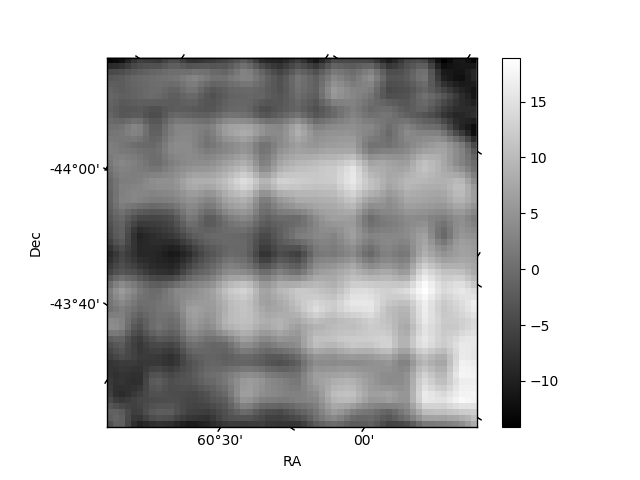
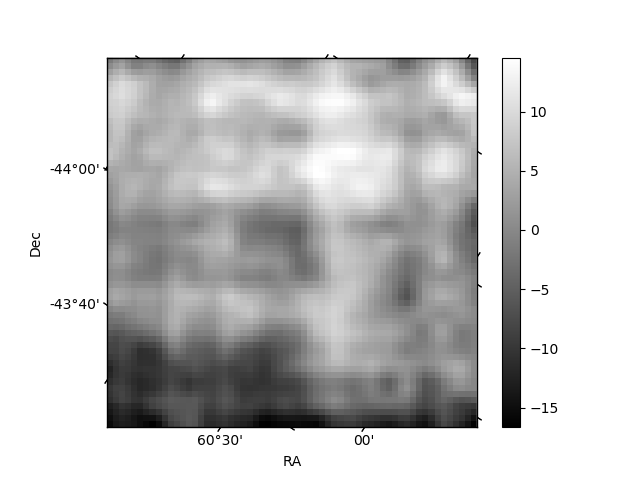
Histogram calculated using DETX and DETY for each event in the final _common_clean file
| Quadrant A | 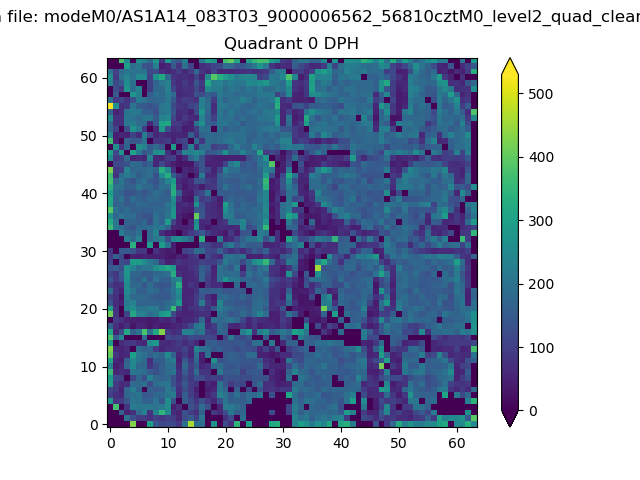 |
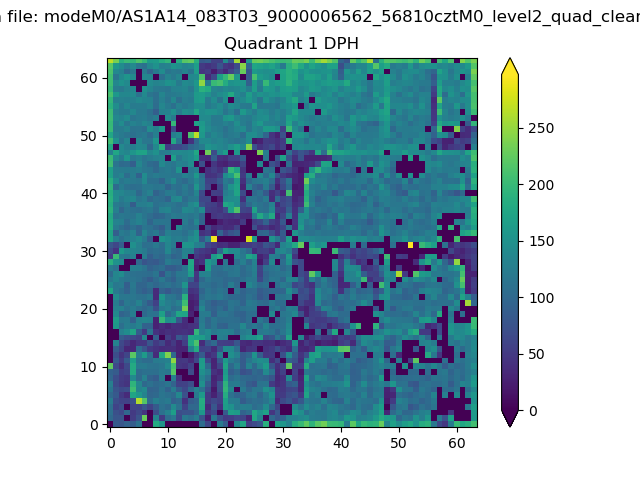 |
Quadrant B |
|---|---|---|---|
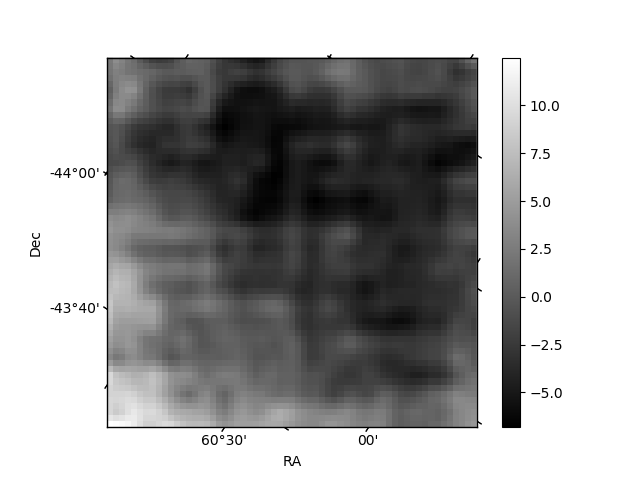
| Quadrant D | 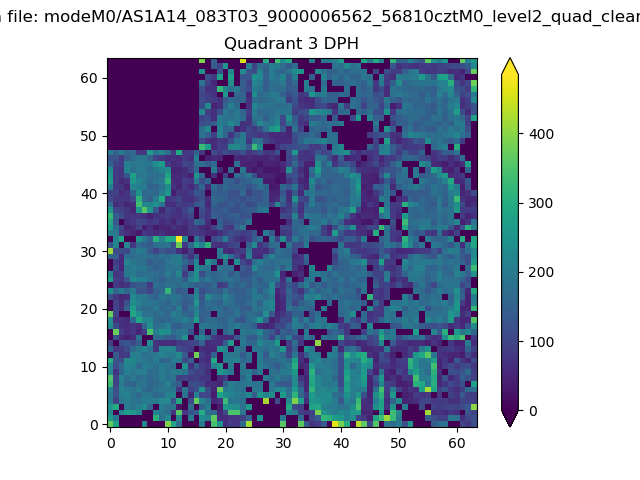 |
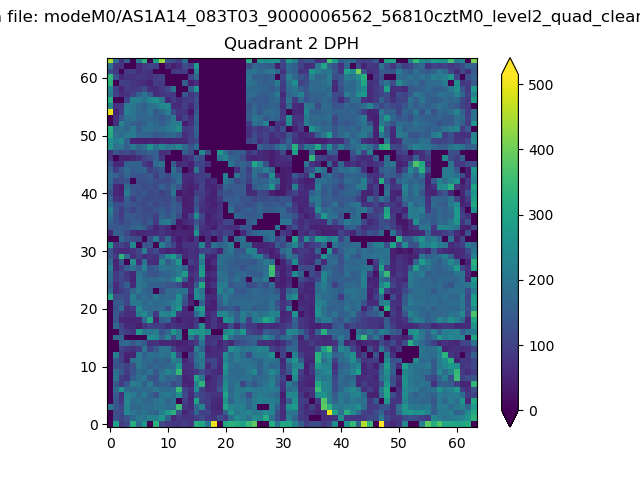 |
Quadrant C |
| Plot type | Count rate plots | Images |
|---|---|---|
| Comparison with Poisson distribution Blue bars denote a histogram of data divided into 1 sec bins. Red curve is a Poisson curve with rate = median count rate of data. |
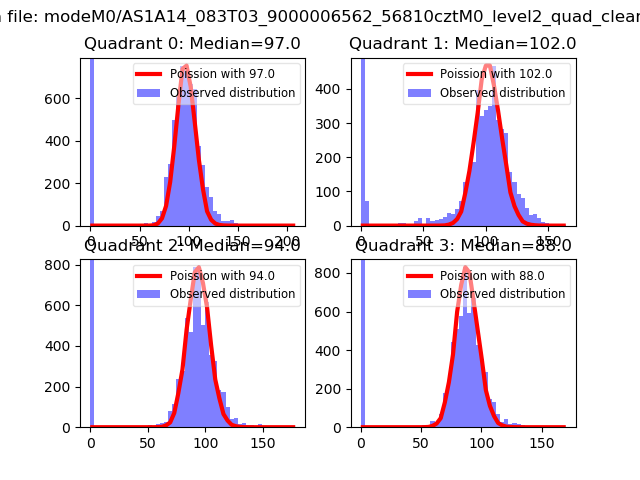 |
 |
| Quadrant-wise count rates Data is divided into 100 sec bins |
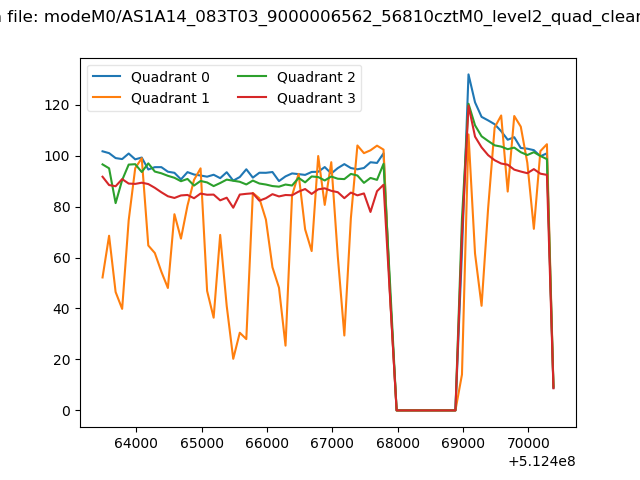 |
|
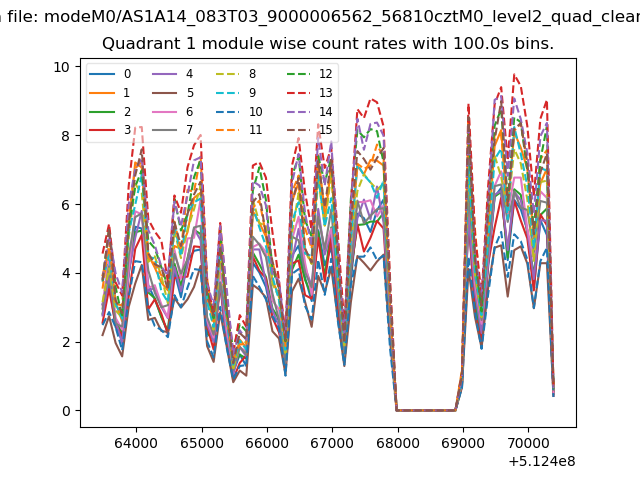
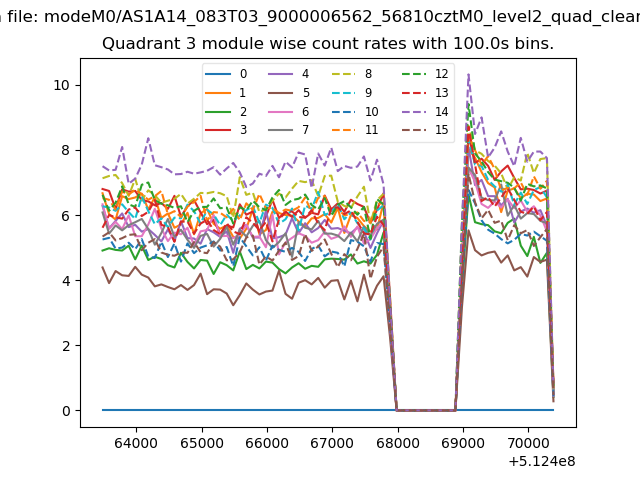
| Module-wise count rates for Quadrant A Data is divided into 100 sec bins |
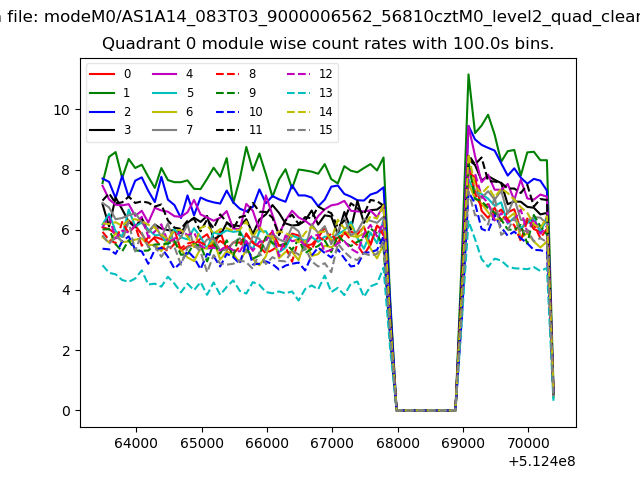 |
 |
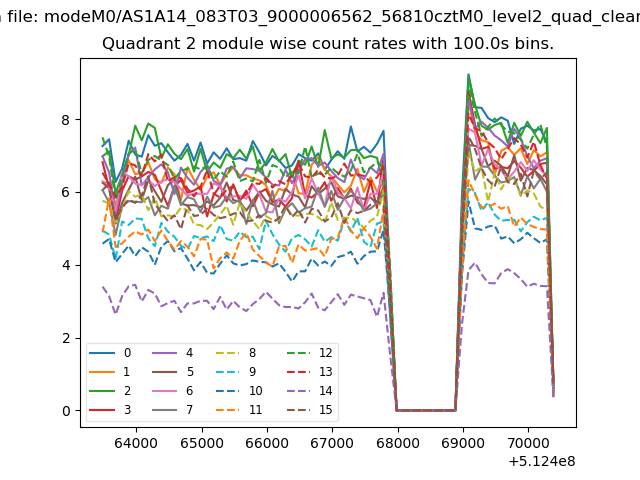
| Module-wise count rates for Quadrant B Data is divided into 100 sec bins |
 |
 |
| Module-wise count rates for Quadrant C Data is divided into 100 sec bins |
 |
 |
| Module-wise count rates for Quadrant D Data is divided into 100 sec bins |
 |
 |
| Parameter | Plot |
|---|---|
| CZT HV Monitor | 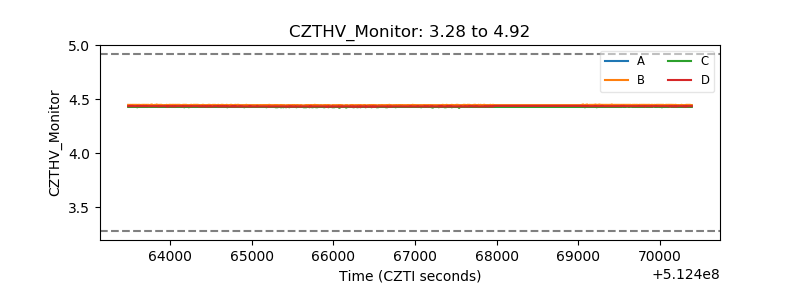 |
| D_VDD | 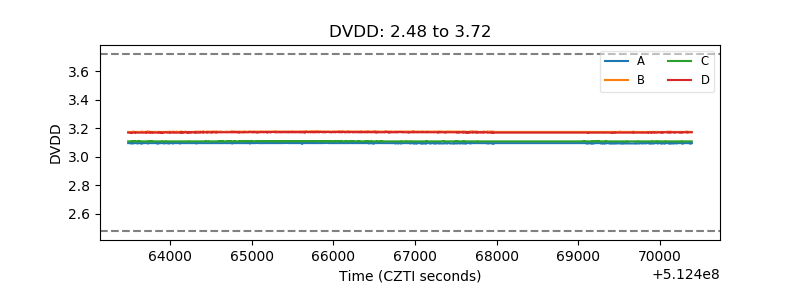 |
| Temperature 1 | 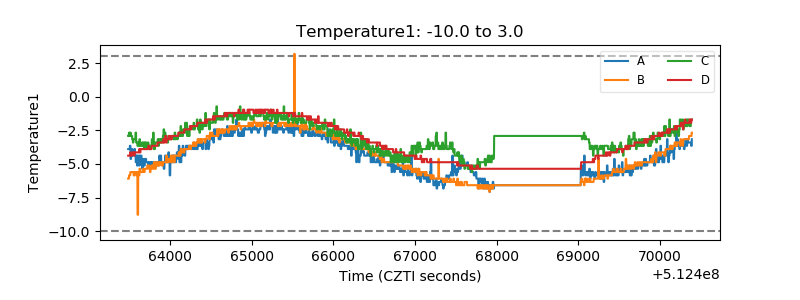 |
| Veto HV Monitor | 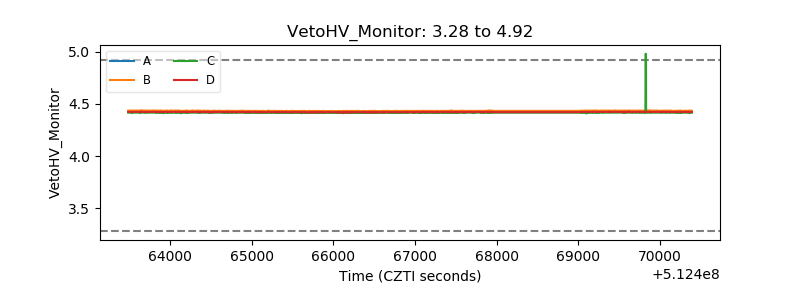 |
| Veto LLD | 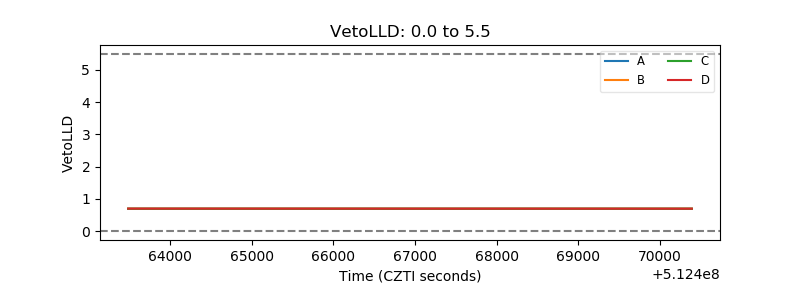 |
| Alpha Counter | 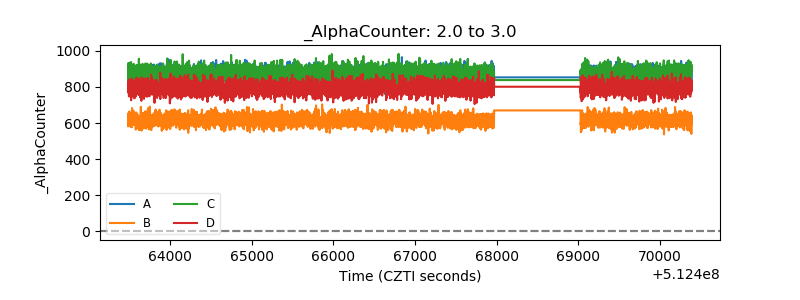 |
| _CPM_Rate | 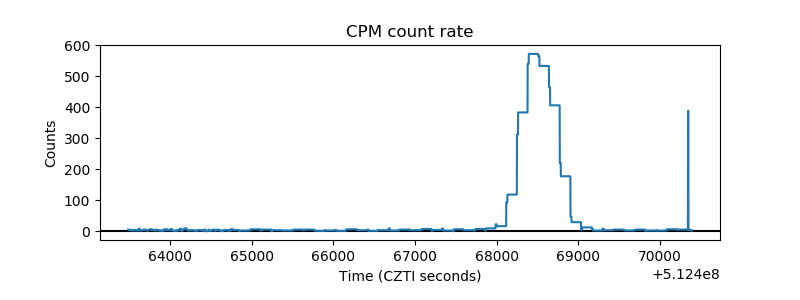 |
| CZT Counter | 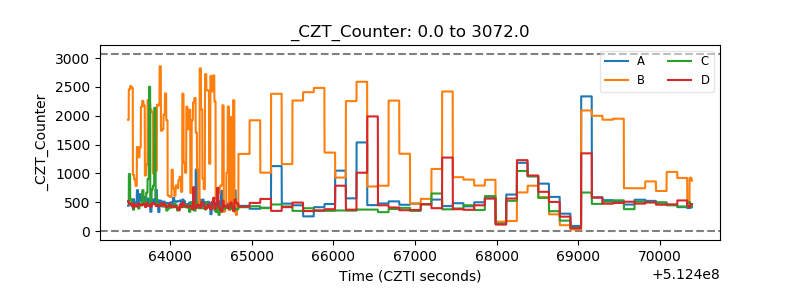 |
| +2.5 Volts monitor |  |
| +5 Volts monitor | 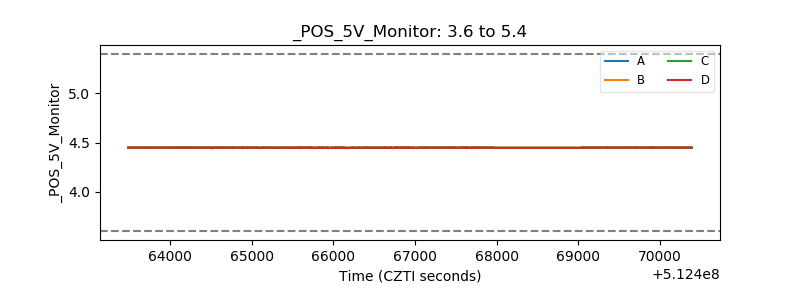 |
| _ROLL_ROT | 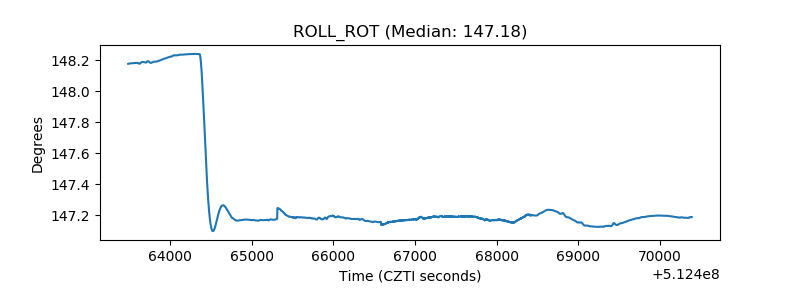 |
| _Roll_DEC | 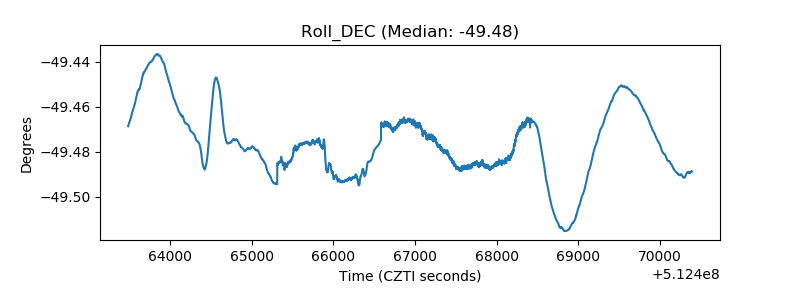 |
| _Roll_RA | 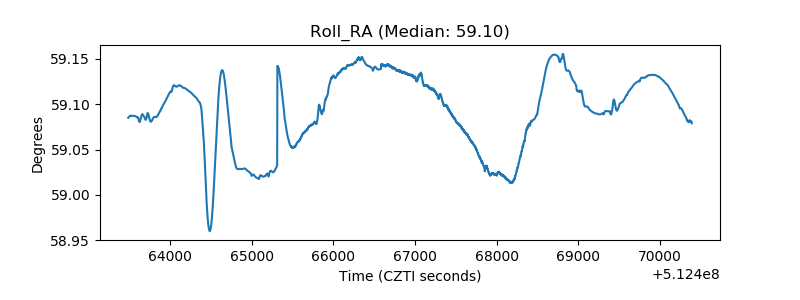 |
| Veto Counter | 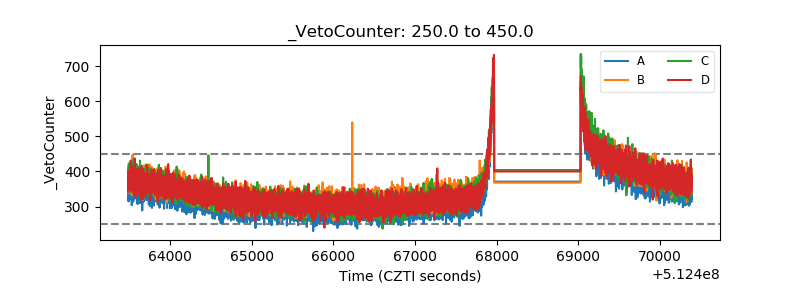 |