| Param | Original file | Final file |
|---|---|---|
| Filename | modeM0/AS1A14_083T03_9000006562_56811cztM0_level2.fits | modeM0/AS1A14_083T03_9000006562_56811cztM0_level2_quad_clean.evt |
| Size (bytes) | 544,991,040 | 87,223,680 |
| Size | 519.7 MB | 83.2 MB |
| Events in quadrant A | 3,245,704 | 628,813 |
| Events in quadrant B | 10,121,142 | 407,076 |
| Events in quadrant C | 2,868,418 | 598,357 |
| Events in quadrant D | 3,445,664 | 564,911 |
| Mode M9 | |||
|---|---|---|---|
| Quadrant | BADHDUFLAG | Total packets | Discarded packets |
| A | 0 | 11 | 0 |
| B | 0 | 11 | 0 |
| C | 0 | 11 | 0 |
| D | 0 | 11 | 0 |
| Mode SS | |||
|---|---|---|---|
| Quadrant | BADHDUFLAG | Total packets | Discarded packets |
| A | 0 | 128 | 0 |
| B | 0 | 128 | 0 |
| C | 0 | 128 | 0 |
| D | 0 | 128 | 0 |
| Mode M0 | |||
|---|---|---|---|
| Quadrant | BADHDUFLAG | Total packets | Discarded packets |
| A | 0 | 14235 | 1 |
| B | 0 | 34452 | 1 |
| C | 0 | 13364 | 1 |
| D | 0 | 14540 | 1 |
| Quadrant | Total seconds | Saturated seconds | Saturation percentage |
|---|---|---|---|
| A | 6333 | 111 | 1.752724% |
| B | 6333 | 2940 | 46.423496% |
| C | 6334 | 110 | 1.736659% |
| D | 6334 | 124 | 1.957689% |
Noise dominated data is calculated using 1-second bins in cleaned event files. If a bin has >2000 counts, and if more than 50% of those come from <1% of pixels, then it is considered to be noise-dominated and hence unusable.
| Quadrant | # 1 sec bins | Bins with >0 counts | Bins with >2000 counts | High rate bins dominated by noise | Noise dominated (total time) | Noise dominated (detector-on time) | Marked lightcurve |
|---|---|---|---|---|---|---|---|
| A | 7423 | 6334 | 34 | 34 | 0.46% | 0.54% | 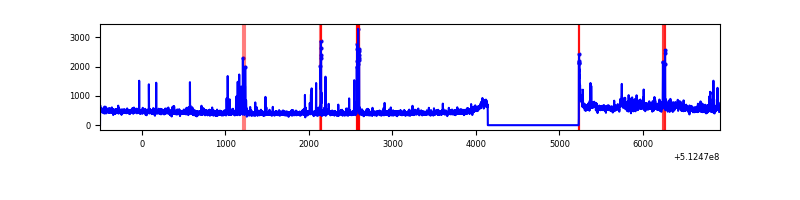 |
| B | 7423 | 6334 | 2340 | 2340 | 31.52% | 36.94% | 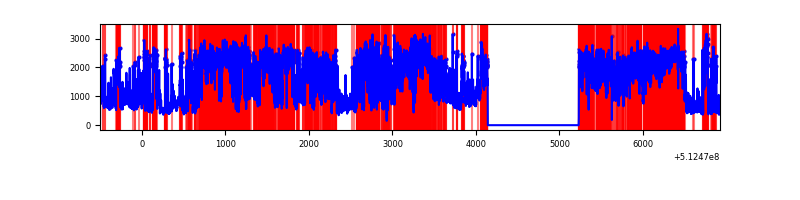 |
| C | 7424 | 6335 | 50 | 50 | 0.67% | 0.79% | 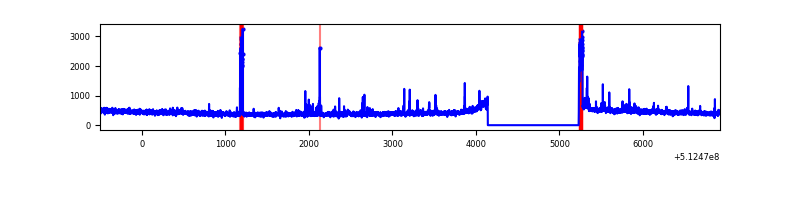 |
| D | 7424 | 6335 | 74 | 74 | 1.00% | 1.17% | 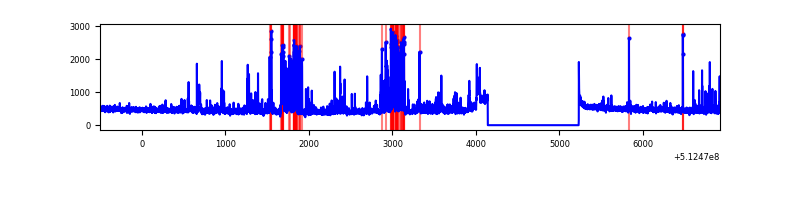 |
Top three noisy pixels from each quadrant. If the there are fewer than three noisy pixels in the level2.evt file, extra rows are filled as -1
| Pixel properties | Quadrant properties | ||||||
|---|---|---|---|---|---|---|---|
| Quadrant | DetID | PixID | Counts | Sigma | Mean | Median | Sigma |
| A | 3 | 14 | 325869 | 1871.42 | 702 | 684 | 173.8 |
| A | 10 | 251 | 176286 | 1010.58 | 702 | 684 | 173.8 |
| A | 13 | 254 | 12497 | 67.98 | 702 | 684 | 173.8 |
| B | 5 | 185 | 3377462 | 28149.19 | 555 | 534 | 120.0 |
| B | 4 | 206 | 3126427 | 26056.63 | 555 | 534 | 120.0 |
| B | 2 | 249 | 1106926 | 9222.59 | 555 | 534 | 120.0 |
| C | 15 | 208 | 107212 | 574.16 | 671 | 662 | 185.6 |
| C | 7 | 2 | 54822 | 291.85 | 671 | 662 | 185.6 |
| C | 14 | 254 | 41608 | 220.64 | 671 | 662 | 185.6 |
| D | 2 | 249 | 202907 | 1046.12 | 683 | 652 | 193.3 |
| D | 10 | 199 | 163146 | 840.47 | 683 | 652 | 193.3 |
| D | 2 | 31 | 75478 | 387.02 | 683 | 652 | 193.3 |
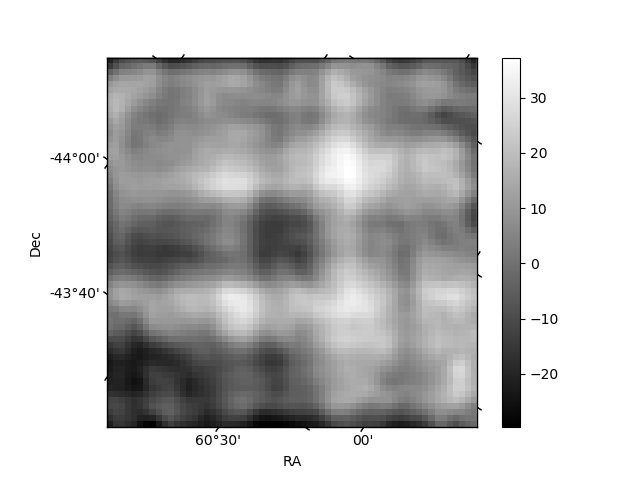
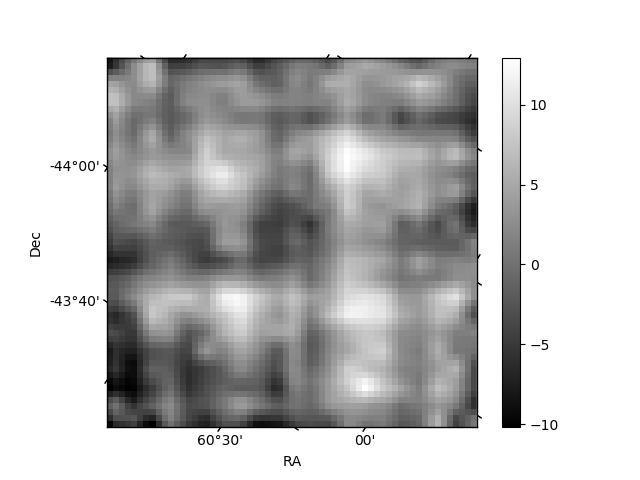
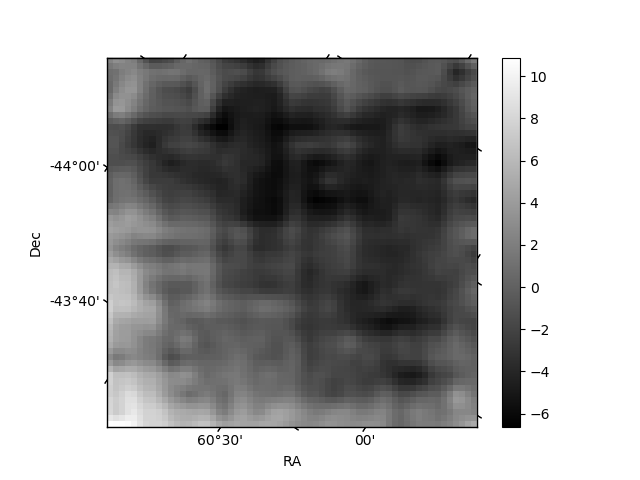
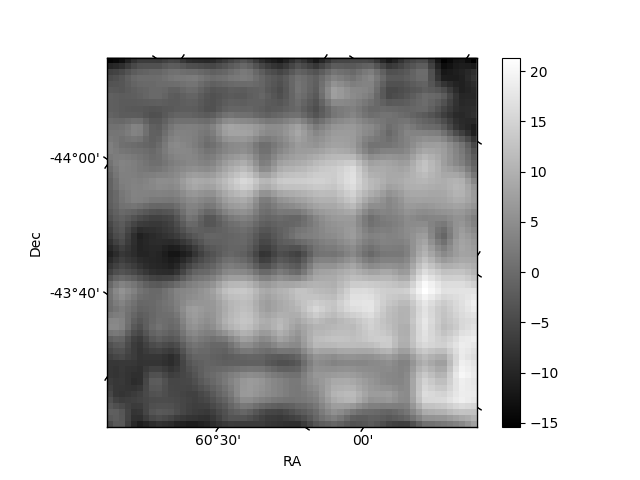
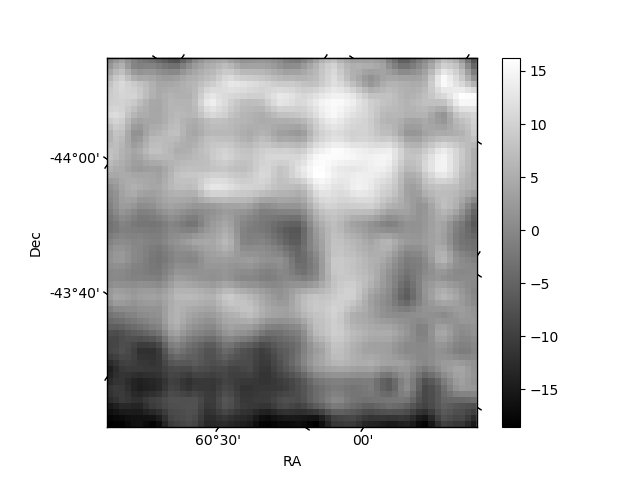
Histogram calculated using DETX and DETY for each event in the final _common_clean file
| Quadrant A | 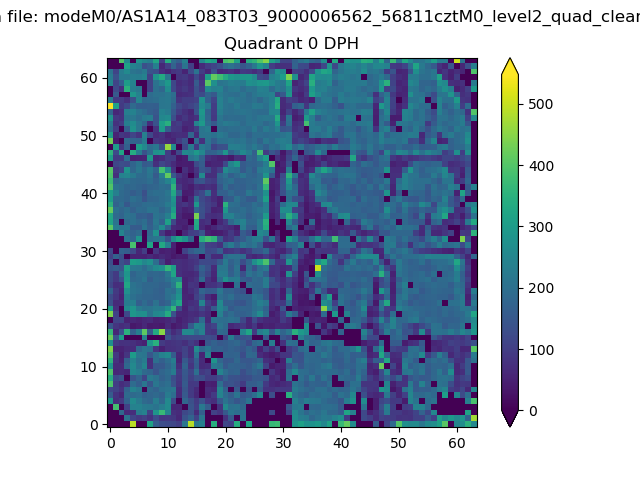 |
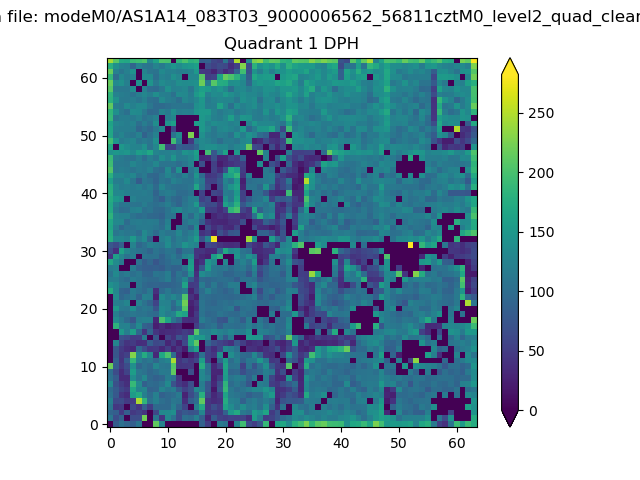 |
Quadrant B |
|---|---|---|---|
| Quadrant D | 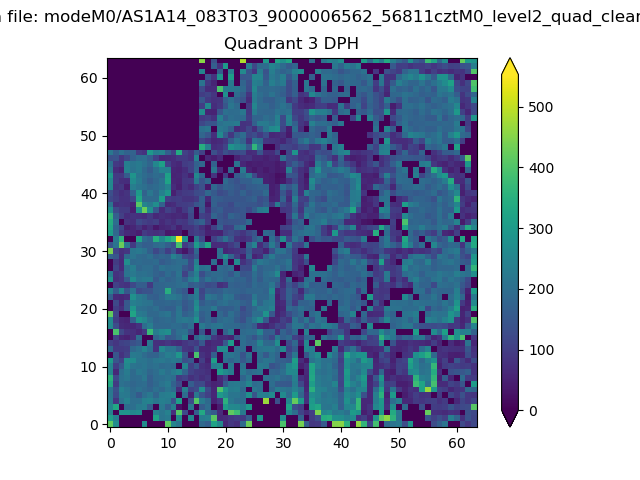 |
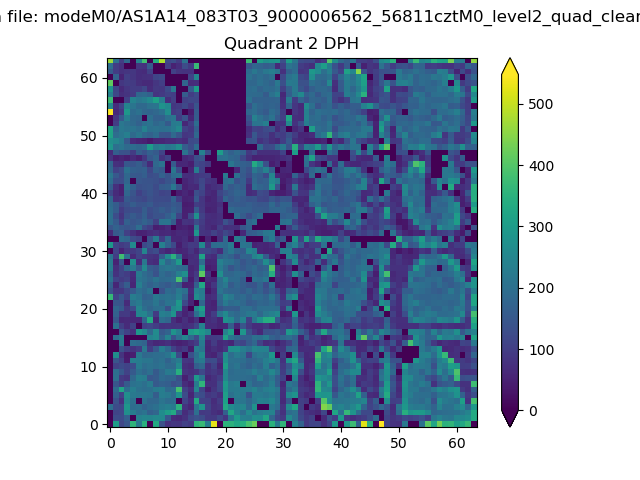 |
Quadrant C |
| Plot type | Count rate plots | Images |
|---|---|---|
| Comparison with Poisson distribution Blue bars denote a histogram of data divided into 1 sec bins. Red curve is a Poisson curve with rate = median count rate of data. |
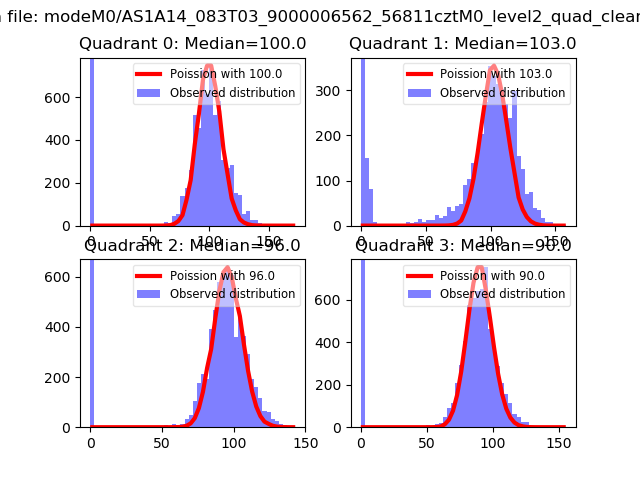 |
 |
| Quadrant-wise count rates Data is divided into 100 sec bins |
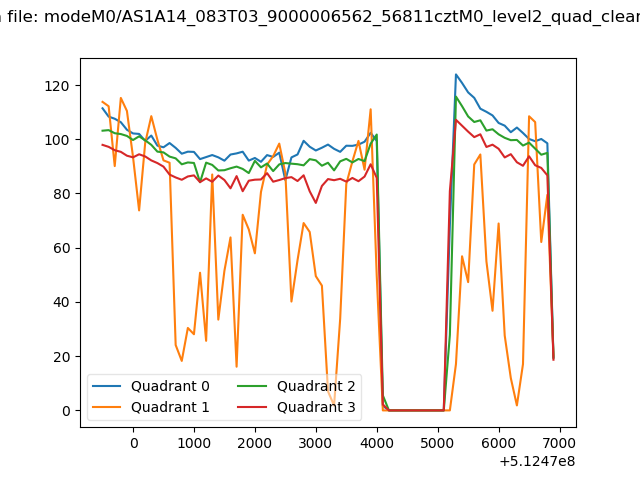 |
|
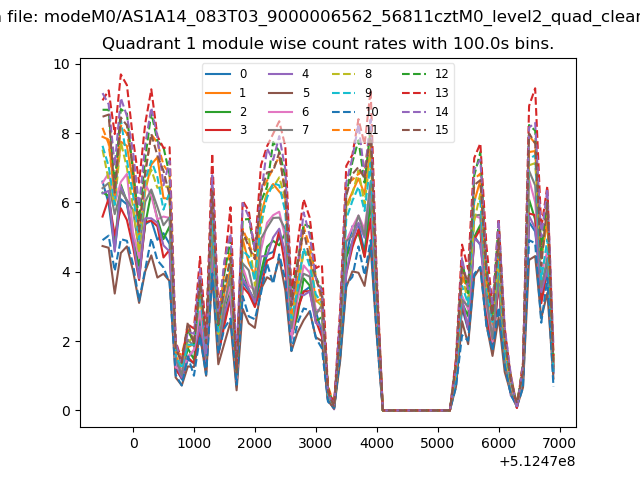
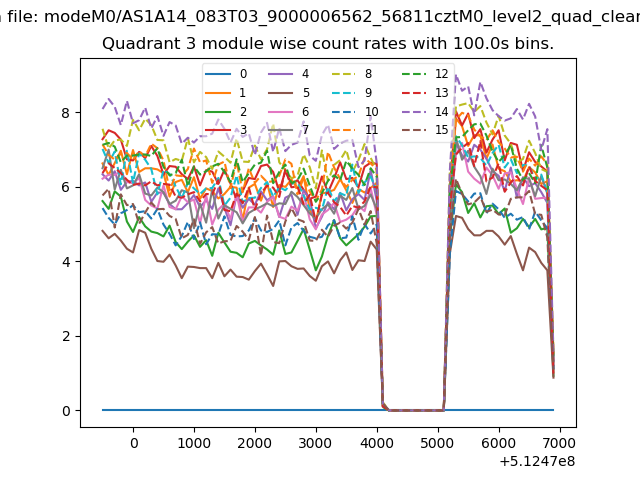
| Module-wise count rates for Quadrant A Data is divided into 100 sec bins |
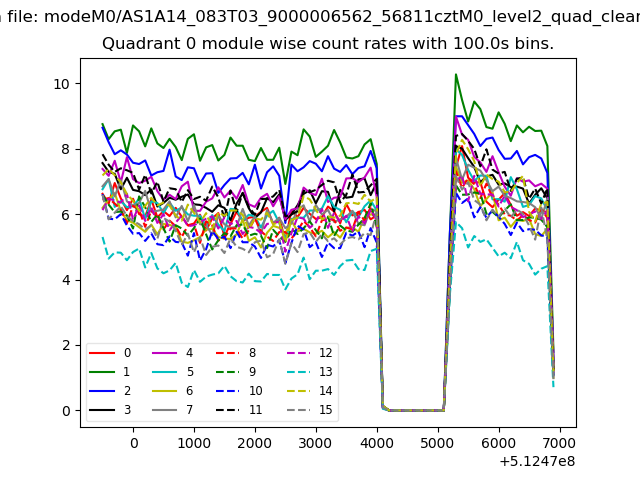 |
 |
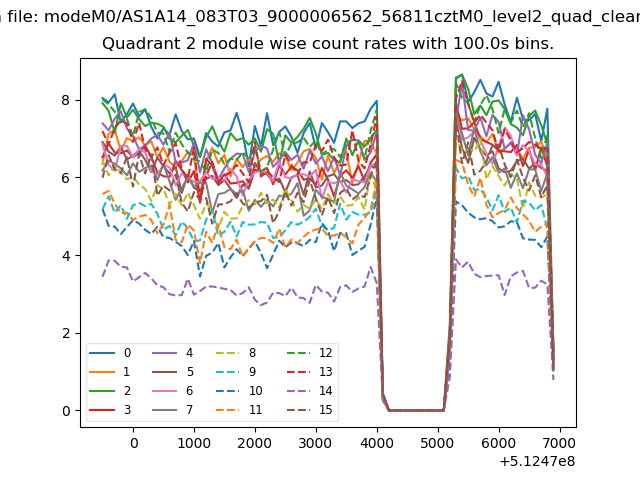
| Module-wise count rates for Quadrant B Data is divided into 100 sec bins |
 |
 |
| Module-wise count rates for Quadrant C Data is divided into 100 sec bins |
 |
 |
| Module-wise count rates for Quadrant D Data is divided into 100 sec bins |
 |
 |
| Parameter | Plot |
|---|---|
| CZT HV Monitor |  |
| D_VDD | 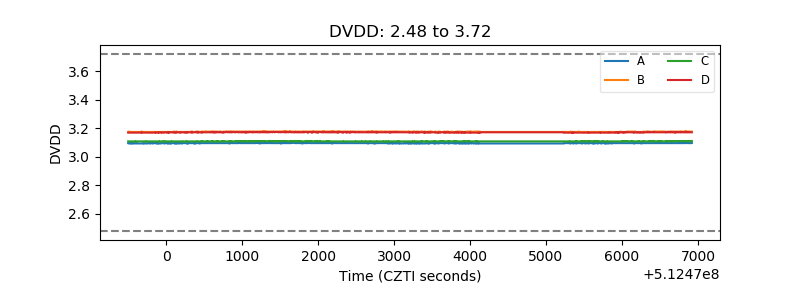 |
| Temperature 1 | 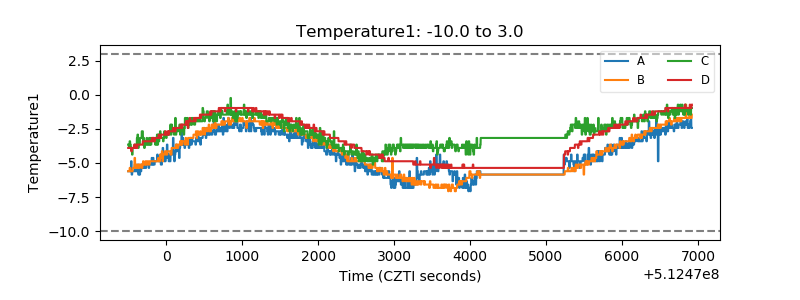 |
| Veto HV Monitor | 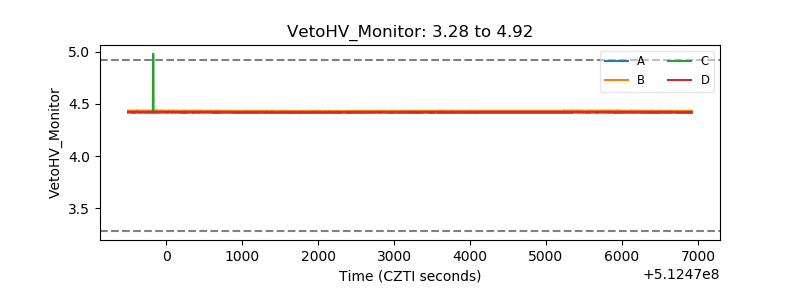 |
| Veto LLD | 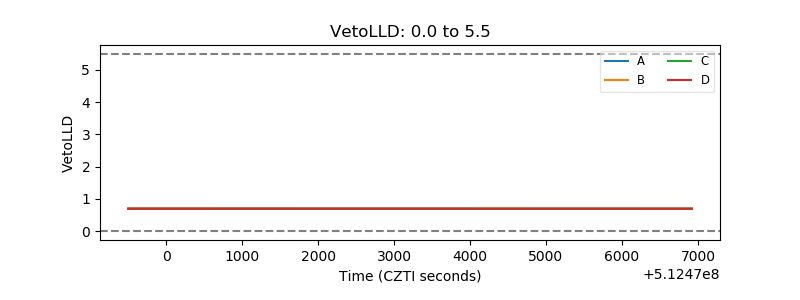 |
| Alpha Counter | 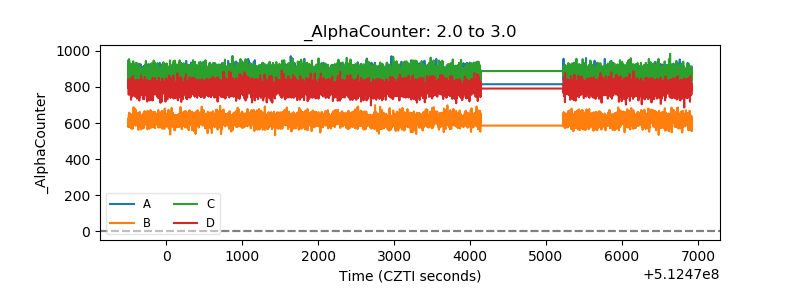 |
| _CPM_Rate | 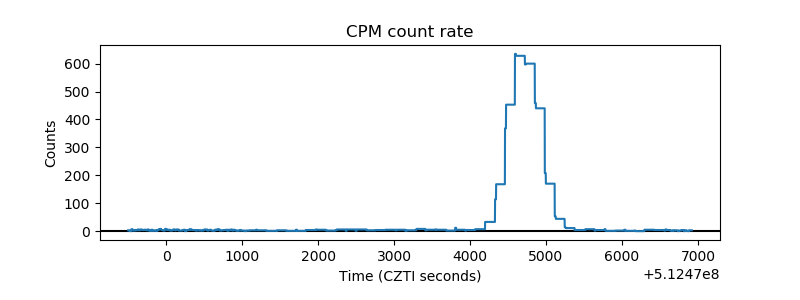 |
| CZT Counter | 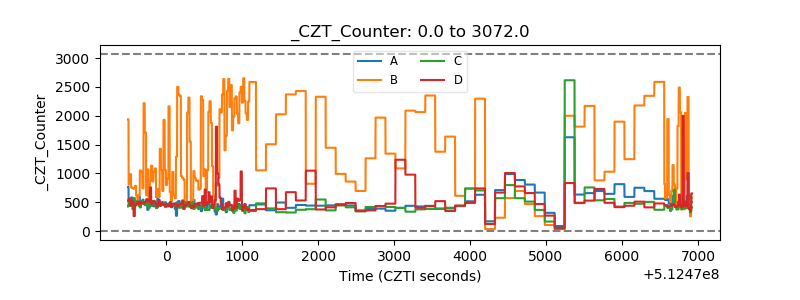 |
| +2.5 Volts monitor |  |
| +5 Volts monitor |  |
| _ROLL_ROT | 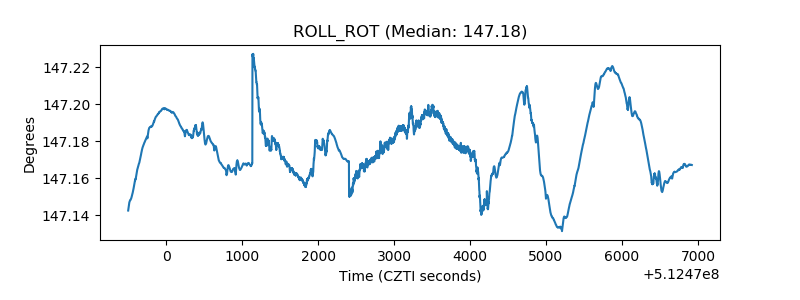 |
| _Roll_DEC | 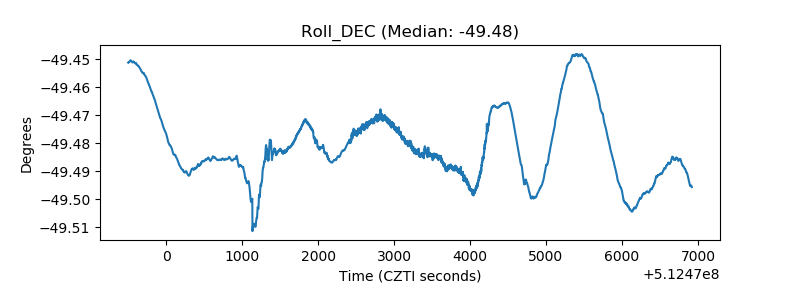 |
| _Roll_RA | 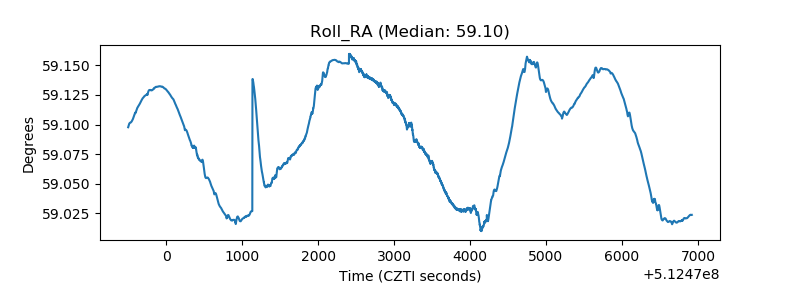 |
| Veto Counter | 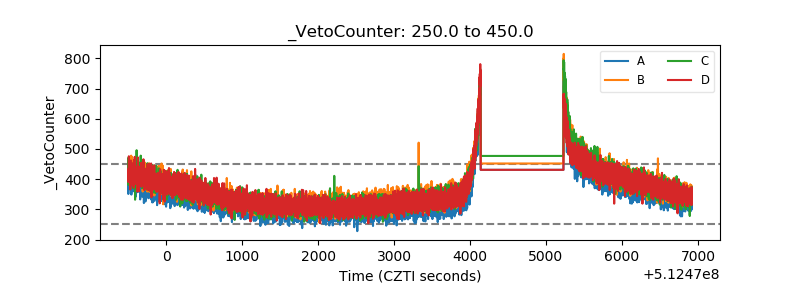 |