| Param | Original file | Final file |
|---|---|---|
| Filename | modeM0/AS1A14_083T03_9000006562_56812cztM0_level2.fits | modeM0/AS1A14_083T03_9000006562_56812cztM0_level2_quad_clean.evt |
| Size (bytes) | 590,204,160 | 90,368,640 |
| Size | 562.9 MB | 86.2 MB |
| Events in quadrant A | 3,917,777 | 642,737 |
| Events in quadrant B | 8,926,591 | 497,088 |
| Events in quadrant C | 4,853,991 | 564,854 |
| Events in quadrant D | 3,645,453 | 578,757 |
| Mode M9 | |||
|---|---|---|---|
| Quadrant | BADHDUFLAG | Total packets | Discarded packets |
| A | 0 | 10 | 0 |
| B | 0 | 10 | 0 |
| C | 0 | 10 | 0 |
| D | 0 | 10 | 0 |
| Mode SS | |||
|---|---|---|---|
| Quadrant | BADHDUFLAG | Total packets | Discarded packets |
| A | 0 | 134 | 0 |
| B | 0 | 134 | 0 |
| C | 0 | 134 | 0 |
| D | 0 | 134 | 0 |
| Mode M0 | |||
|---|---|---|---|
| Quadrant | BADHDUFLAG | Total packets | Discarded packets |
| A | 0 | 15858 | 1 |
| B | 0 | 31016 | 1 |
| C | 0 | 18995 | 6 |
| D | 0 | 15222 | 1 |
| Quadrant | Total seconds | Saturated seconds | Saturation percentage |
|---|---|---|---|
| A | 6484 | 153 | 2.359655% |
| B | 6484 | 2191 | 33.790870% |
| C | 6483 | 658 | 10.149622% |
| D | 6484 | 158 | 2.436767% |
Noise dominated data is calculated using 1-second bins in cleaned event files. If a bin has >2000 counts, and if more than 50% of those come from <1% of pixels, then it is considered to be noise-dominated and hence unusable.
| Quadrant | # 1 sec bins | Bins with >0 counts | Bins with >2000 counts | High rate bins dominated by noise | Noise dominated (total time) | Noise dominated (detector-on time) | Marked lightcurve |
|---|---|---|---|---|---|---|---|
| A | 7559 | 6485 | 27 | 27 | 0.36% | 0.42% | 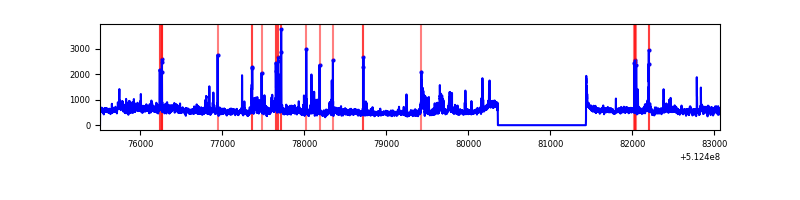 |
| B | 7559 | 6485 | 1532 | 1532 | 20.27% | 23.62% | 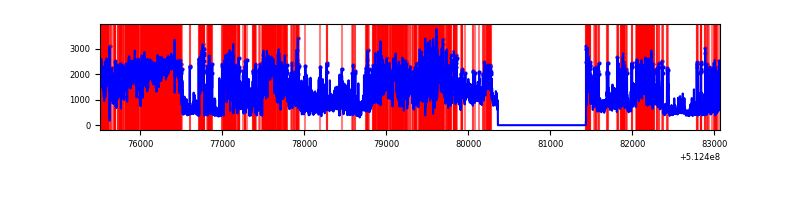 |
| C | 7558 | 6484 | 679 | 679 | 8.98% | 10.47% | 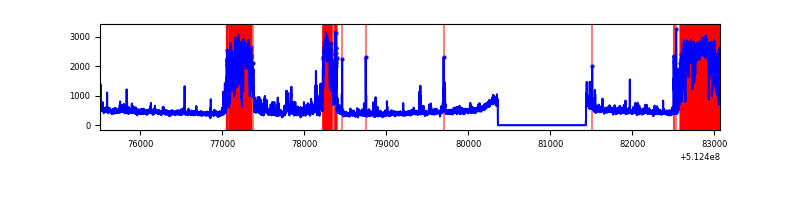 |
| D | 7559 | 6485 | 102 | 102 | 1.35% | 1.57% | 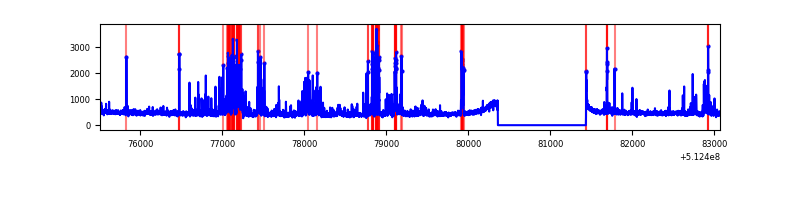 |
Top three noisy pixels from each quadrant. If the there are fewer than three noisy pixels in the level2.evt file, extra rows are filled as -1
| Pixel properties | Quadrant properties | ||||||
|---|---|---|---|---|---|---|---|
| Quadrant | DetID | PixID | Counts | Sigma | Mean | Median | Sigma |
| A | 3 | 14 | 734531 | 4115.56 | 722 | 702 | 178.3 |
| A | 10 | 251 | 229378 | 1282.49 | 722 | 702 | 178.3 |
| A | 12 | 3 | 93689 | 521.5 | 722 | 702 | 178.3 |
| B | 4 | 206 | 3462505 | 26334.78 | 612 | 592 | 131.5 |
| B | 5 | 185 | 1784116 | 13567.27 | 612 | 592 | 131.5 |
| B | 2 | 249 | 548599 | 4168.69 | 612 | 592 | 131.5 |
| C | 15 | 230 | 1968984 | 10557.44 | 677 | 669 | 186.4 |
| C | 14 | 254 | 61264 | 325.01 | 677 | 669 | 186.4 |
| C | 12 | 252 | 58084 | 307.96 | 677 | 669 | 186.4 |
| D | 2 | 249 | 381299 | 1936.01 | 698 | 666 | 196.6 |
| D | 2 | 31 | 194880 | 987.83 | 698 | 666 | 196.6 |
| D | 5 | 173 | 52938 | 265.87 | 698 | 666 | 196.6 |
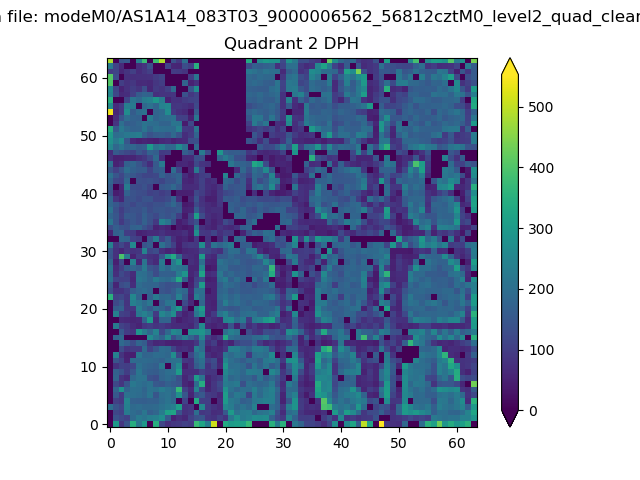
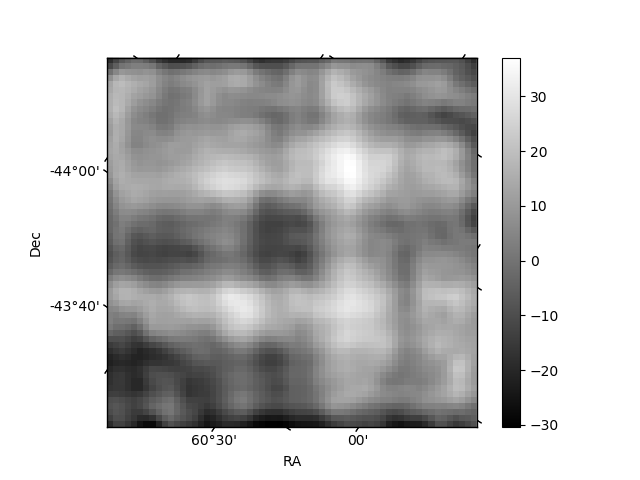
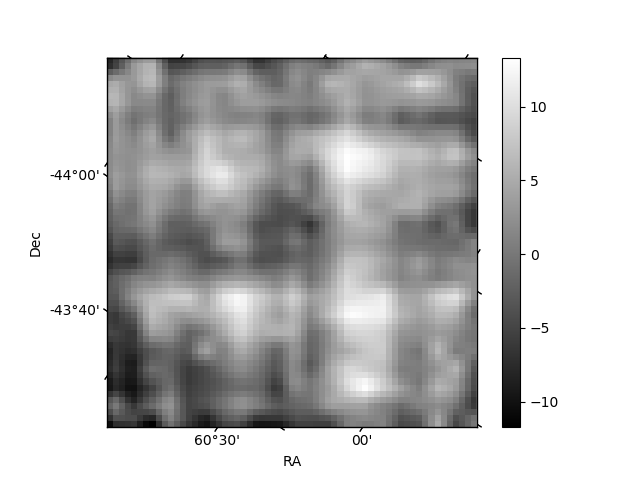
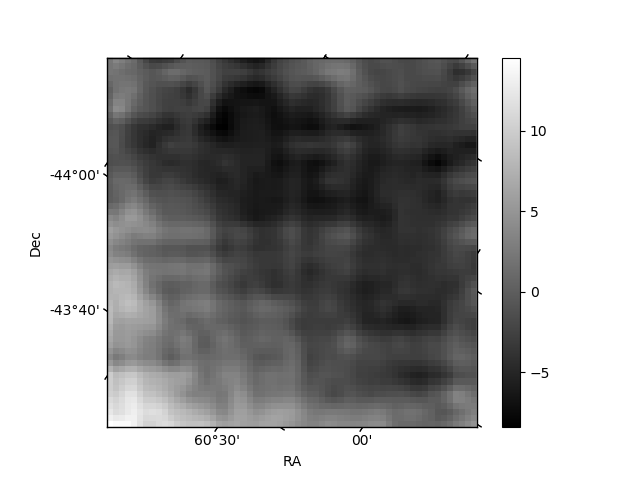
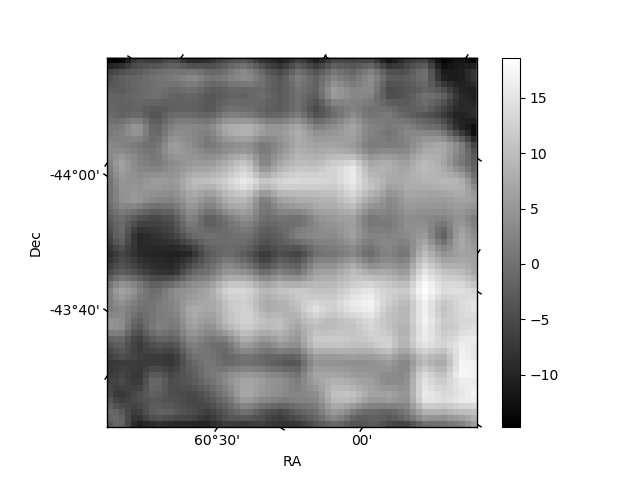
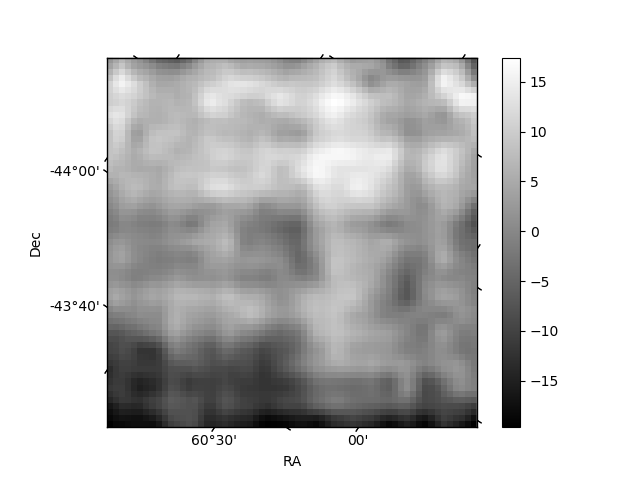
Histogram calculated using DETX and DETY for each event in the final _common_clean file
| Quadrant A | 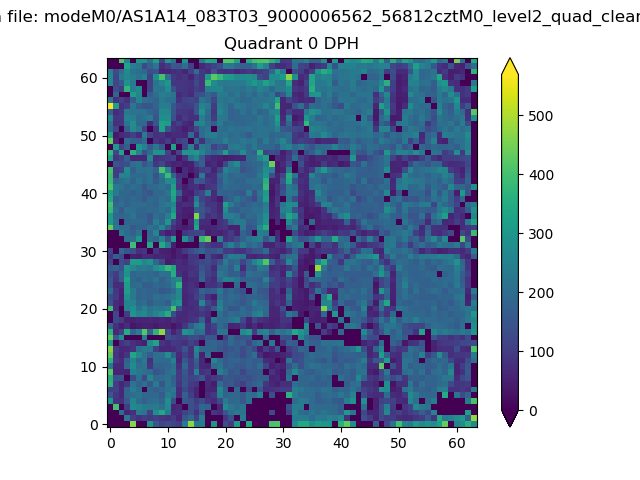 |
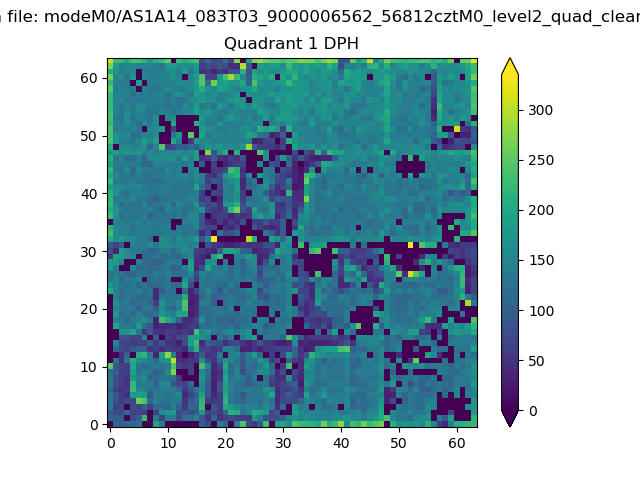 |
Quadrant B |
|---|---|---|---|
| Quadrant D | 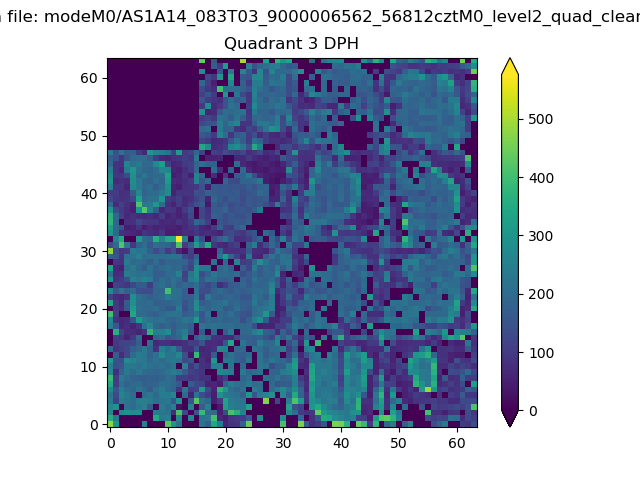 |
 |
Quadrant C |
| Plot type | Count rate plots | Images |
|---|---|---|
| Comparison with Poisson distribution Blue bars denote a histogram of data divided into 1 sec bins. Red curve is a Poisson curve with rate = median count rate of data. |
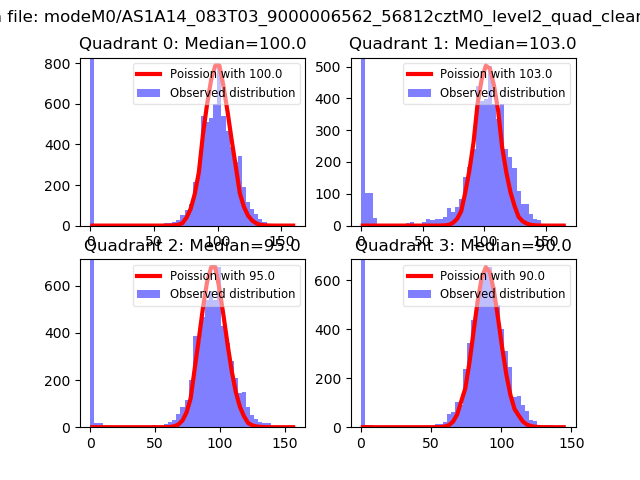 |
 |
| Quadrant-wise count rates Data is divided into 100 sec bins |
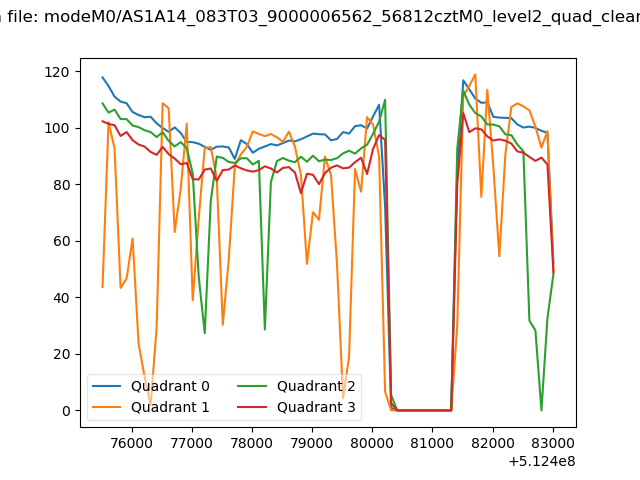 |
|
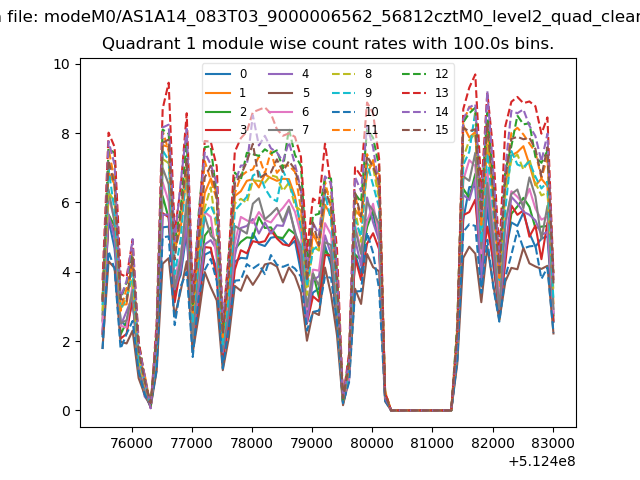
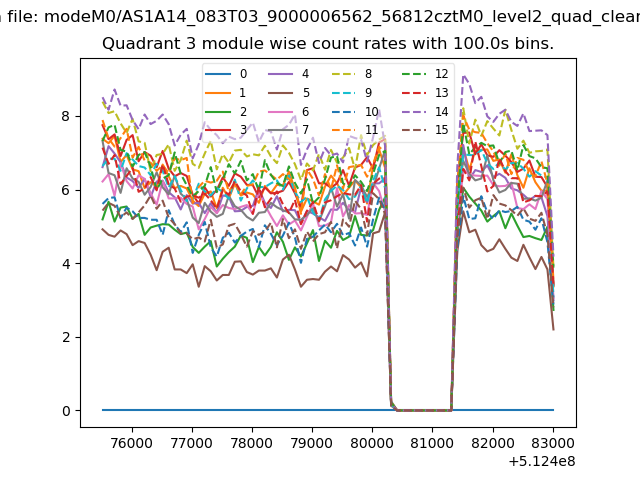
| Module-wise count rates for Quadrant A Data is divided into 100 sec bins |
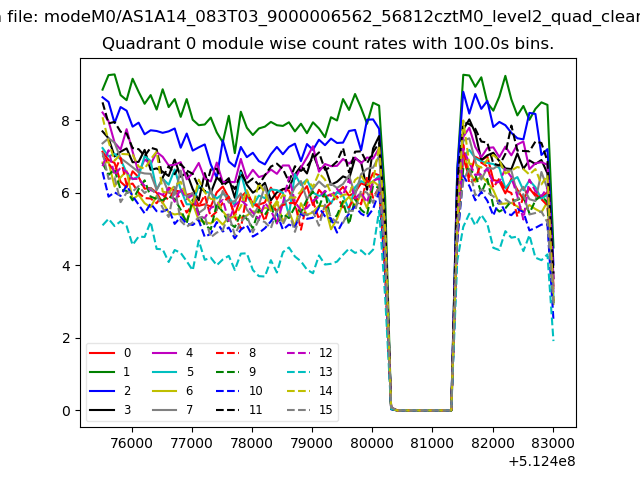 |
 |
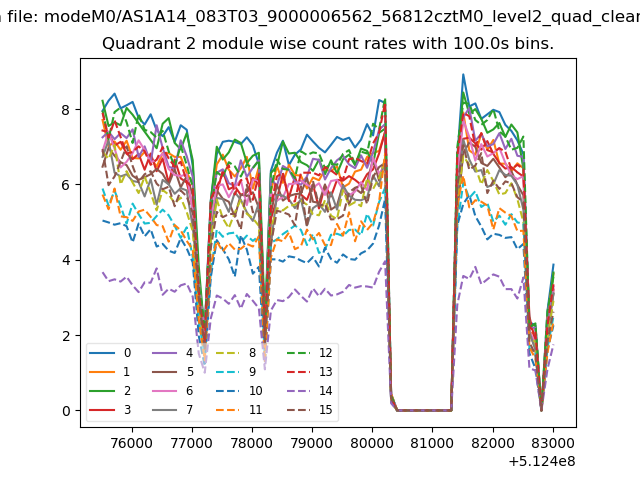
| Module-wise count rates for Quadrant B Data is divided into 100 sec bins |
 |
 |
| Module-wise count rates for Quadrant C Data is divided into 100 sec bins |
 |
 |
| Module-wise count rates for Quadrant D Data is divided into 100 sec bins |
 |
 |
| Parameter | Plot |
|---|---|
| CZT HV Monitor | 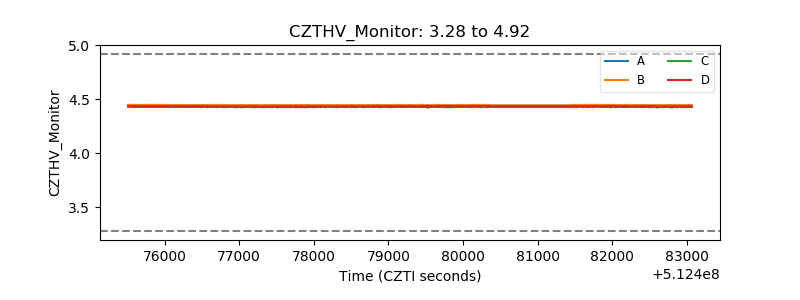 |
| D_VDD | 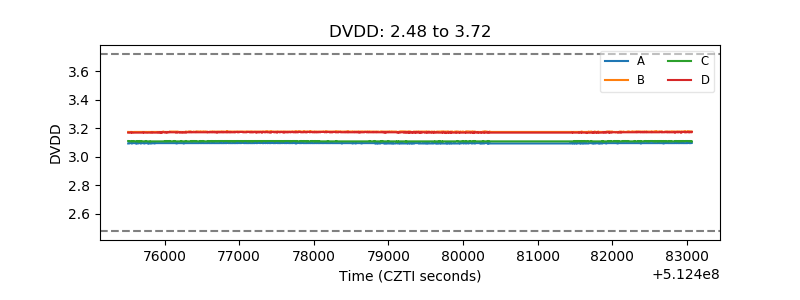 |
| Temperature 1 | 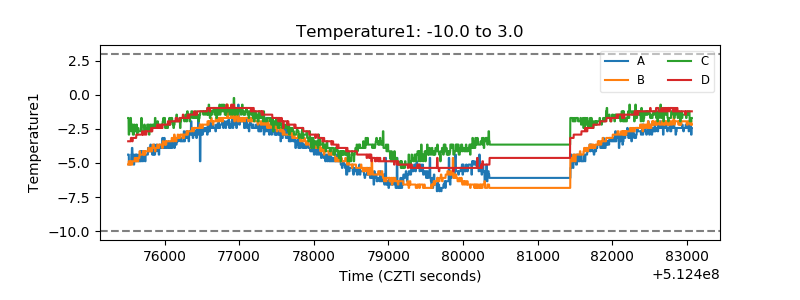 |
| Veto HV Monitor | 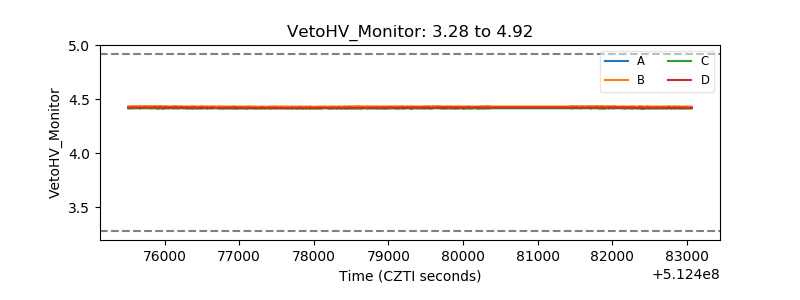 |
| Veto LLD | 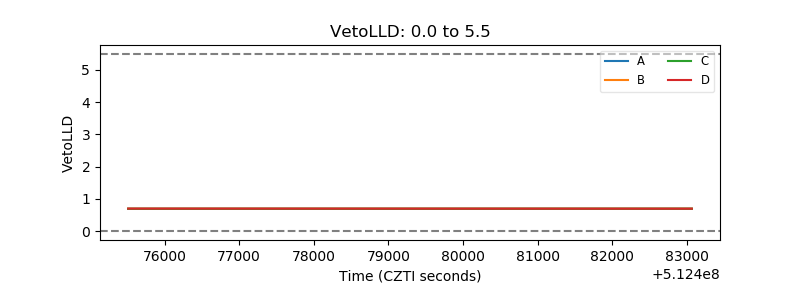 |
| Alpha Counter | 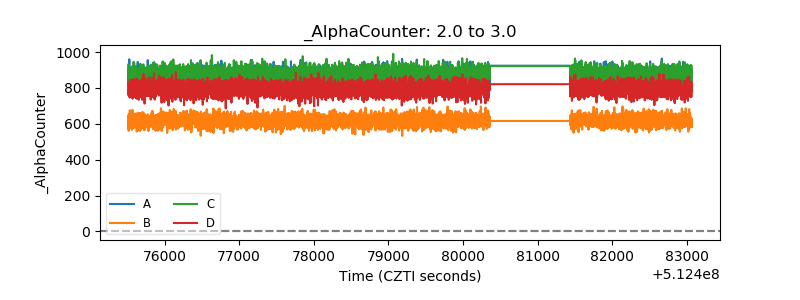 |
| _CPM_Rate | 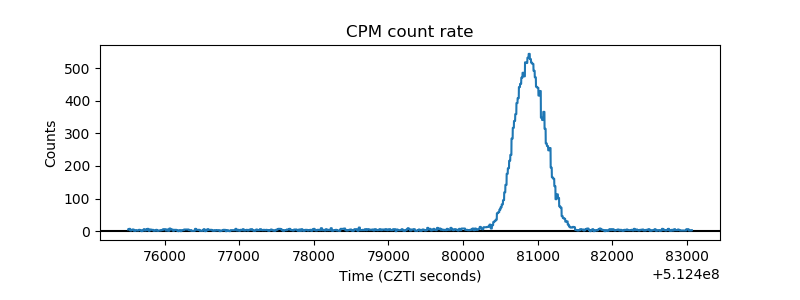 |
| CZT Counter | 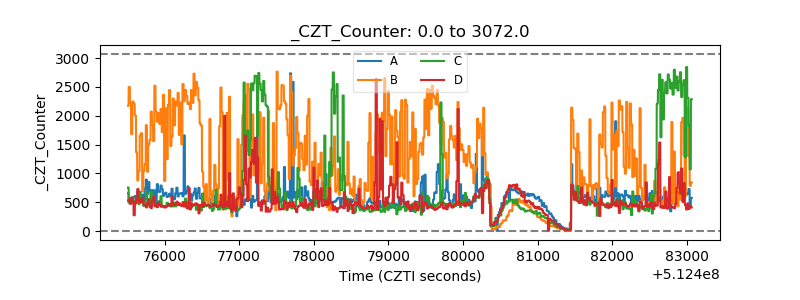 |
| +2.5 Volts monitor |  |
| +5 Volts monitor |  |
| _ROLL_ROT | 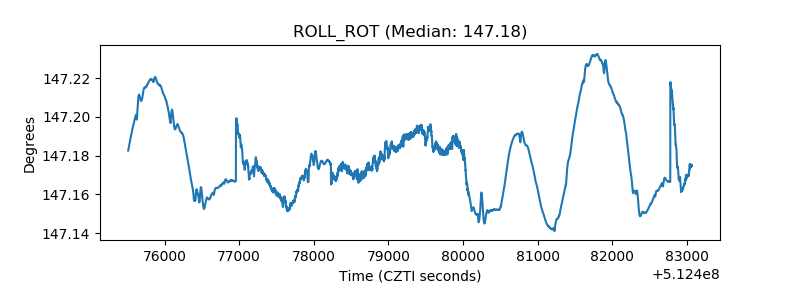 |
| _Roll_DEC | 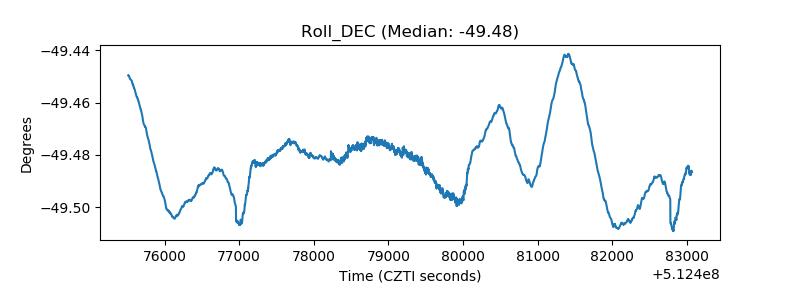 |
| _Roll_RA | 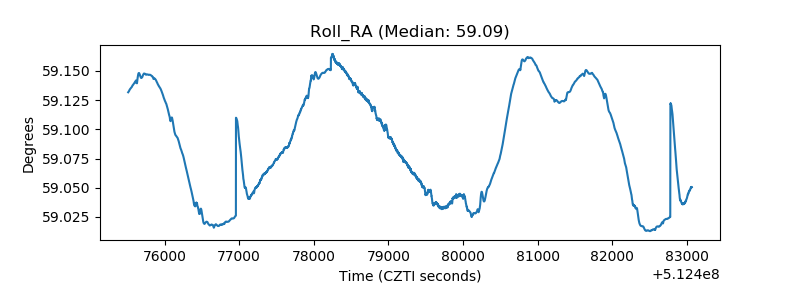 |
| Veto Counter | 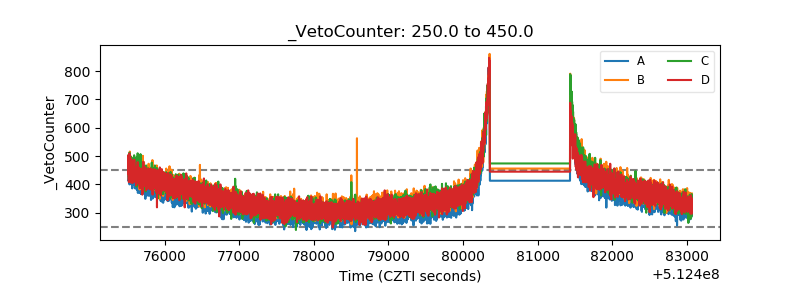 |