| Param | Original file | Final file |
|---|---|---|
| Filename | modeM0/AS1A14_083T03_9000006562_56813cztM0_level2.fits | modeM0/AS1A14_083T03_9000006562_56813cztM0_level2_quad_clean.evt |
| Size (bytes) | 455,967,360 | 87,863,040 |
| Size | 434.8 MB | 83.8 MB |
| Events in quadrant A | 3,413,316 | 593,135 |
| Events in quadrant B | 5,288,864 | 582,809 |
| Events in quadrant C | 4,702,129 | 517,982 |
| Events in quadrant D | 2,995,171 | 536,746 |
| Mode M9 | |||
|---|---|---|---|
| Quadrant | BADHDUFLAG | Total packets | Discarded packets |
| A | 0 | 11 | 0 |
| B | 0 | 11 | 0 |
| C | 0 | 11 | 0 |
| D | 0 | 11 | 0 |
| Mode SS | |||
|---|---|---|---|
| Quadrant | BADHDUFLAG | Total packets | Discarded packets |
| A | 0 | 124 | 0 |
| B | 0 | 124 | 0 |
| C | 0 | 124 | 0 |
| D | 0 | 124 | 0 |
| Mode M0 | |||
|---|---|---|---|
| Quadrant | BADHDUFLAG | Total packets | Discarded packets |
| A | 0 | 14047 | 1 |
| B | 0 | 19958 | 1 |
| C | 0 | 18529 | 1 |
| D | 0 | 13395 | 1 |
| Quadrant | Total seconds | Saturated seconds | Saturation percentage |
|---|---|---|---|
| A | 6159 | 144 | 2.338042% |
| B | 6159 | 730 | 11.852573% |
| C | 6158 | 661 | 10.734005% |
| D | 6159 | 91 | 1.477513% |
Noise dominated data is calculated using 1-second bins in cleaned event files. If a bin has >2000 counts, and if more than 50% of those come from <1% of pixels, then it is considered to be noise-dominated and hence unusable.
| Quadrant | # 1 sec bins | Bins with >0 counts | Bins with >2000 counts | High rate bins dominated by noise | Noise dominated (total time) | Noise dominated (detector-on time) | Marked lightcurve |
|---|---|---|---|---|---|---|---|
| A | 7184 | 6160 | 22 | 22 | 0.31% | 0.36% | 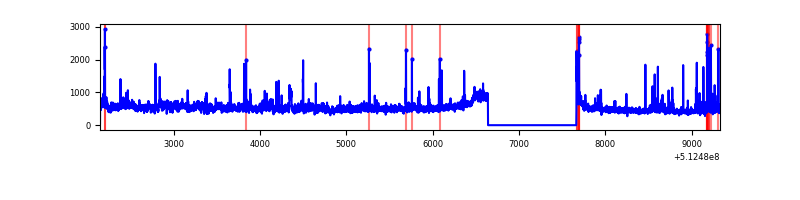 |
| B | 7184 | 6160 | 483 | 483 | 6.72% | 7.84% | 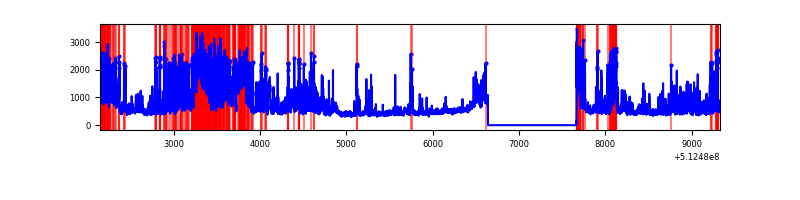 |
| C | 7183 | 6159 | 690 | 690 | 9.61% | 11.20% | 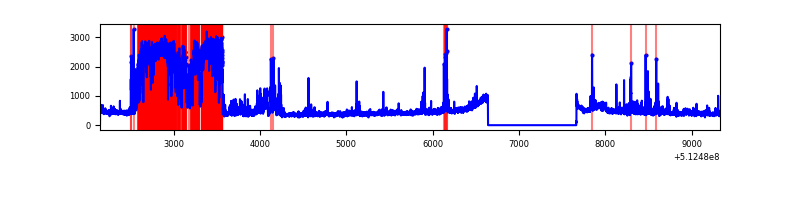 |
| D | 7184 | 6160 | 27 | 27 | 0.38% | 0.44% | 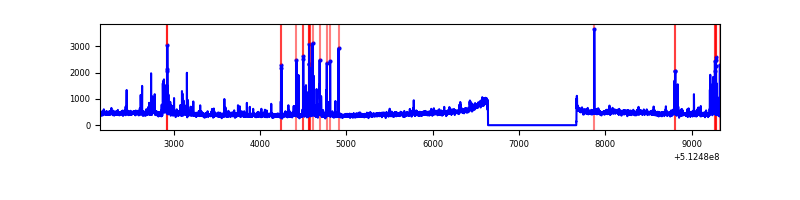 |
Top three noisy pixels from each quadrant. If the there are fewer than three noisy pixels in the level2.evt file, extra rows are filled as -1
| Pixel properties | Quadrant properties | ||||||
|---|---|---|---|---|---|---|---|
| Quadrant | DetID | PixID | Counts | Sigma | Mean | Median | Sigma |
| A | 3 | 14 | 589028 | 3566.36 | 668 | 653 | 165.0 |
| A | 10 | 251 | 114902 | 692.51 | 668 | 653 | 165.0 |
| A | 7 | 64 | 75173 | 451.69 | 668 | 653 | 165.0 |
| B | 4 | 206 | 1546471 | 11409.93 | 630 | 607 | 135.5 |
| B | 5 | 185 | 718683 | 5300.07 | 630 | 607 | 135.5 |
| B | 10 | 16 | 125017 | 918.26 | 630 | 607 | 135.5 |
| C | 15 | 230 | 1945597 | 11261.72 | 623 | 615 | 172.7 |
| C | 13 | 3 | 83410 | 479.39 | 623 | 615 | 172.7 |
| C | 14 | 254 | 77253 | 443.74 | 623 | 615 | 172.7 |
| D | 2 | 249 | 220808 | 1213.14 | 645 | 618 | 181.5 |
| D | 5 | 173 | 51270 | 279.07 | 645 | 618 | 181.5 |
| D | 2 | 31 | 46720 | 254.0 | 645 | 618 | 181.5 |
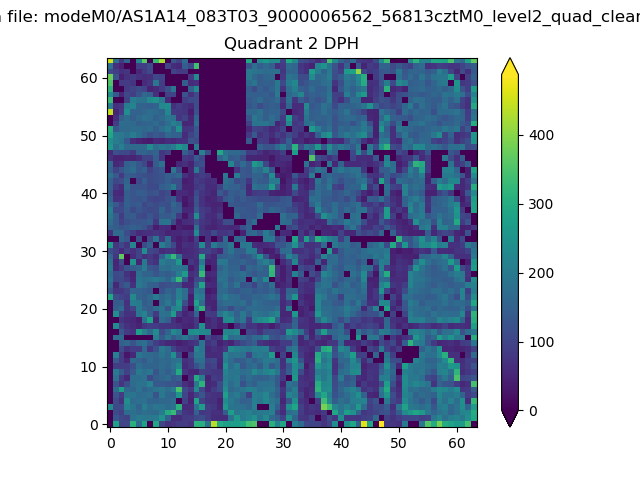
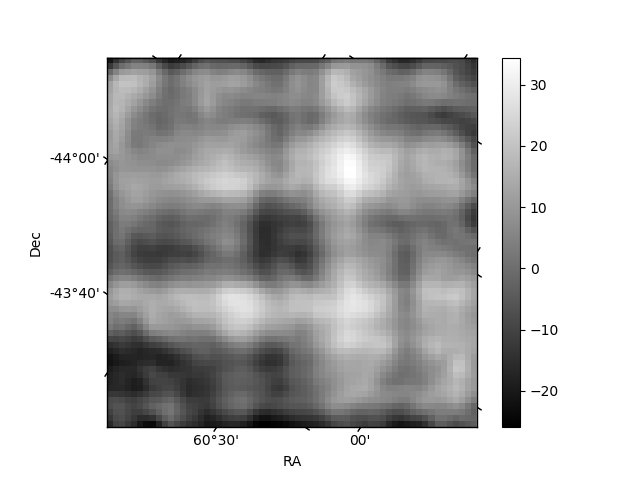
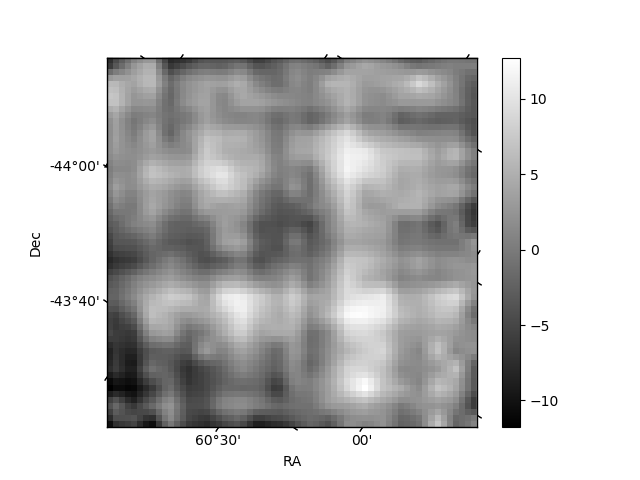
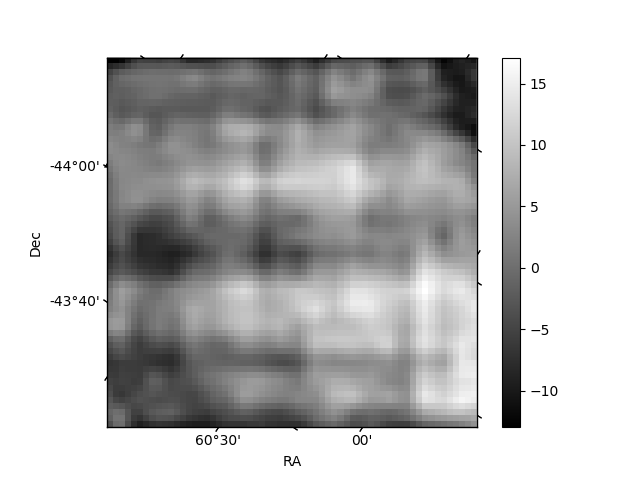
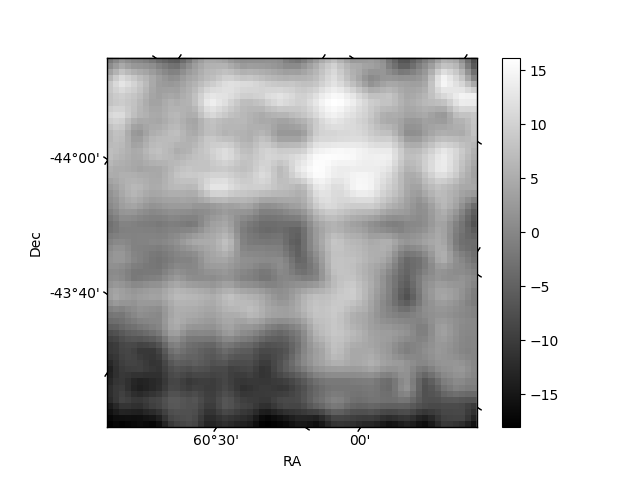
Histogram calculated using DETX and DETY for each event in the final _common_clean file
| Quadrant A | 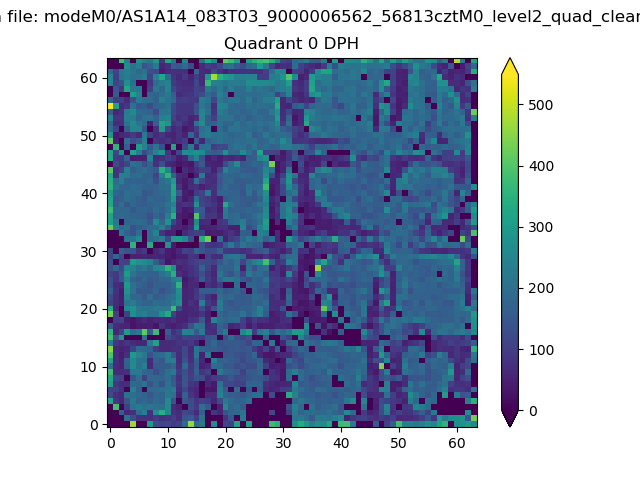 |
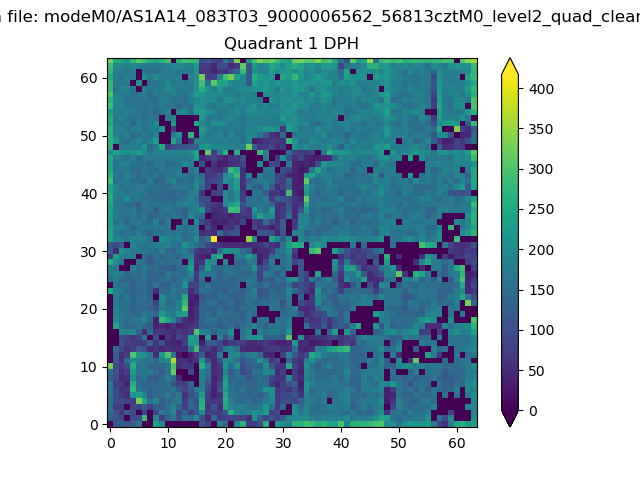 |
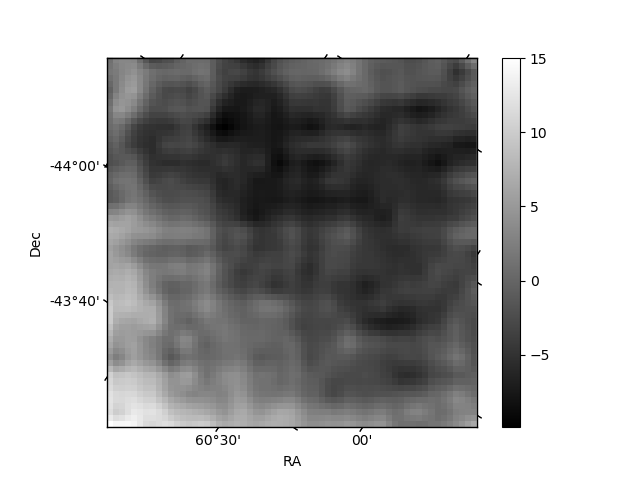
Quadrant B |
|---|---|---|---|
| Quadrant D | 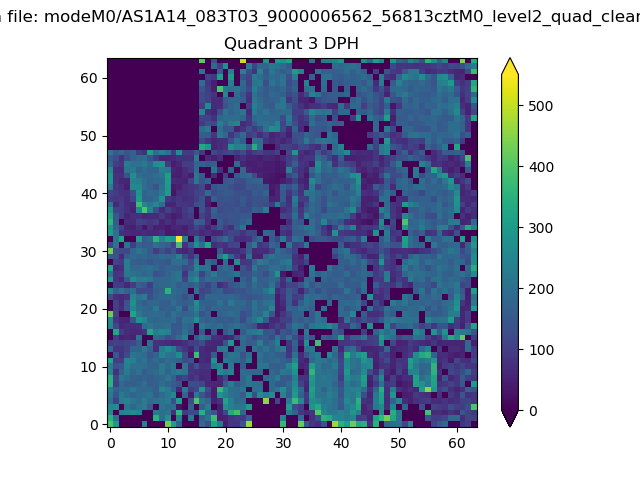 |
 |
Quadrant C |
| Plot type | Count rate plots | Images |
|---|---|---|
| Comparison with Poisson distribution Blue bars denote a histogram of data divided into 1 sec bins. Red curve is a Poisson curve with rate = median count rate of data. |
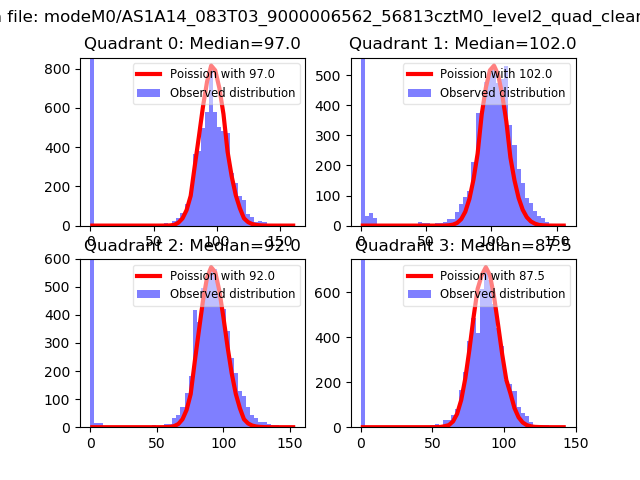 |
 |
| Quadrant-wise count rates Data is divided into 100 sec bins |
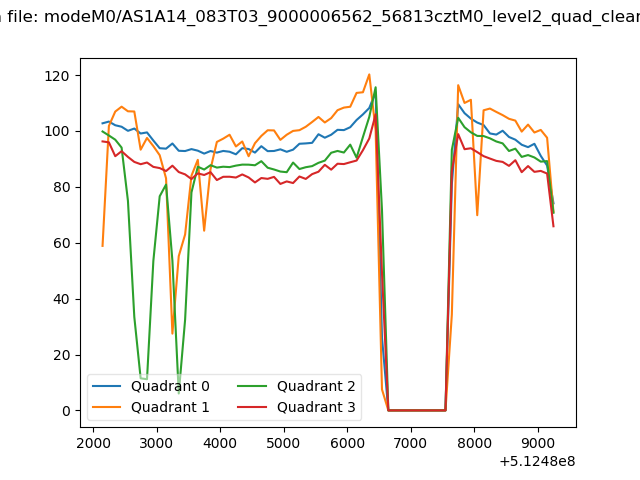 |
|
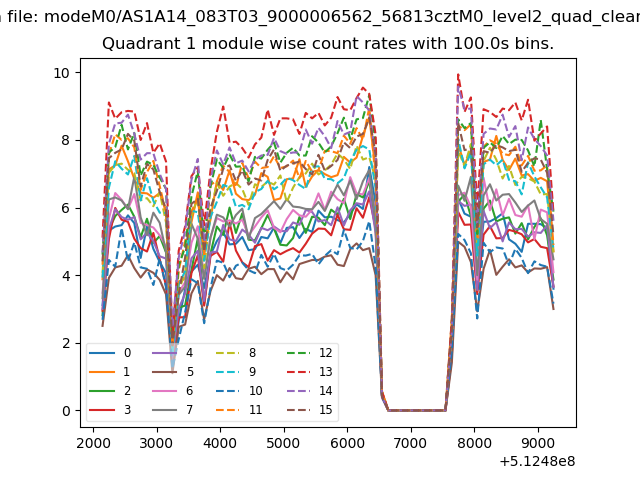
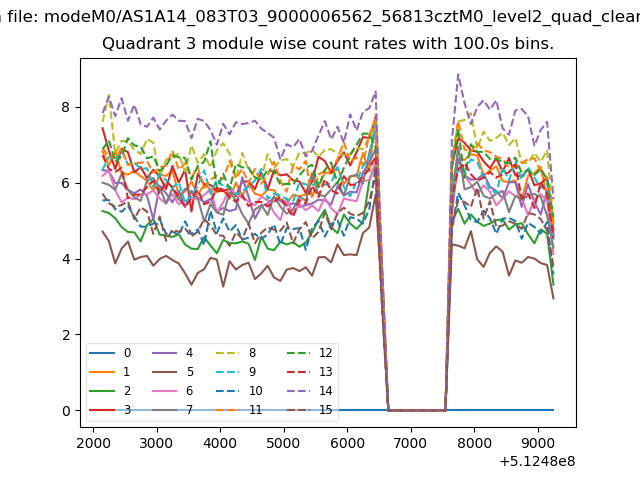
| Module-wise count rates for Quadrant A Data is divided into 100 sec bins |
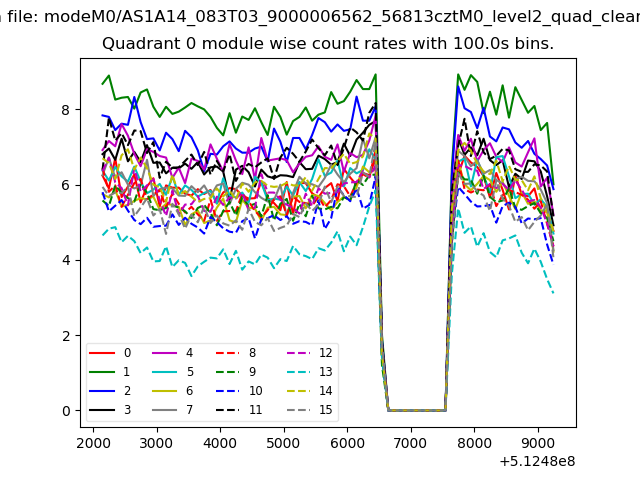 |
 |
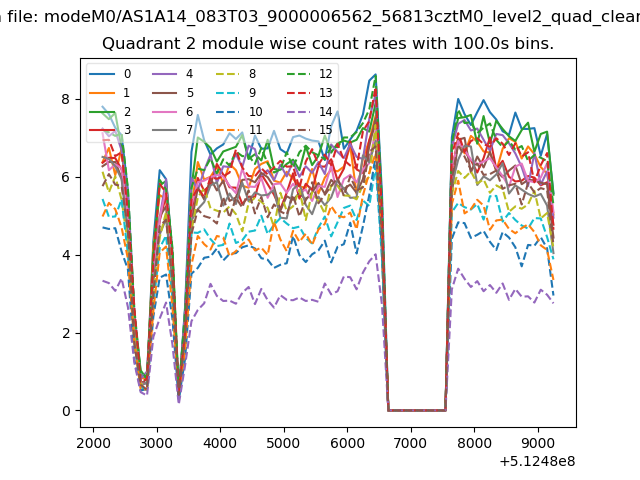
| Module-wise count rates for Quadrant B Data is divided into 100 sec bins |
 |
 |
| Module-wise count rates for Quadrant C Data is divided into 100 sec bins |
 |
 |
| Module-wise count rates for Quadrant D Data is divided into 100 sec bins |
 |
 |
| Parameter | Plot |
|---|---|
| CZT HV Monitor | 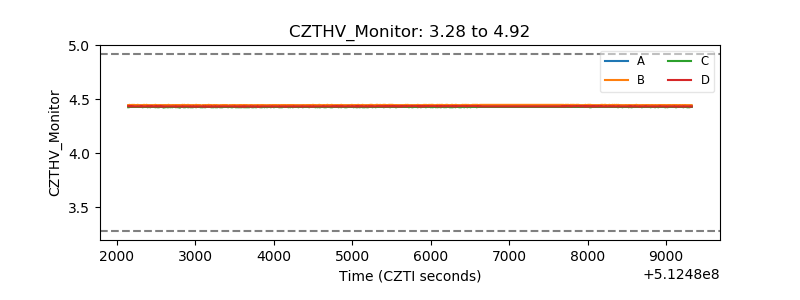 |
| D_VDD | 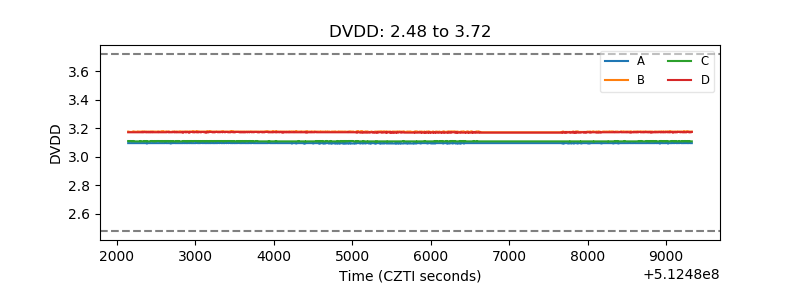 |
| Temperature 1 | 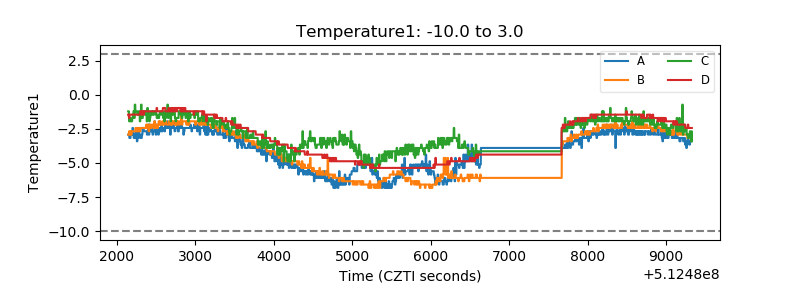 |
| Veto HV Monitor | 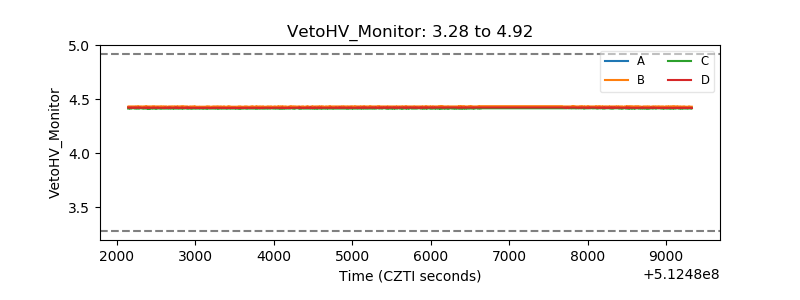 |
| Veto LLD | 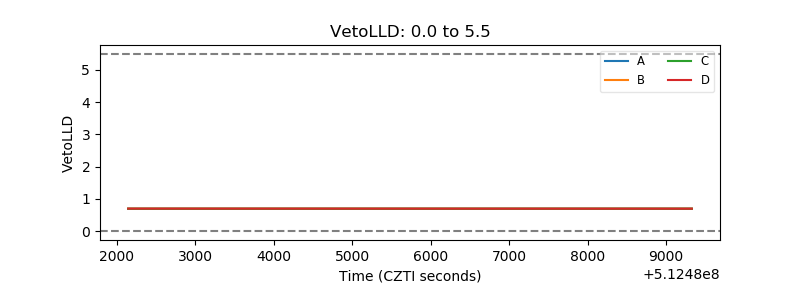 |
| Alpha Counter | 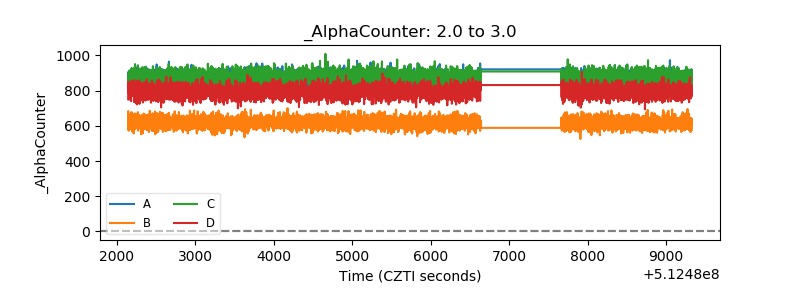 |
| _CPM_Rate | 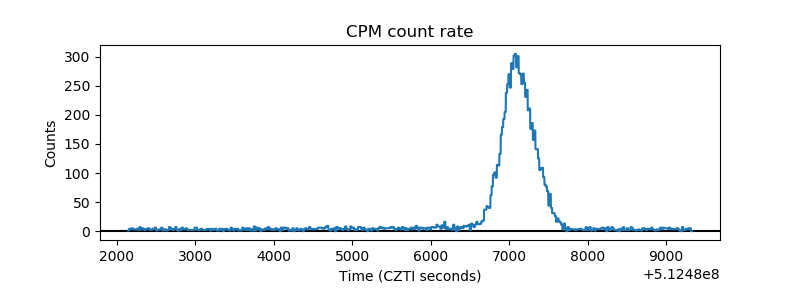 |
| CZT Counter | 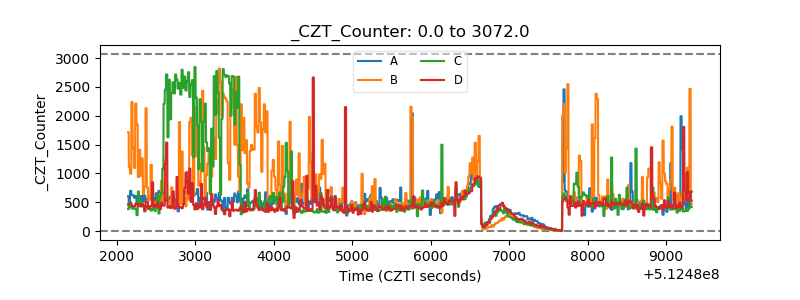 |
| +2.5 Volts monitor | 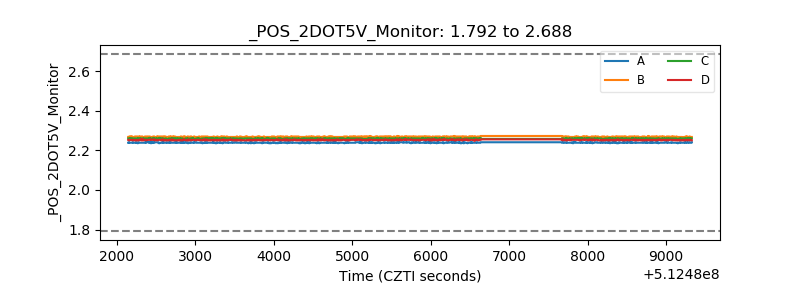 |
| +5 Volts monitor | 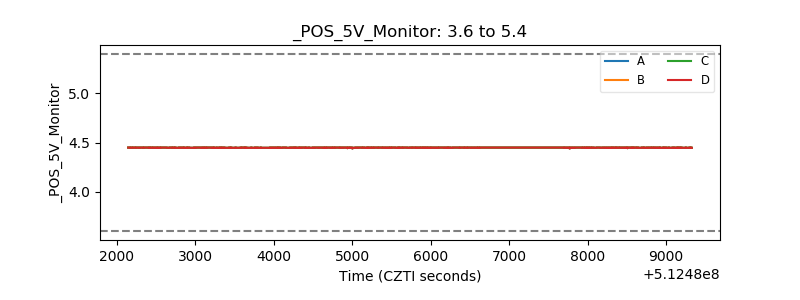 |
| _ROLL_ROT | 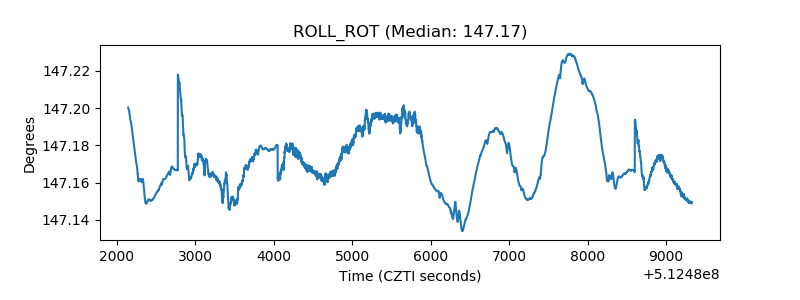 |
| _Roll_DEC | 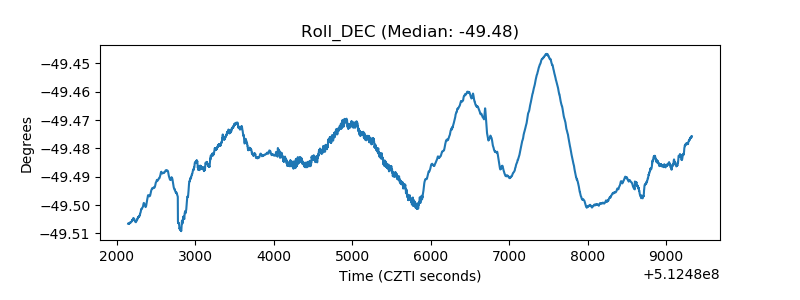 |
| _Roll_RA | 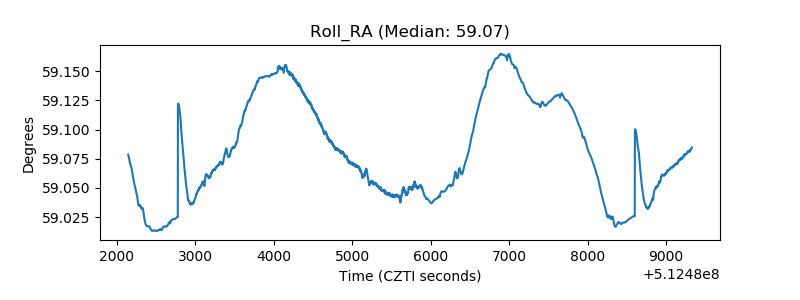 |
| Veto Counter | 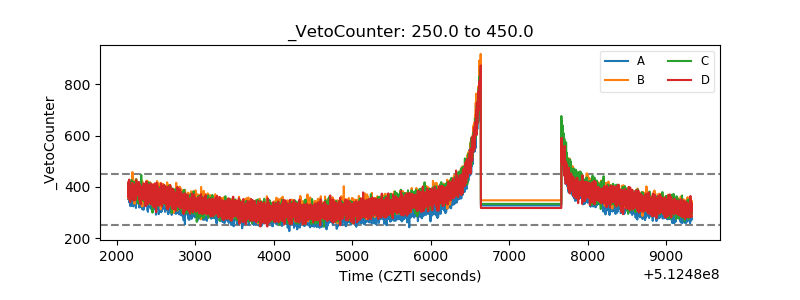 |