| Param | Original file | Final file |
|---|---|---|
| Filename | modeM0/AS1A14_083T03_9000006562_56814cztM0_level2.fits | modeM0/AS1A14_083T03_9000006562_56814cztM0_level2_quad_clean.evt |
| Size (bytes) | 463,740,480 | 89,936,640 |
| Size | 442.3 MB | 85.8 MB |
| Events in quadrant A | 4,808,722 | 586,728 |
| Events in quadrant B | 4,539,117 | 615,077 |
| Events in quadrant C | 3,876,847 | 552,157 |
| Events in quadrant D | 3,455,634 | 532,400 |
| Mode M9 | |||
|---|---|---|---|
| Quadrant | BADHDUFLAG | Total packets | Discarded packets |
| A | 0 | 8 | 0 |
| B | 0 | 8 | 0 |
| C | 0 | 8 | 0 |
| D | 0 | 8 | 0 |
| Mode SS | |||
|---|---|---|---|
| Quadrant | BADHDUFLAG | Total packets | Discarded packets |
| A | 0 | 128 | 0 |
| B | 0 | 128 | 0 |
| C | 0 | 128 | 0 |
| D | 0 | 128 | 0 |
| Mode M0 | |||
|---|---|---|---|
| Quadrant | BADHDUFLAG | Total packets | Discarded packets |
| A | 0 | 18799 | 1 |
| B | 0 | 17837 | 1 |
| C | 0 | 16120 | 1 |
| D | 0 | 14957 | 1 |
| Quadrant | Total seconds | Saturated seconds | Saturation percentage |
|---|---|---|---|
| A | 6255 | 200 | 3.197442% |
| B | 6256 | 366 | 5.850384% |
| C | 6256 | 236 | 3.772379% |
| D | 6256 | 121 | 1.934143% |
Noise dominated data is calculated using 1-second bins in cleaned event files. If a bin has >2000 counts, and if more than 50% of those come from <1% of pixels, then it is considered to be noise-dominated and hence unusable.
| Quadrant | # 1 sec bins | Bins with >0 counts | Bins with >2000 counts | High rate bins dominated by noise | Noise dominated (total time) | Noise dominated (detector-on time) | Marked lightcurve |
|---|---|---|---|---|---|---|---|
| A | 7140 | 6255 | 129 | 129 | 1.81% | 2.06% | 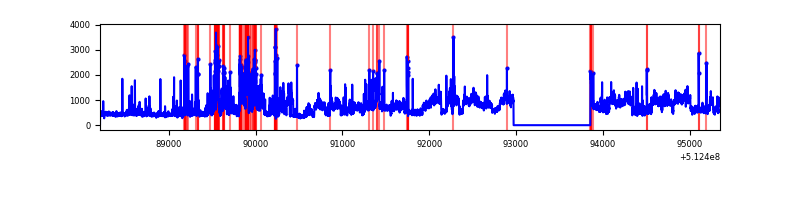 |
| B | 7141 | 6256 | 172 | 172 | 2.41% | 2.75% | 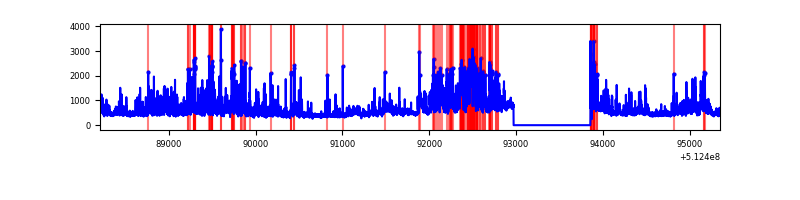 |
| C | 7141 | 6256 | 192 | 192 | 2.69% | 3.07% | 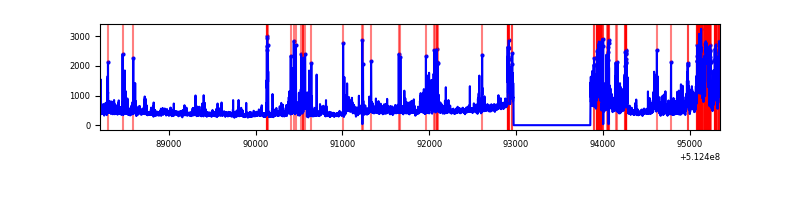 |
| D | 7141 | 6256 | 134 | 134 | 1.88% | 2.14% | 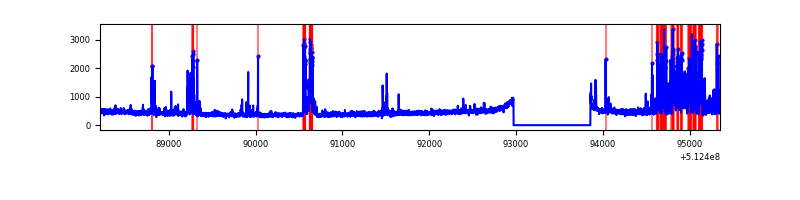 |
Top three noisy pixels from each quadrant. If the there are fewer than three noisy pixels in the level2.evt file, extra rows are filled as -1
| Pixel properties | Quadrant properties | ||||||
|---|---|---|---|---|---|---|---|
| Quadrant | DetID | PixID | Counts | Sigma | Mean | Median | Sigma |
| A | 3 | 14 | 1439229 | 8767.18 | 661 | 643 | 164.1 |
| A | 7 | 64 | 550604 | 3351.63 | 661 | 643 | 164.1 |
| A | 10 | 251 | 206585 | 1255.07 | 661 | 643 | 164.1 |
| B | 8 | 128 | 710801 | 5057.79 | 648 | 626 | 140.4 |
| B | 5 | 185 | 418941 | 2979.2 | 648 | 626 | 140.4 |
| B | 4 | 206 | 374838 | 2665.1 | 648 | 626 | 140.4 |
| C | 13 | 3 | 644360 | 3733.43 | 629 | 621 | 172.4 |
| C | 15 | 230 | 477119 | 2763.5 | 629 | 621 | 172.4 |
| C | 14 | 254 | 90860 | 523.35 | 629 | 621 | 172.4 |
| D | 2 | 249 | 696978 | 3824.03 | 639 | 606 | 182.1 |
| D | 2 | 31 | 120145 | 656.43 | 639 | 606 | 182.1 |
| D | 5 | 173 | 48481 | 262.9 | 639 | 606 | 182.1 |
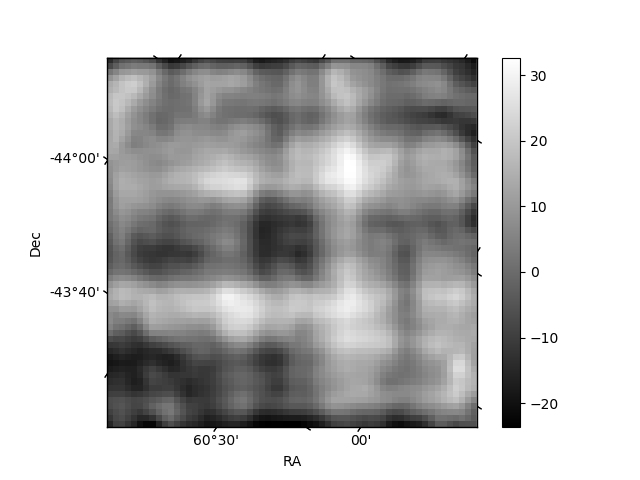
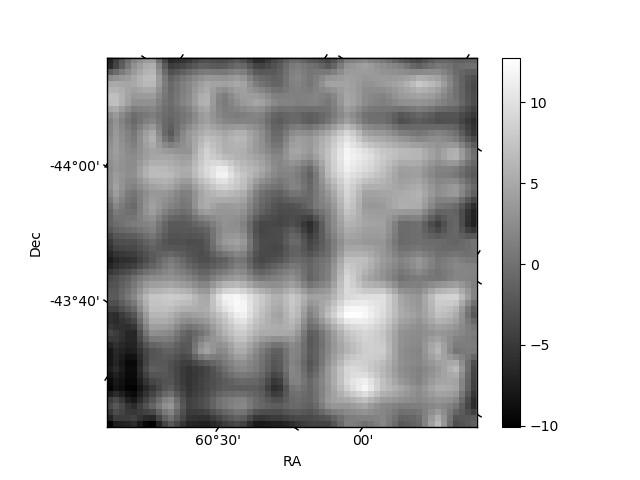
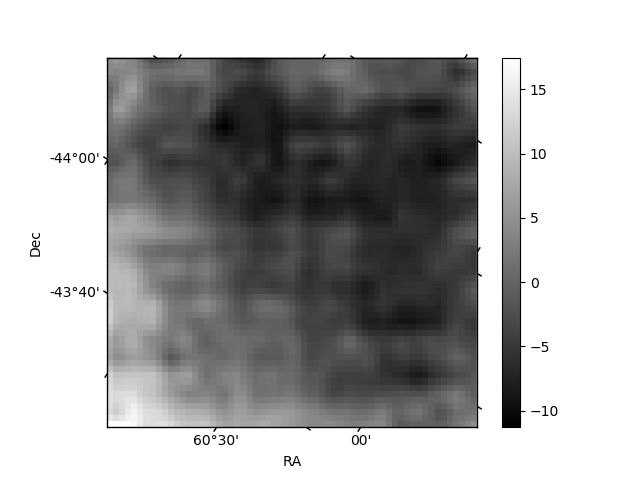
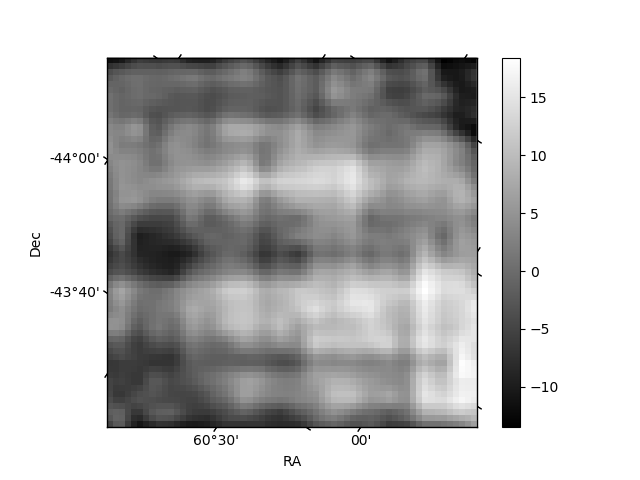
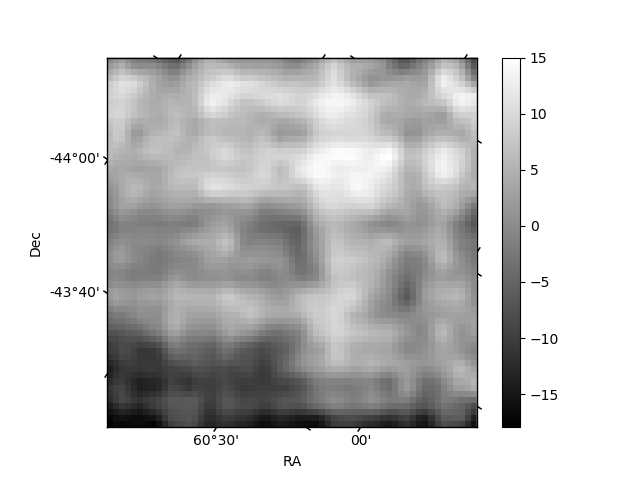
Histogram calculated using DETX and DETY for each event in the final _common_clean file
| Quadrant A | 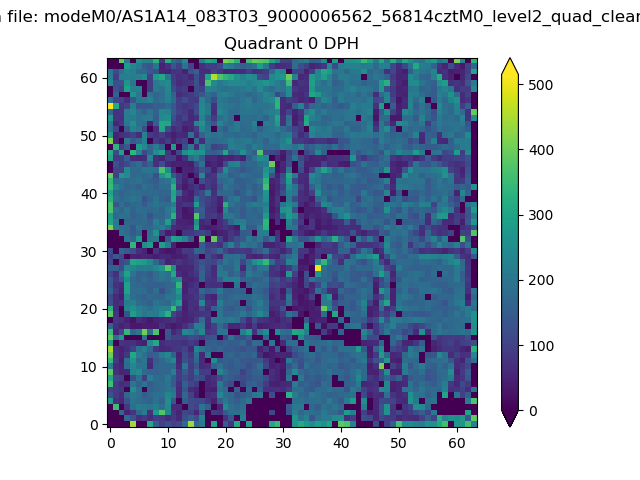 |
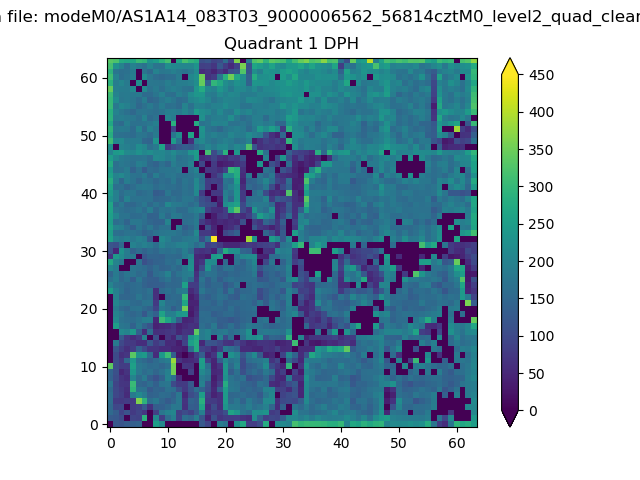 |
Quadrant B |
|---|---|---|---|
| Quadrant D | 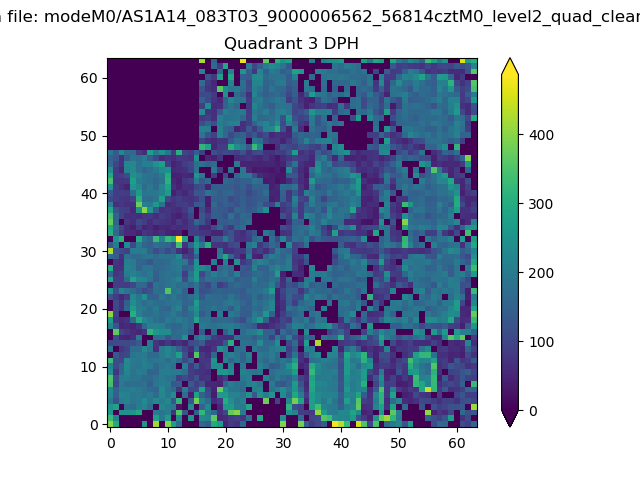 |
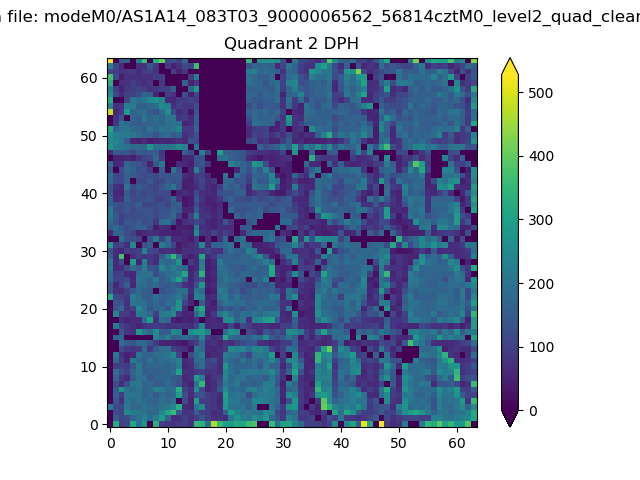 |
Quadrant C |
| Plot type | Count rate plots | Images |
|---|---|---|
| Comparison with Poisson distribution Blue bars denote a histogram of data divided into 1 sec bins. Red curve is a Poisson curve with rate = median count rate of data. |
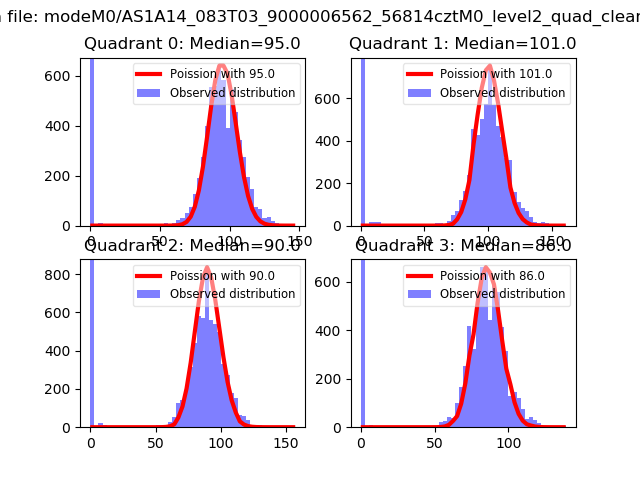 |
 |
| Quadrant-wise count rates Data is divided into 100 sec bins |
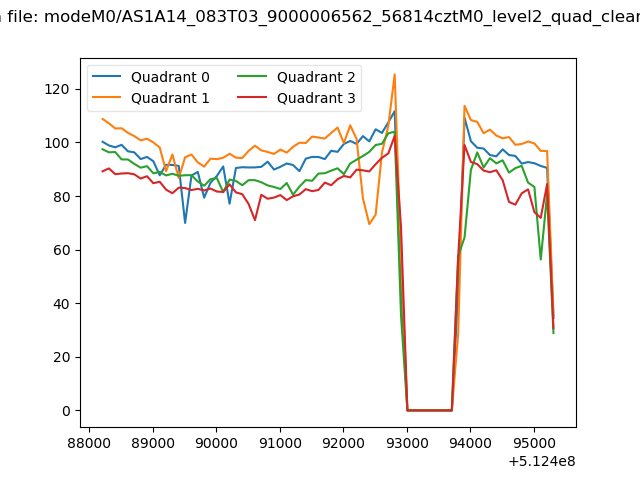 |
|
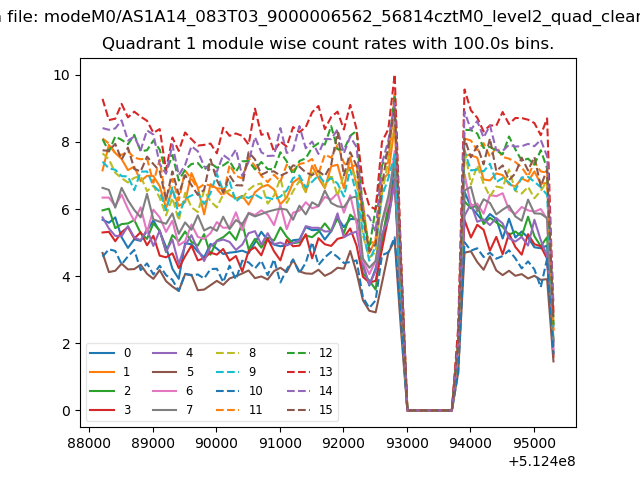
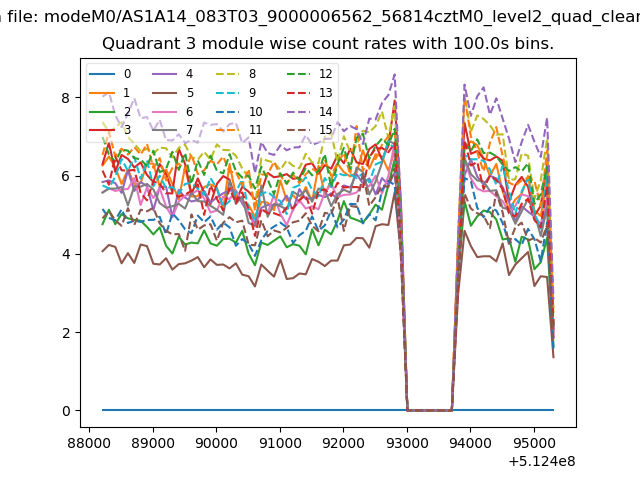
| Module-wise count rates for Quadrant A Data is divided into 100 sec bins |
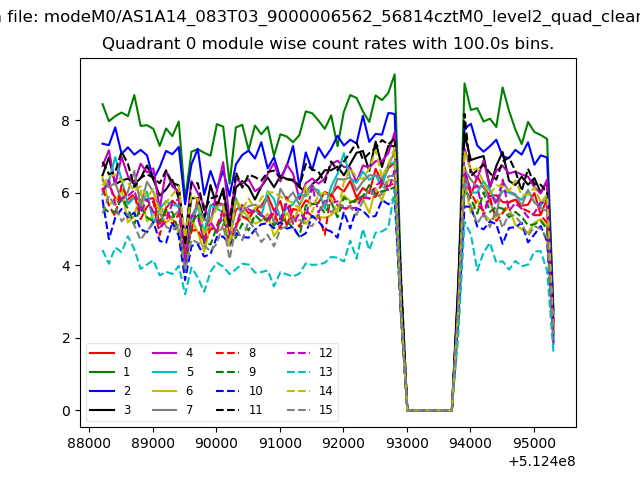 |
 |
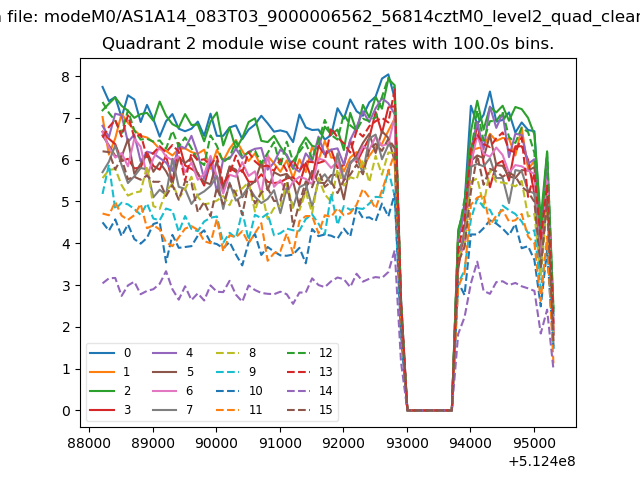
| Module-wise count rates for Quadrant B Data is divided into 100 sec bins |
 |
 |
| Module-wise count rates for Quadrant C Data is divided into 100 sec bins |
 |
 |
| Module-wise count rates for Quadrant D Data is divided into 100 sec bins |
 |
 |
| Parameter | Plot |
|---|---|
| CZT HV Monitor | 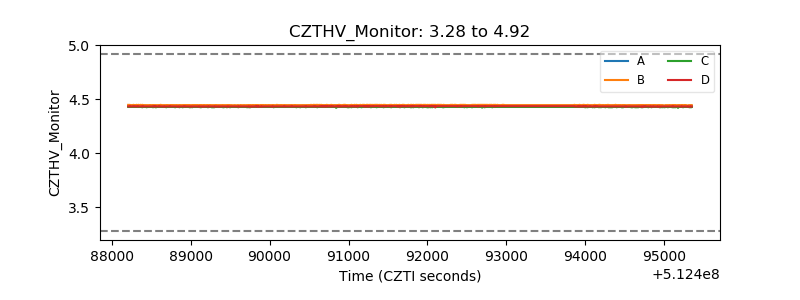 |
| D_VDD | 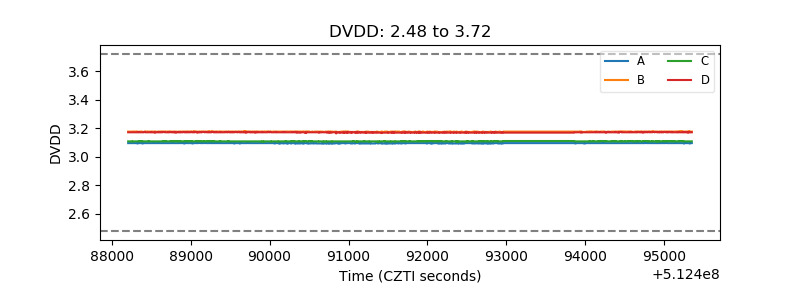 |
| Temperature 1 | 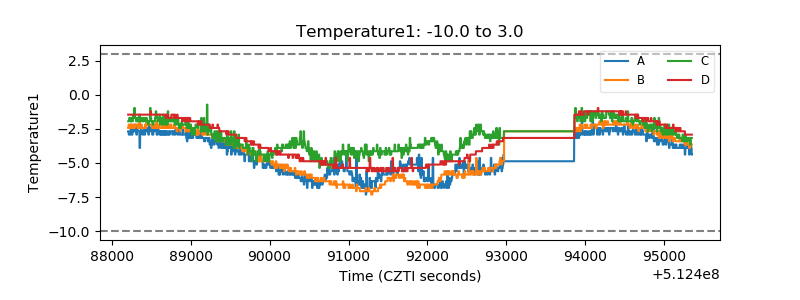 |
| Veto HV Monitor | 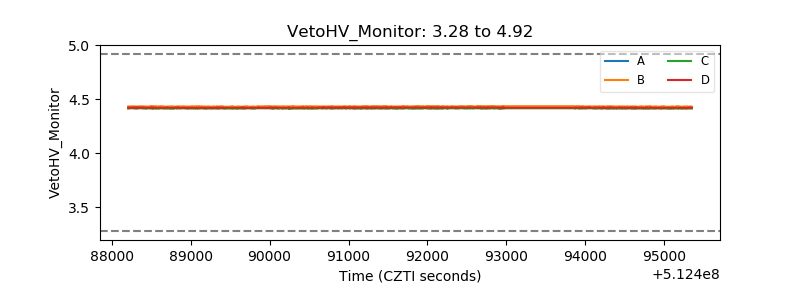 |
| Veto LLD | 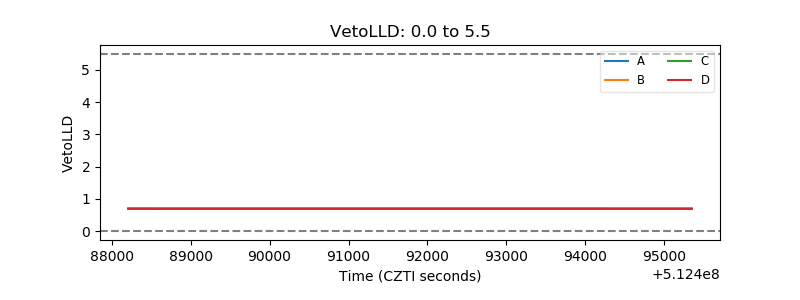 |
| Alpha Counter | 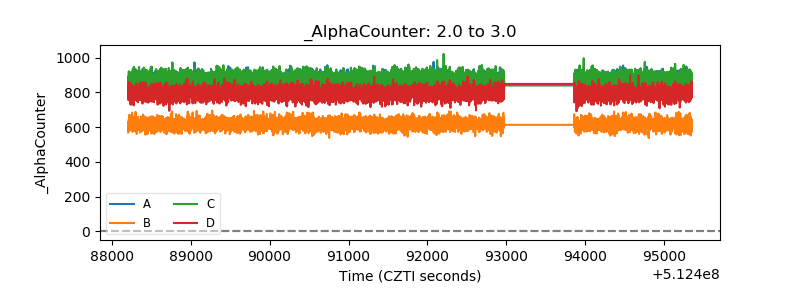 |
| _CPM_Rate | 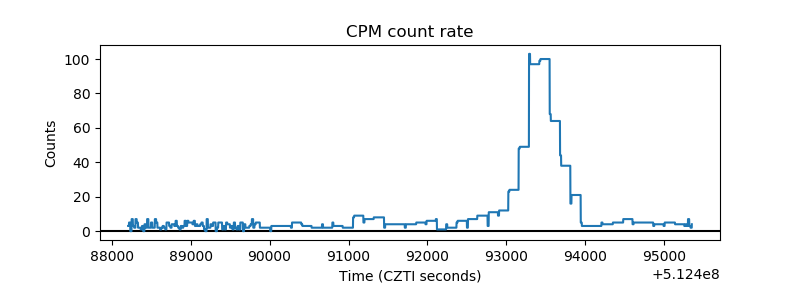 |
| CZT Counter | 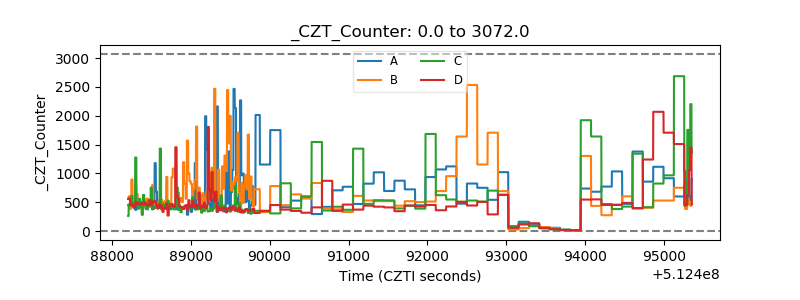 |
| +2.5 Volts monitor | 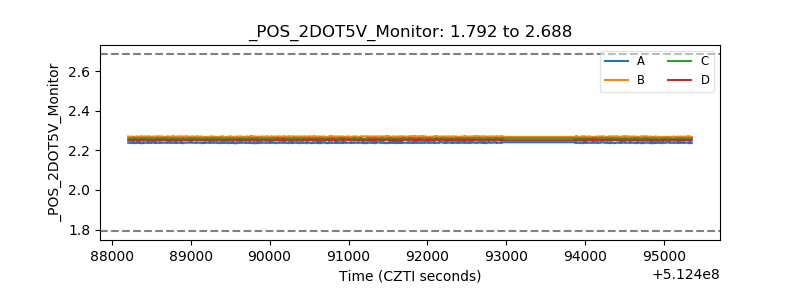 |
| +5 Volts monitor | 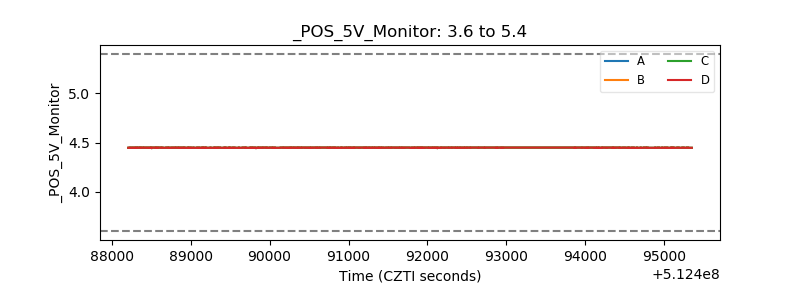 |
| _ROLL_ROT | 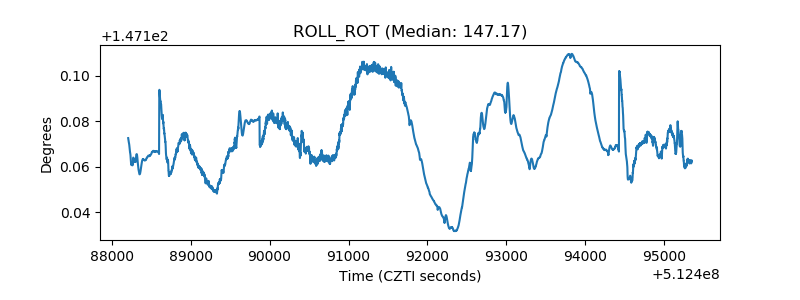 |
| _Roll_DEC | 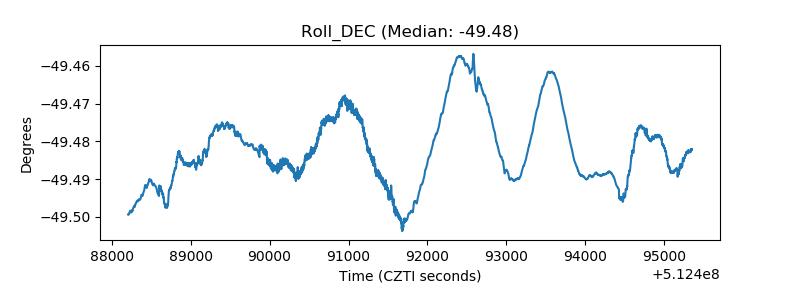 |
| _Roll_RA | 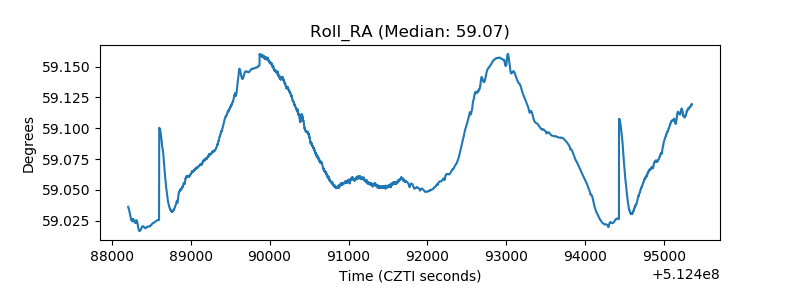 |
| Veto Counter | 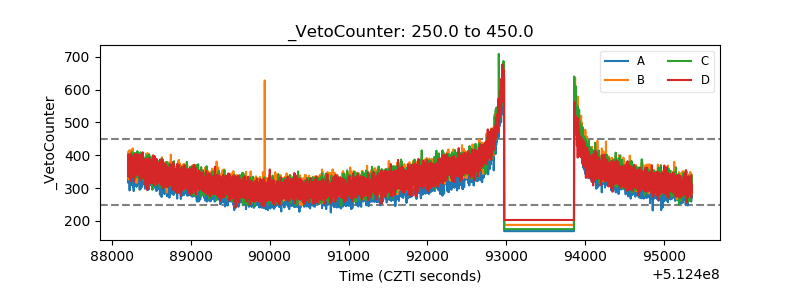 |