| Param | Original file | Final file |
|---|---|---|
| Filename | modeM0/AS1A14_083T03_9000006562_56815cztM0_level2.fits | modeM0/AS1A14_083T03_9000006562_56815cztM0_level2_quad_clean.evt |
| Size (bytes) | 528,960,960 | 96,382,080 |
| Size | 504.5 MB | 91.9 MB |
| Events in quadrant A | 5,611,975 | 636,070 |
| Events in quadrant B | 5,115,393 | 660,543 |
| Events in quadrant C | 4,486,270 | 579,642 |
| Events in quadrant D | 3,840,550 | 569,090 |
| Mode M9 | |||
|---|---|---|---|
| Quadrant | BADHDUFLAG | Total packets | Discarded packets |
| A | 0 | 5 | 0 |
| B | 0 | 5 | 0 |
| C | 0 | 5 | 0 |
| D | 0 | 5 | 0 |
| Mode SS | |||
|---|---|---|---|
| Quadrant | BADHDUFLAG | Total packets | Discarded packets |
| A | 0 | 138 | 0 |
| B | 0 | 138 | 0 |
| C | 0 | 138 | 0 |
| D | 0 | 138 | 0 |
| Mode M0 | |||
|---|---|---|---|
| Quadrant | BADHDUFLAG | Total packets | Discarded packets |
| A | 0 | 21413 | 1 |
| B | 0 | 19952 | 1 |
| C | 0 | 18352 | 1 |
| D | 0 | 16445 | 2 |
| Quadrant | Total seconds | Saturated seconds | Saturation percentage |
|---|---|---|---|
| A | 6785 | 117 | 1.724392% |
| B | 6786 | 392 | 5.776599% |
| C | 6786 | 418 | 6.159741% |
| D | 6785 | 130 | 1.915991% |
Noise dominated data is calculated using 1-second bins in cleaned event files. If a bin has >2000 counts, and if more than 50% of those come from <1% of pixels, then it is considered to be noise-dominated and hence unusable.
| Quadrant | # 1 sec bins | Bins with >0 counts | Bins with >2000 counts | High rate bins dominated by noise | Noise dominated (total time) | Noise dominated (detector-on time) | Marked lightcurve |
|---|---|---|---|---|---|---|---|
| A | 7300 | 6786 | 52 | 52 | 0.71% | 0.77% | 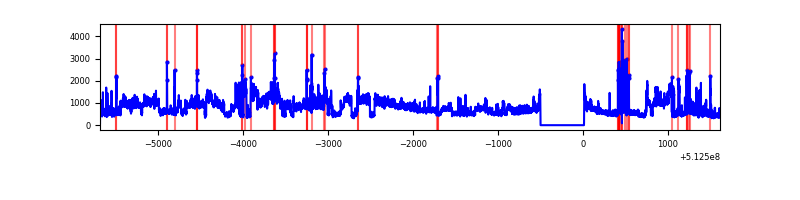 |
| B | 7301 | 6787 | 248 | 248 | 3.40% | 3.65% | 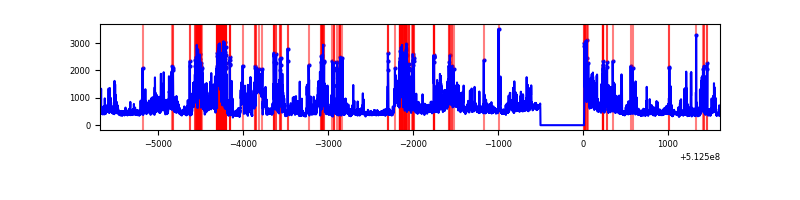 |
| C | 7301 | 6787 | 415 | 415 | 5.68% | 6.11% | 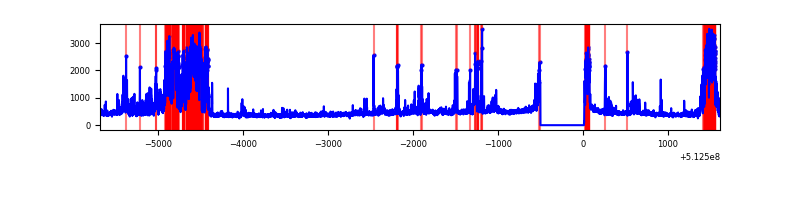 |
| D | 7300 | 6786 | 150 | 150 | 2.05% | 2.21% | 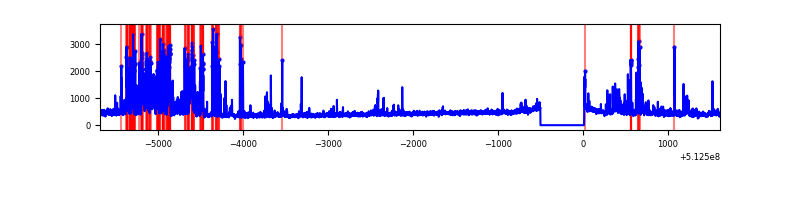 |
Top three noisy pixels from each quadrant. If the there are fewer than three noisy pixels in the level2.evt file, extra rows are filled as -1
| Pixel properties | Quadrant properties | ||||||
|---|---|---|---|---|---|---|---|
| Quadrant | DetID | PixID | Counts | Sigma | Mean | Median | Sigma |
| A | 3 | 14 | 2526500 | 14324.74 | 710 | 691 | 176.3 |
| A | 10 | 251 | 259914 | 1470.14 | 710 | 691 | 176.3 |
| A | 12 | 147 | 20261 | 110.99 | 710 | 691 | 176.3 |
| B | 8 | 128 | 818421 | 5510.77 | 696 | 672 | 148.4 |
| B | 4 | 206 | 749831 | 5048.55 | 696 | 672 | 148.4 |
| B | 5 | 185 | 380622 | 2560.47 | 696 | 672 | 148.4 |
| C | 15 | 230 | 1374513 | 7406.82 | 673 | 665 | 185.5 |
| C | 13 | 3 | 144041 | 772.98 | 673 | 665 | 185.5 |
| C | 1 | 16 | 115144 | 617.19 | 673 | 665 | 185.5 |
| D | 2 | 249 | 802236 | 4132.07 | 684 | 652 | 194.0 |
| D | 2 | 31 | 182325 | 936.5 | 684 | 652 | 194.0 |
| D | 5 | 173 | 54975 | 280.03 | 684 | 652 | 194.0 |
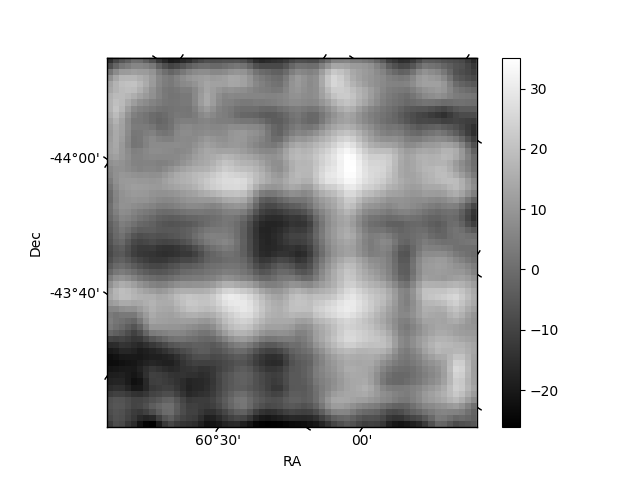
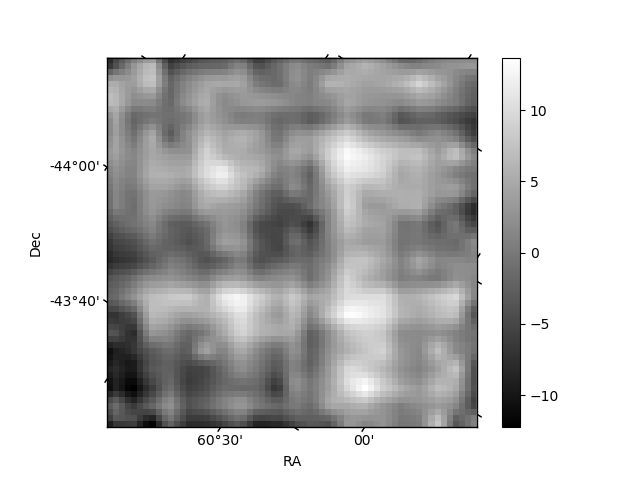
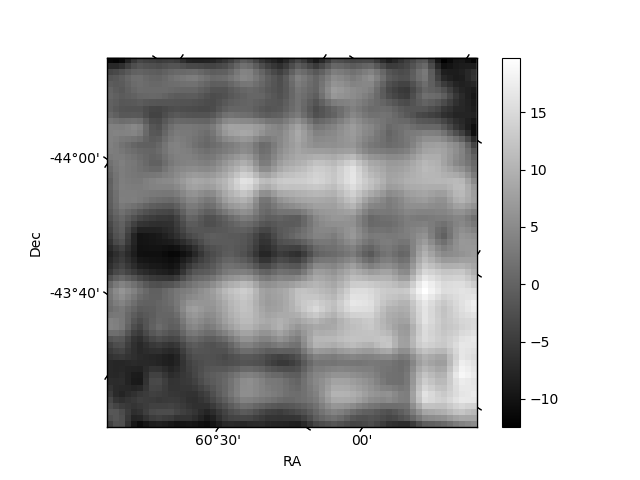
Histogram calculated using DETX and DETY for each event in the final _common_clean file
| Quadrant A | 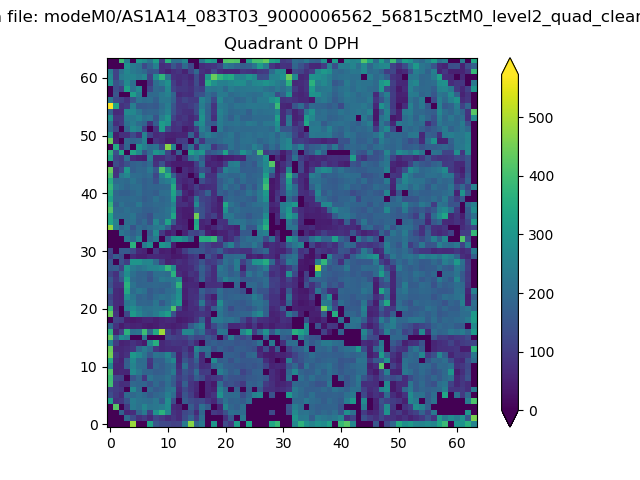 |
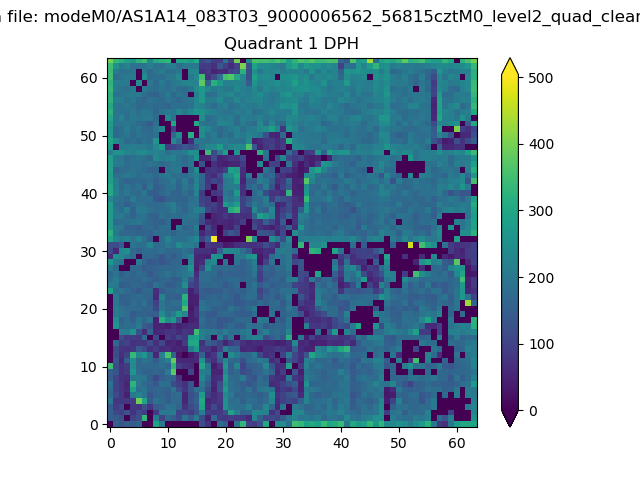 |
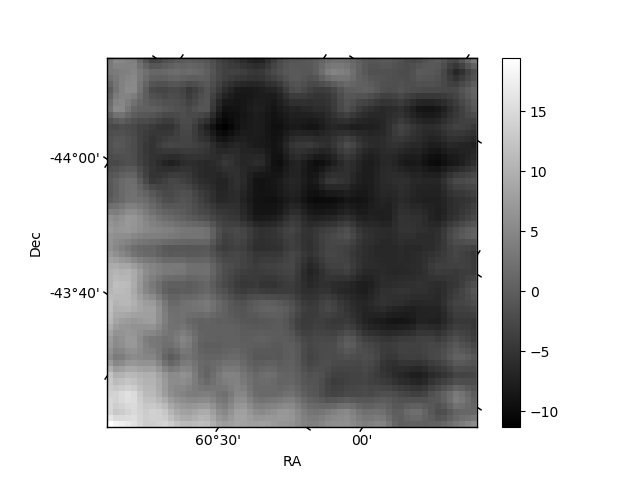
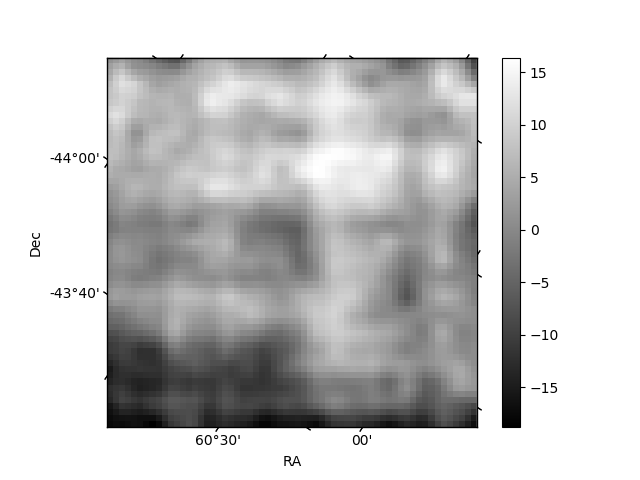
Quadrant B |
|---|---|---|---|
| Quadrant D | 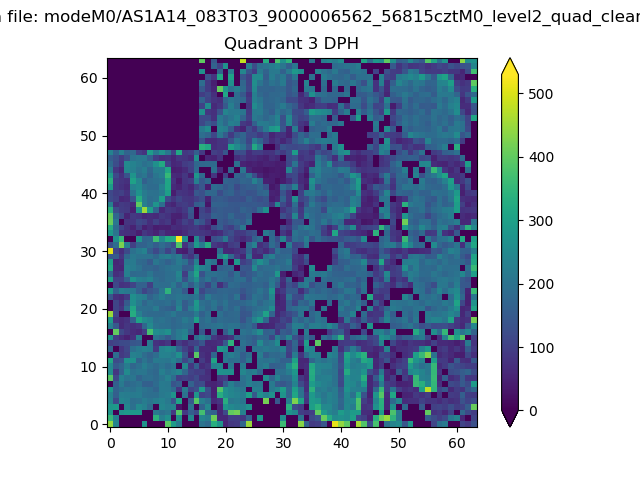 |
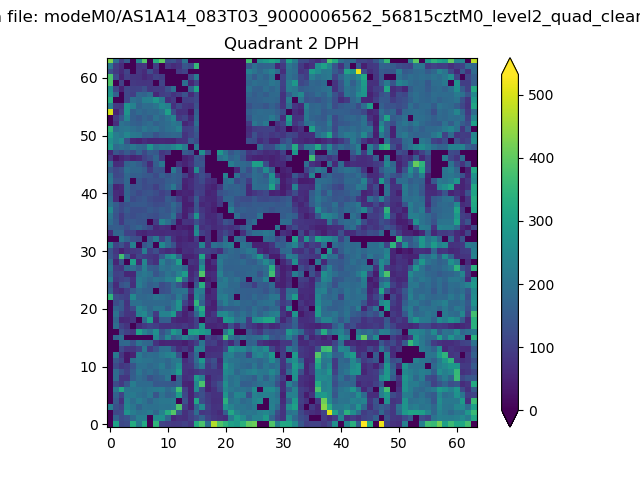 |
Quadrant C |
| Plot type | Count rate plots | Images |
|---|---|---|
| Comparison with Poisson distribution Blue bars denote a histogram of data divided into 1 sec bins. Red curve is a Poisson curve with rate = median count rate of data. |
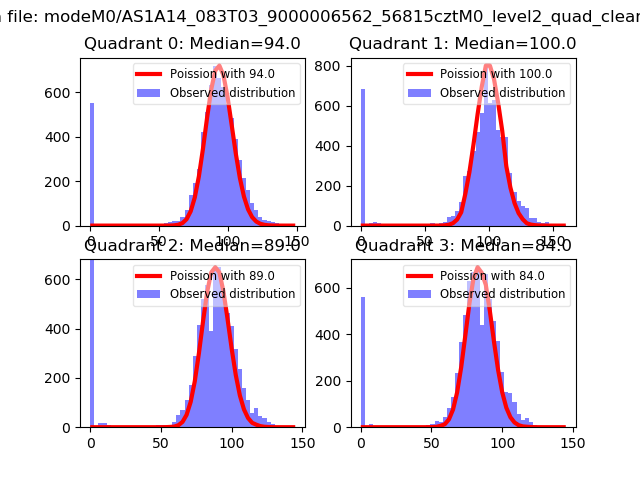 |
 |
| Quadrant-wise count rates Data is divided into 100 sec bins |
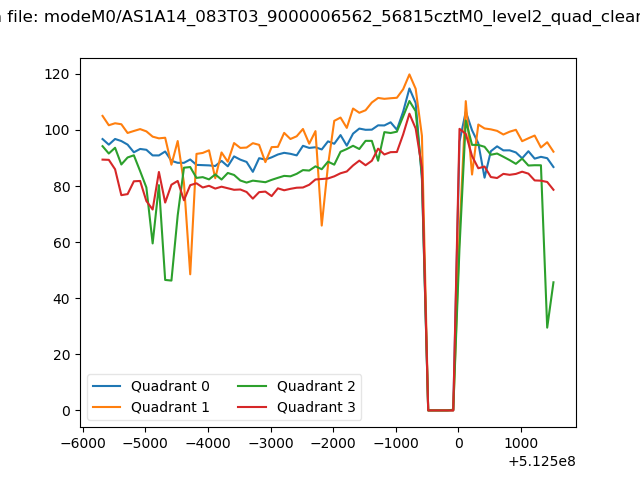 |
|
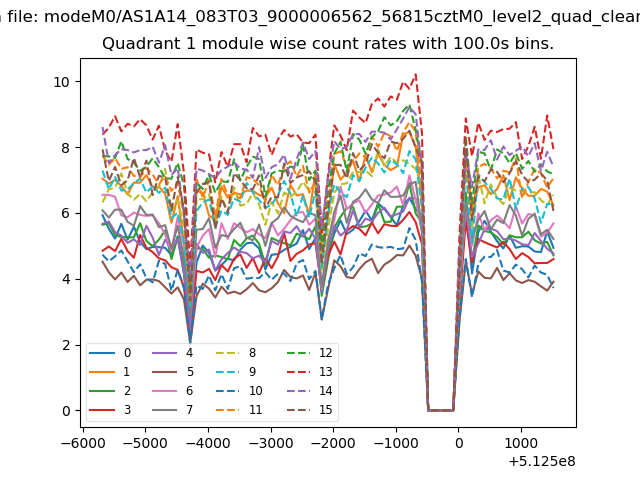
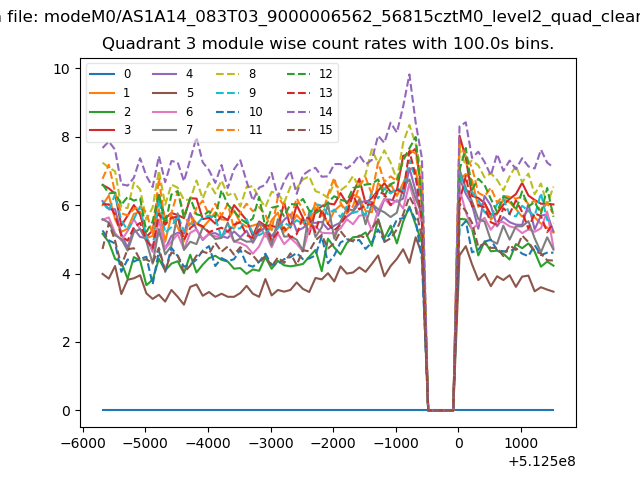
| Module-wise count rates for Quadrant A Data is divided into 100 sec bins |
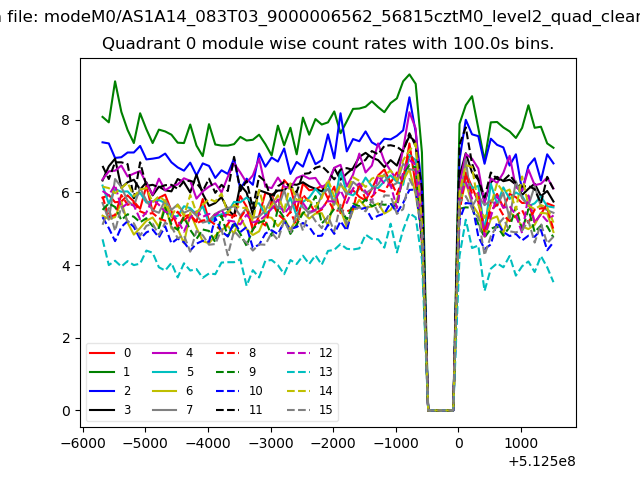 |
 |
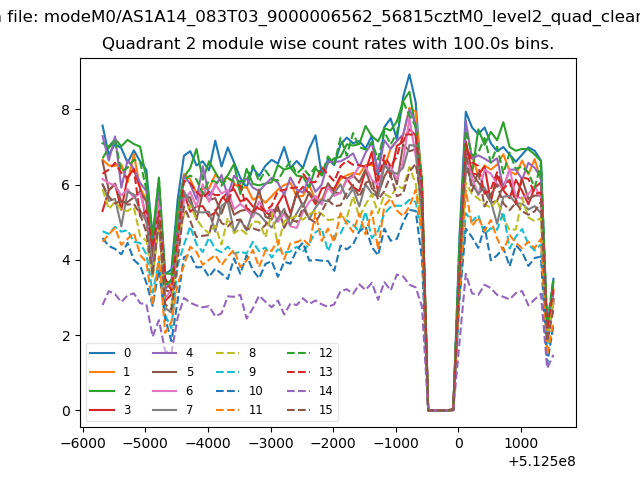
| Module-wise count rates for Quadrant B Data is divided into 100 sec bins |
 |
 |
| Module-wise count rates for Quadrant C Data is divided into 100 sec bins |
 |
 |
| Module-wise count rates for Quadrant D Data is divided into 100 sec bins |
 |
 |
| Parameter | Plot |
|---|---|
| CZT HV Monitor | 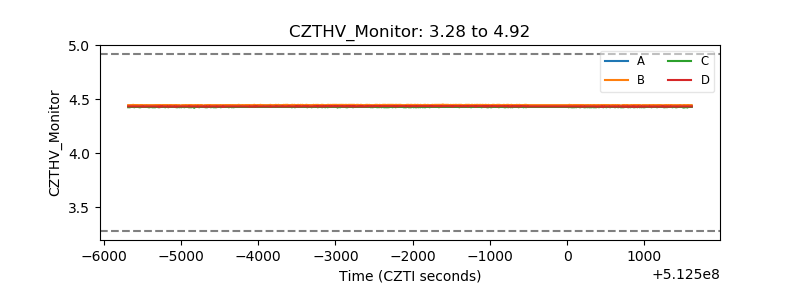 |
| D_VDD | 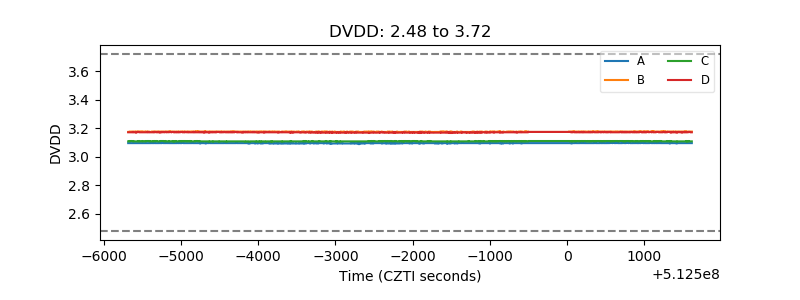 |
| Temperature 1 | 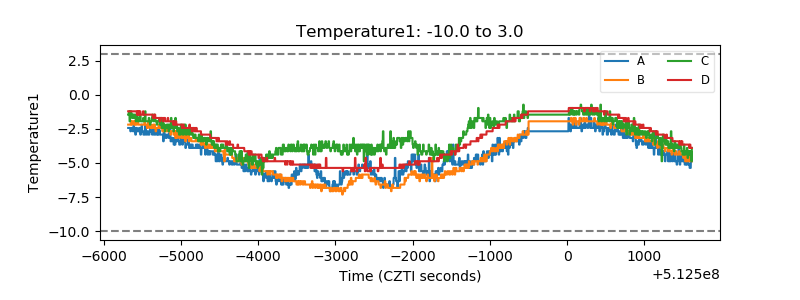 |
| Veto HV Monitor | 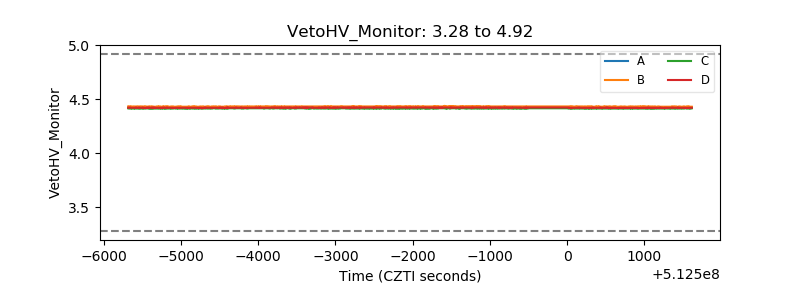 |
| Veto LLD | 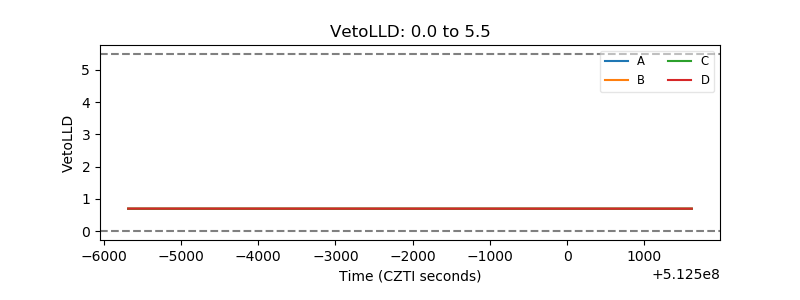 |
| Alpha Counter | 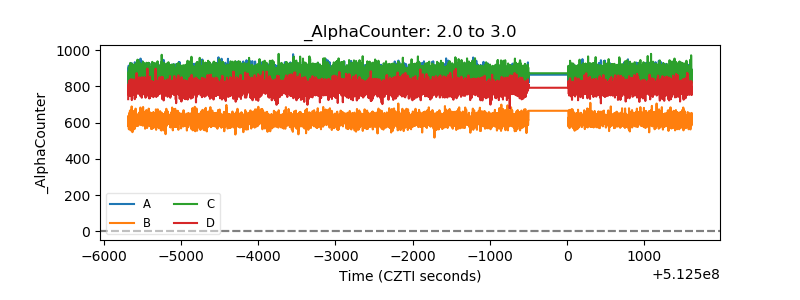 |
| _CPM_Rate | 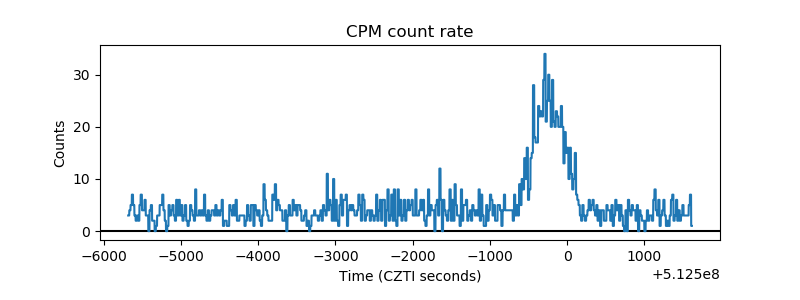 |
| CZT Counter | 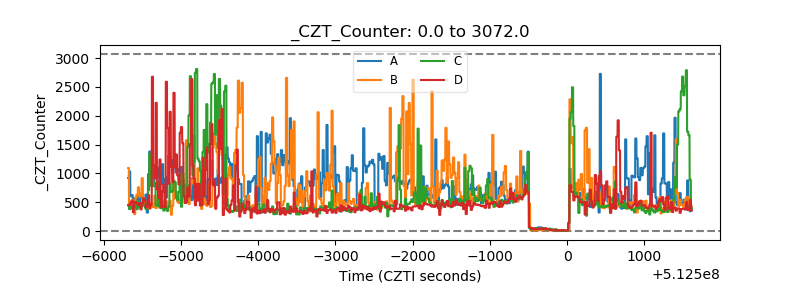 |
| +2.5 Volts monitor |  |
| +5 Volts monitor |  |
| _ROLL_ROT | 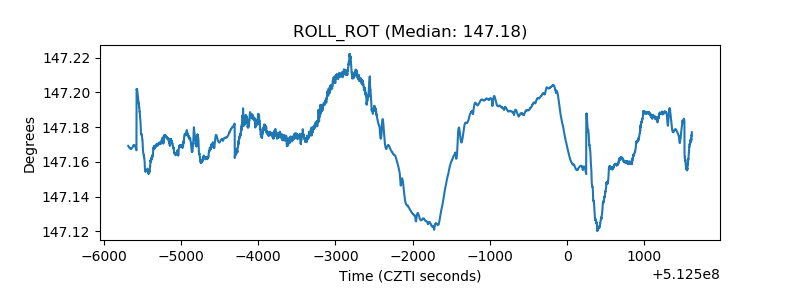 |
| _Roll_DEC | 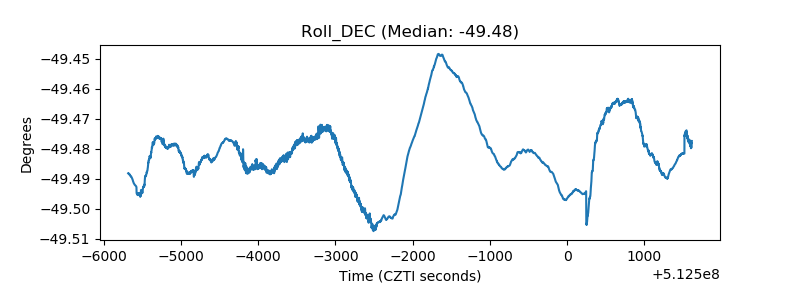 |
| _Roll_RA | 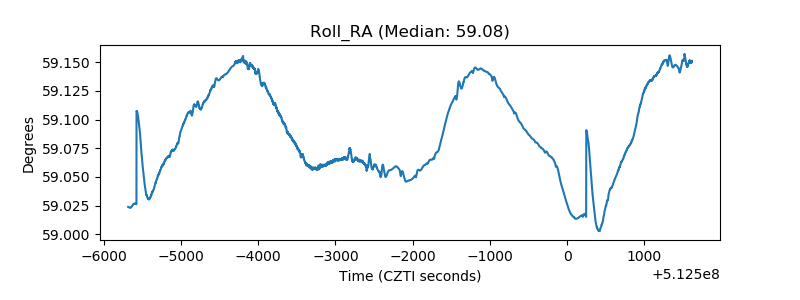 |
| Veto Counter | 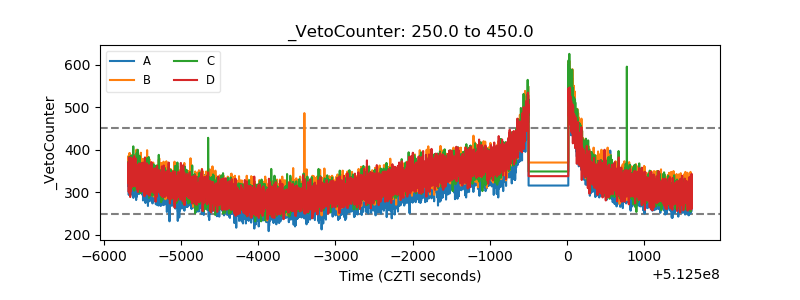 |